By Sean Boynton 12 April 2019 (Global News) – If you live in a newly-built luxury condo building, you may be enjoying some of the perks being offered: swimming pools, fitness centres, even movie theatres and bowling alleys. But a new report from BC Hydro says those amenities come at a cost — and it […]
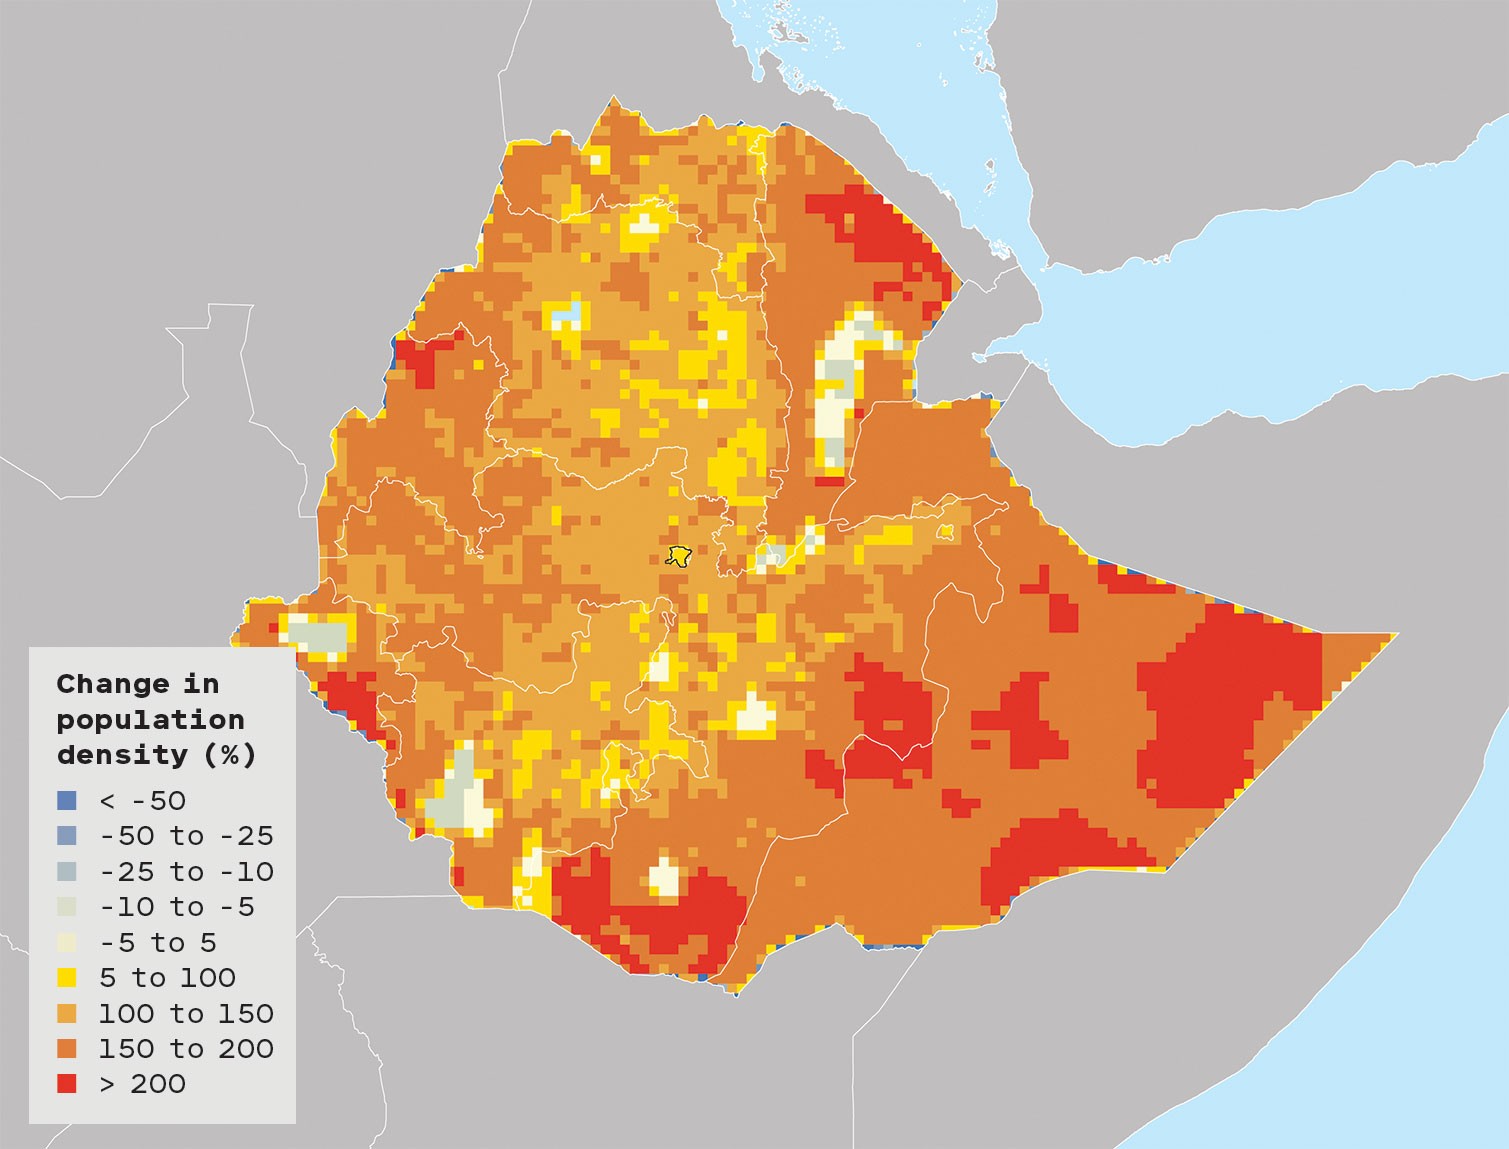
By Susan Cosier 24 April 2019 (Technology Review) – In 2006, the British economist Nicholas Stern warned that one of the biggest dangers of climate change would be mass migration. “Climate-related shocks have sparked violent conflict in the past,” he wrote, “and conflict is a serious risk in areas such as West Africa, the Nile […]
By James Rainey 21 April 2019 SEATTLE (NBC News) – Erika Lundahl writes and performs her own songs. She works in Seattle for a company that publishes books on the environment. She thinks a lot about how best to occupy her place in the world. Yet, despite this full life, Lundahl, at 27, feels a […]
15 July 2018 (Desdemona Despair) – It’s well known that human population is increasing relentlessly, with no peak in sight for at least the next century. Various projections estimate that the population will be somewhere in the neighborhood of ten to twelve billion by the year 2100 (cf. New projection shows human population could reach […]
By Chris Mooney and Brady Dennis 31 May 2016 (Washington Post) – As summer temperatures finally settle in, many in the United States take it for granted that they can dial down the thermostat: Americans use 5 percent of all of their electricity cooling homes and buildings. In many other countries, however — including countries […]
3 July 2015 (Desdemona Despair) – Will world agriculture be able to support a human population of 12 billion people in the year 2100? The answer largely turns on how much land is available for growing crops. Unfortunately, the world’s arable land area is declining at an enormous rate. The UN Convention to Combat Desertification […]
13 June 2015 (Desdemona Despair) – Data show that growth of human carbon emissions in the modern era is pretty close to exponential (cf. “Graph of the Day: Global carbon emissions from fossil fuels, 1751-2013”). But what about carbon emissions per person? The Carbon Dioxide Information Analysis Center (CDIAC) maintains a database of fossil-fuel CO2 […]
20 November 2011 (Desdemona Despair) – Here’s Desdemona giving a presentation on the accelerating destruction of the oceans by various human activities. It’s basically Graph of the Day with narration. Download the slide deck: http://www.leftopia.com/presentations/State_Of_The_Oceans_2011.pdf http://www.leftopia.com/presentations/State_Of_The_Oceans_2011.pptx State of the Oceans 2011 Technorati Tags: ocean acidification,global warming,climate change,phenology,overfishing,ocean overexploitation,fish decline,mass extinction,extinction,coral,habitat loss,ecosystem disruption,dead zone,ocean anoxia,phosphorus,nitrogen,carbon,carbon dioxide,overpopulation,doom