Graph of the Day: World arable land per capita, 1961-2012
3 July 2015 (Desdemona Despair) – Will world agriculture be able to support a human population of 12 billion people in the year 2100? The answer largely turns on how much land is available for growing crops. Unfortunately, the world’s arable land area is declining at an enormous rate. The UN Convention to Combat Desertification (UNCCD) estimates that “land covering 12 million hectares, equivalent to Bulgaria or Benin, is lost every year.” (Desertification pdf, p. 12)
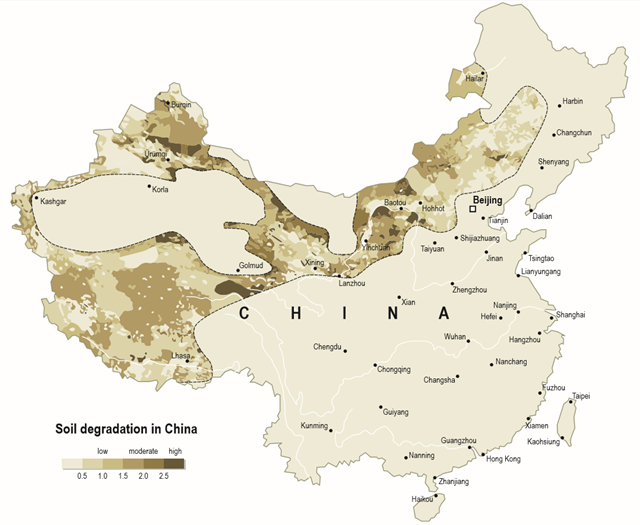
Causes of desertification
This loss of arable land is caused by humans wrecking the soil and lowering water tables:
In countries where major economic resources are dependent on agricultural activities, there are few alternative sources of income, or none at all. Soil is damaged by excessive use when farmers neglect or shorten fallow periods, which are necessary to allow the soil to recover sufficiently to produce enough food to feed the population. This in turn causes the soil to lose organic matter, limiting plant growth and reducing vegetation cover. The bare soil is more vulnerable to the effects of erosion. Four human activities are the most immediate causes:
- Over-cultivation exhausts the soil;
- Overgrazing removes the vegetation cover that protects it from erosion;
- Deforestation destroys the trees that bind the soil to the land; and
- Poorly drained irrigation systems turn croplands salty.
Extractive industries advance land degradation by lowering water tables, disturbing land, and accelerating soil erosion. Inadequate knowledge on sustainable land management, unfavourable trade conditions in developing countries, non-ecological tourism, and other socio-economic and political factors, which intensify the effects of desertification, create another form of impact. These factors interact with the causes above and are often the underlying drivers of man-made desertification. (Desertification pdf, p. 14)
The world supply of arable land
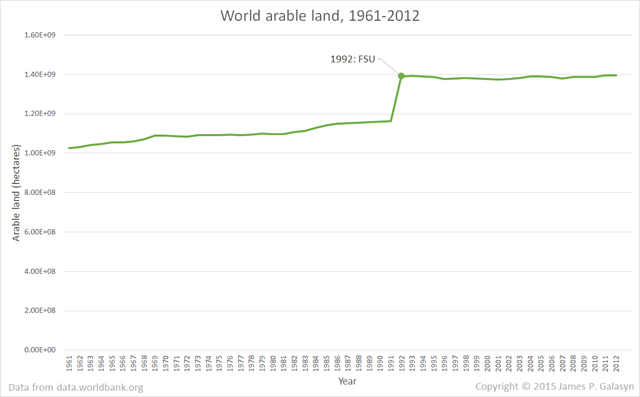
The World Bank maintains an extensive database of economic information, including arable land for all nations. Plotting the raw data for total arable land gives us this graph: The most obvious feature is the discontinuity in 1992: this is when nations of the Former Soviet Union (FSU) began reporting statistics to the World Bank. The other obvious feature is that growth of arable land has been flat since about that time: for the last 25 years or so, the area of arable land has not increased or decreased significantly.
Making up for desertification
Given that we’re losing 12 million hectares of arable land annually, how is the total area remaining stable? The answer is conversion of wildlands to agricultural land.
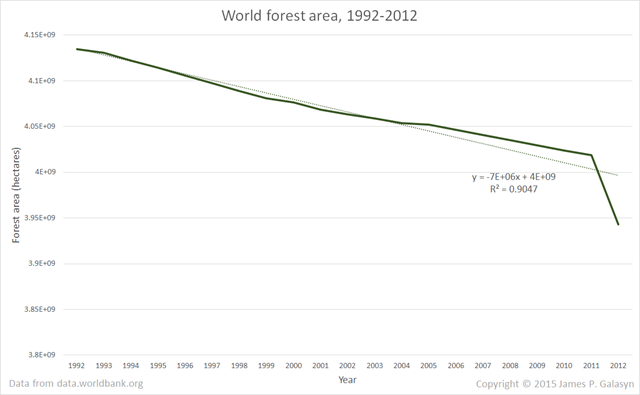
- Deforestation accounts for about 7.3 million hectares per year (“Deforestation: Facts, Causes & Effects”). Using World Bank data for forest area, I estimate a loss rate of about 7 million hectares per year (Forest area (sq km) World Bank.xslx).
- The total area of freshwater wetlands and floodplains was reduced by nearly two-thirds between 1997 and 2011, from an estimated 165 million hectares to 60 million hectares (“Changes in the global value of ecosystem services” [pdf]), so assume an average loss rate of around 7.5 million hectares per year.
- Add these numbers, and there are at least 14.5 million hectares per year of wildlands being converted to human uses, probably mostly for agriculture.
Arable land for every person
Humans are destroying soil at a rate of 12 million hectares per year, and we’re making up for it by destroying forest and wetlands at a comparable rate. But is all of this destruction of the natural world enabling us to keep up with the ever-growing human population? Here are graphs of human population and world arable land. I’ve patched up the arable land trace by adding the FSU delta from 1991 to 1992 (229,924,500 hectares) to all of the values before 1991, which gives a tolerably smooth curve. (Doing the analysis with only data from 1992 onward doesn’t change the result by much.)
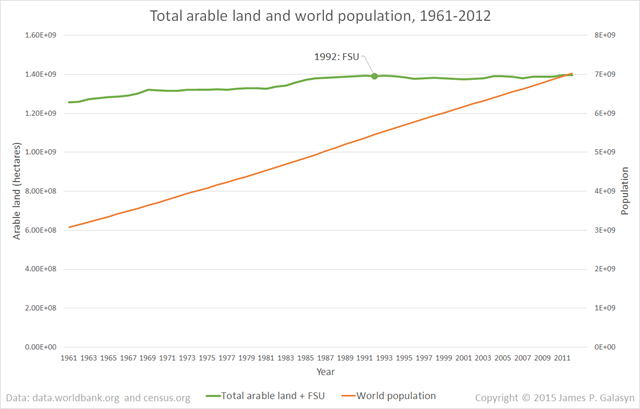
With these two data sets, it’s easy to calculate arable land per capita.
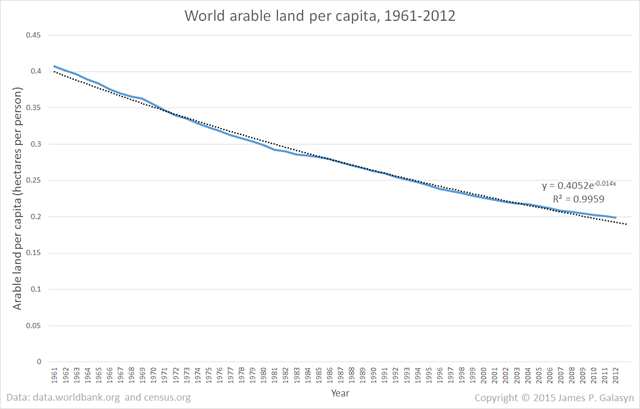
This graph makes it clear that arable land per capita is monotonically decreasing. The decline isn’t linear; in fact, it’s almost perfectly exponential, with R2 = 0.996 for the default Excel curve fit. Currently, the world has 0.2 hectares (0.49 acres) of arable land per person, down from 0.4 in 1962. Extrapolating the exponential curve, we’ll be down to 0.1 by around 2050, and 0.05 by 2100. So, every 50 years, arable land per capita declines by half. By the year 2100, each person will be supported by just 0.05 hectares (0.12 acres) of agricultural land.
A note about deforestation
At the current rate of depletion (7.5 million ha/yr), wild wetlands and floodplains will be gone within a decade, so most of the wildlands conversion will come from forests. Once we run out of wetlands, we’ll need to increase the deforestation rate. Assuming converted wetland has the same agricultural yield as converted forest, the deforestation rate would nearly double. Using the World Bank forest area data, I estimate that it will take humans around 550-650 years to burn through all of the remaining forest at the current rate; half that time if the burn rate doubles when the wetland/floodplain supply runs out. The sudden decline in forest area in 2011-2012 may be the beginning of substitution away from wetlands/floodplains and toward deforestation.
Agricultural intensification
Feeding the ever-increasing human population requires the continuous destruction of wildlands, but it also requires continuously increasing agricultural intensity: if, in 2050, arable land per capita is half of its current value, crop yields must double to maintain the status quo. But agricultural intensification may raise the desertification rate, and even without considering the problem of soil degradation, there are serious doubts about increasing agricultural yields enough to keep up with human population growth (cf. Graph of the Day: The Global Agricultural Productivity Gap, 2010-2050; Graph of the Day: Global food production projected to the year 2050). You can get the data and related graphs here: Arable land (hectares) World Bank.xlsx.
Fucking Awesome
https://www.reddit.com/r/collapse/comments/3biw92/how_fast_will_collapse_be/