Standing perfectly still: no progress in replacing fossil fuels for the past twenty years

15 July 2018 (Desdemona Despair) – It’s well known that human population is increasing relentlessly, with no peak in sight for at least the next century. Various projections estimate that the population will be somewhere in the neighborhood of ten to twelve billion by the year 2100 (cf. New projection shows human population could reach 12 billion by 2100).
Less well known is the fact that carbon emissions per capita are increasing relentlessly as well. As human population grows, it emits carbon at an exponentially greater rate per person. Only two periods in modern history have broken this rule, both characterized by abrupt, global, economic dislocations. As soon as the conditions that caused the dislocations are resolved, exponential growth returns immediately (cf. Graph of the Day: Carbon emissions and human population, 1751-2013).
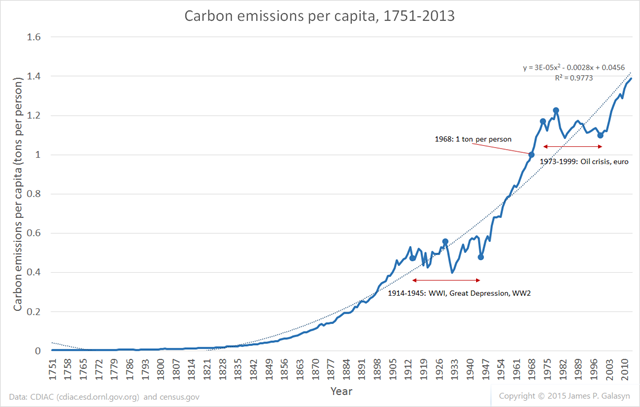
Carbon emitted per capita surpassed one ton per person in 1968 and has never fallen below this value since then. Extrapolating shows that emissions per capita will surpass two tons per person around the year 2050.
Desdemona has long argued that because human population is always increasing, and because more humans are enjoying an increasing standard of living (and consuming an ever-increasing amount of energy per person), we’ll be forced to throw everything we have at the problem of powering civilization. This means that there will be little substitution away from fossil fuels; solar and wind energy won’t replace coal and oil. We will need it all.
Now we have the first solid evidence that this is the case. The 2018 edition of BP’s Statistical Review of World Energy has this remarkable graph:
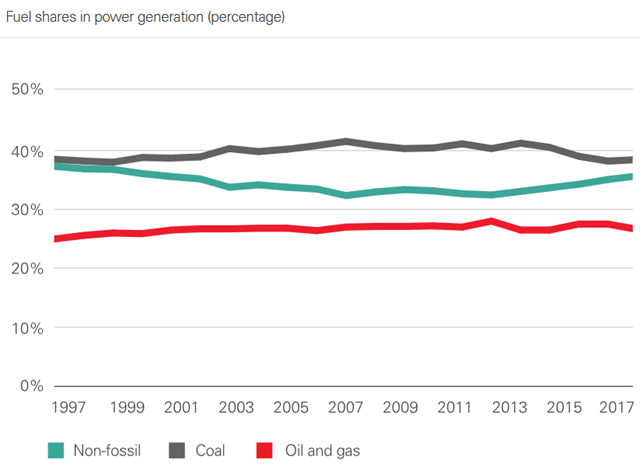
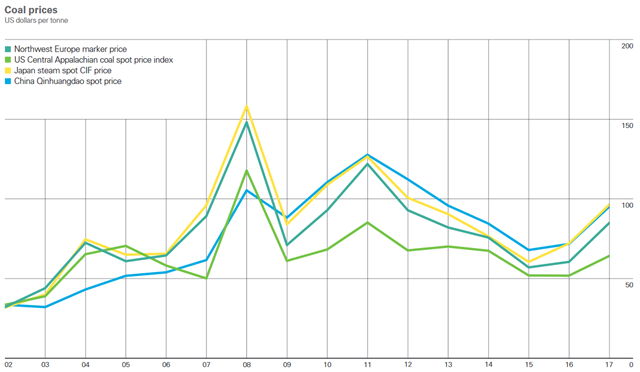
As a percentage of the total energy mix, coal and oil are just as important as they were in 1997. During most of this period, the price of coal has fluctuated between $50 and $100 per ton; there is no evidence of a collapse in demand for coal, or even a noticeable reduction. The percentage of energy contributed by alternative energy decreased for much of this period, and only recently has recovered to near its 1997 value.
Spencer Dale, BP’s group chief economist, summarizes it this way:
Despite the extraordinary growth in renewables in recent years, and the huge policy efforts to encourage a shift away from coal into cleaner, lower carbon fuels, there has been almost no improvement in the power sector fuel mix over the past 20 years. The share of coal in the power sector in 1998 was 38 percent – exactly the same as in 2017 – with the slight edging down in recent years simply reversing the drift up in the early 2000s associated with China’s rapid expansion. The share of non-fossil in 2017 is actually a little lower than it was 20 years ago, as the growth of renewables hasn’t offset the declining share of nuclear. … To have any chance of getting on a path consistent with meeting the Paris climate goals, there will need to be significant improvements in the power sector. But this is one area where at the global level we haven’t even taken one step forward, we have stood still, perfectly still, for the past 20 years. This chart should serve as a wake-up call for all of us.
Spencer Dale, BP’s group chief economist
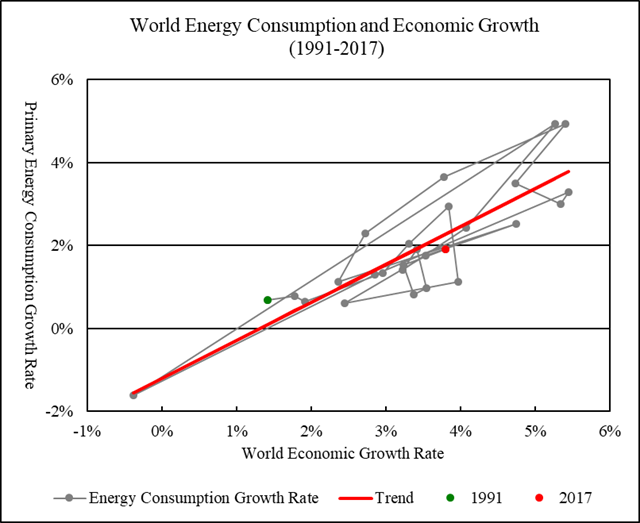
In the shadow of a massive increase in human population – at least 32 percent by 2100 – the only hope is that energy efficiency increases enormously in the immediate future. But in spite of recent optimistic declarations that economic activity has finally “decoupled” from carbon emissions, there’s little evidence that this is happening. Carbon emissions increased by 1.6 percent in 2017, after a couple of years of staying flat, and the ratio of Primary Energy Consumption to World Economic Growth Rate shows that 2017 is almost exactly on the established trend line.
It’s possible that a massive increase in energy efficiency will deflect this curve downward at some point in the future, but there’s no evidence that this happening.We’ve seen other hopeful trends from early in the new century reverse abruptly, like deforestation (cf. 2017 was the second-worst year on record for global deforestation). As long as human population continues its inexorable increase – adding 83 million people per year – we can expect to be disappointed many more times.