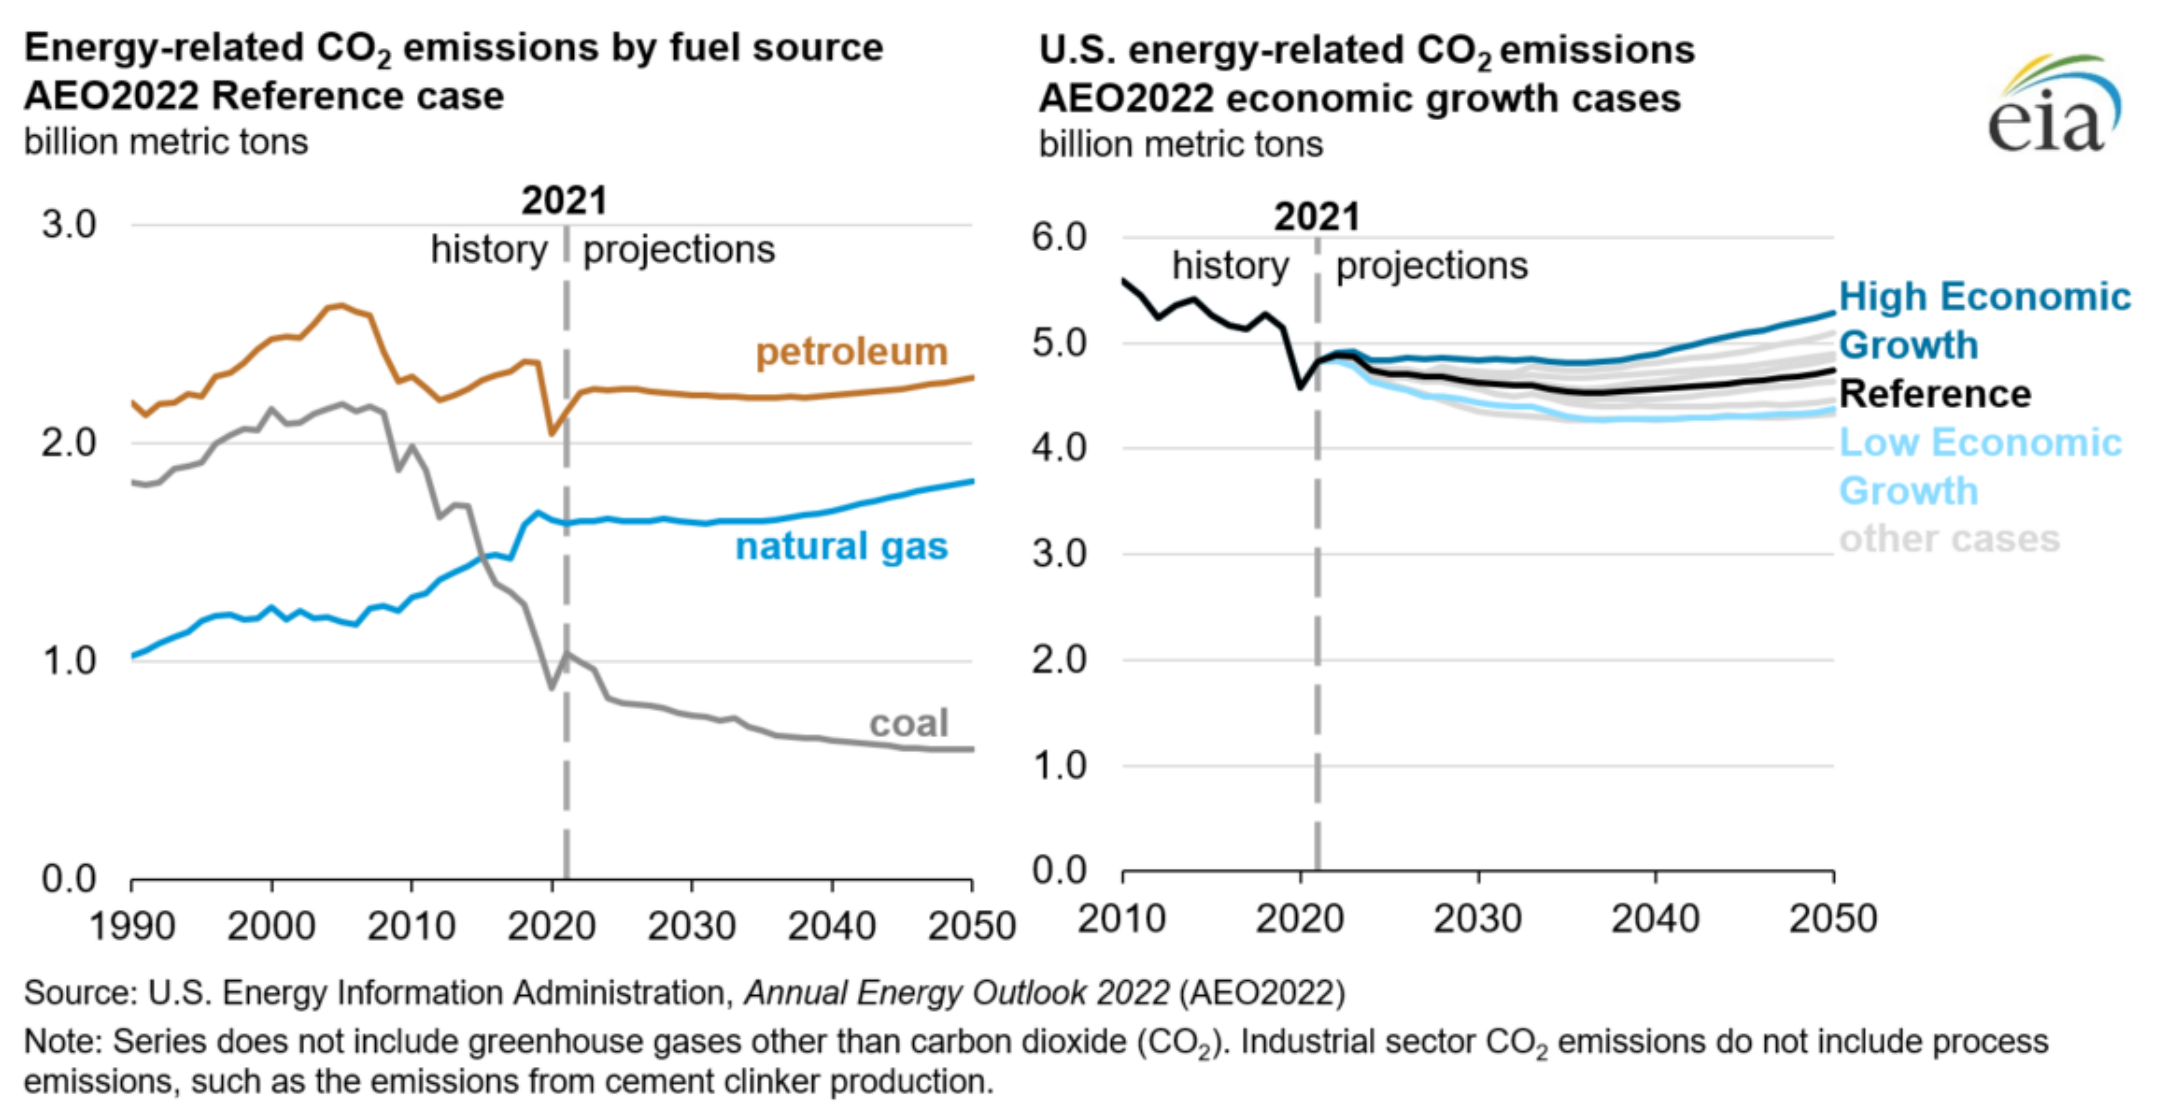
Projected U.S. energy-related carbon dioxide (CO2) emissions by fuel source in the AEO2022 reference case (left) and U.S. Energy-related CO2 emissions by AEO2022 economic growth cases (right). Energy‐related CO2 emissions dip through 2035 before climbing in later projection years. Graphic: EIA

U.S. energy projections to 2050: Fossil fuels still most-consumed energy sources through 2050 – Energy consumption increases as population and economic growth outweigh efficiency gains – Energy‐related CO2 emissions dip through 2035 but climb later

3 March 2022 (EIA) – Key takeaways from the Reference case and side cases: Petroleum and natural gas remain the most-consumed sources of energy in the United States through 2050, but renewable energy is the fastest growing Motor gasoline remains the most prevalent transportation fuel despite electric vehicles gaining market share Energy-related carbon dioxide (CO2) […]

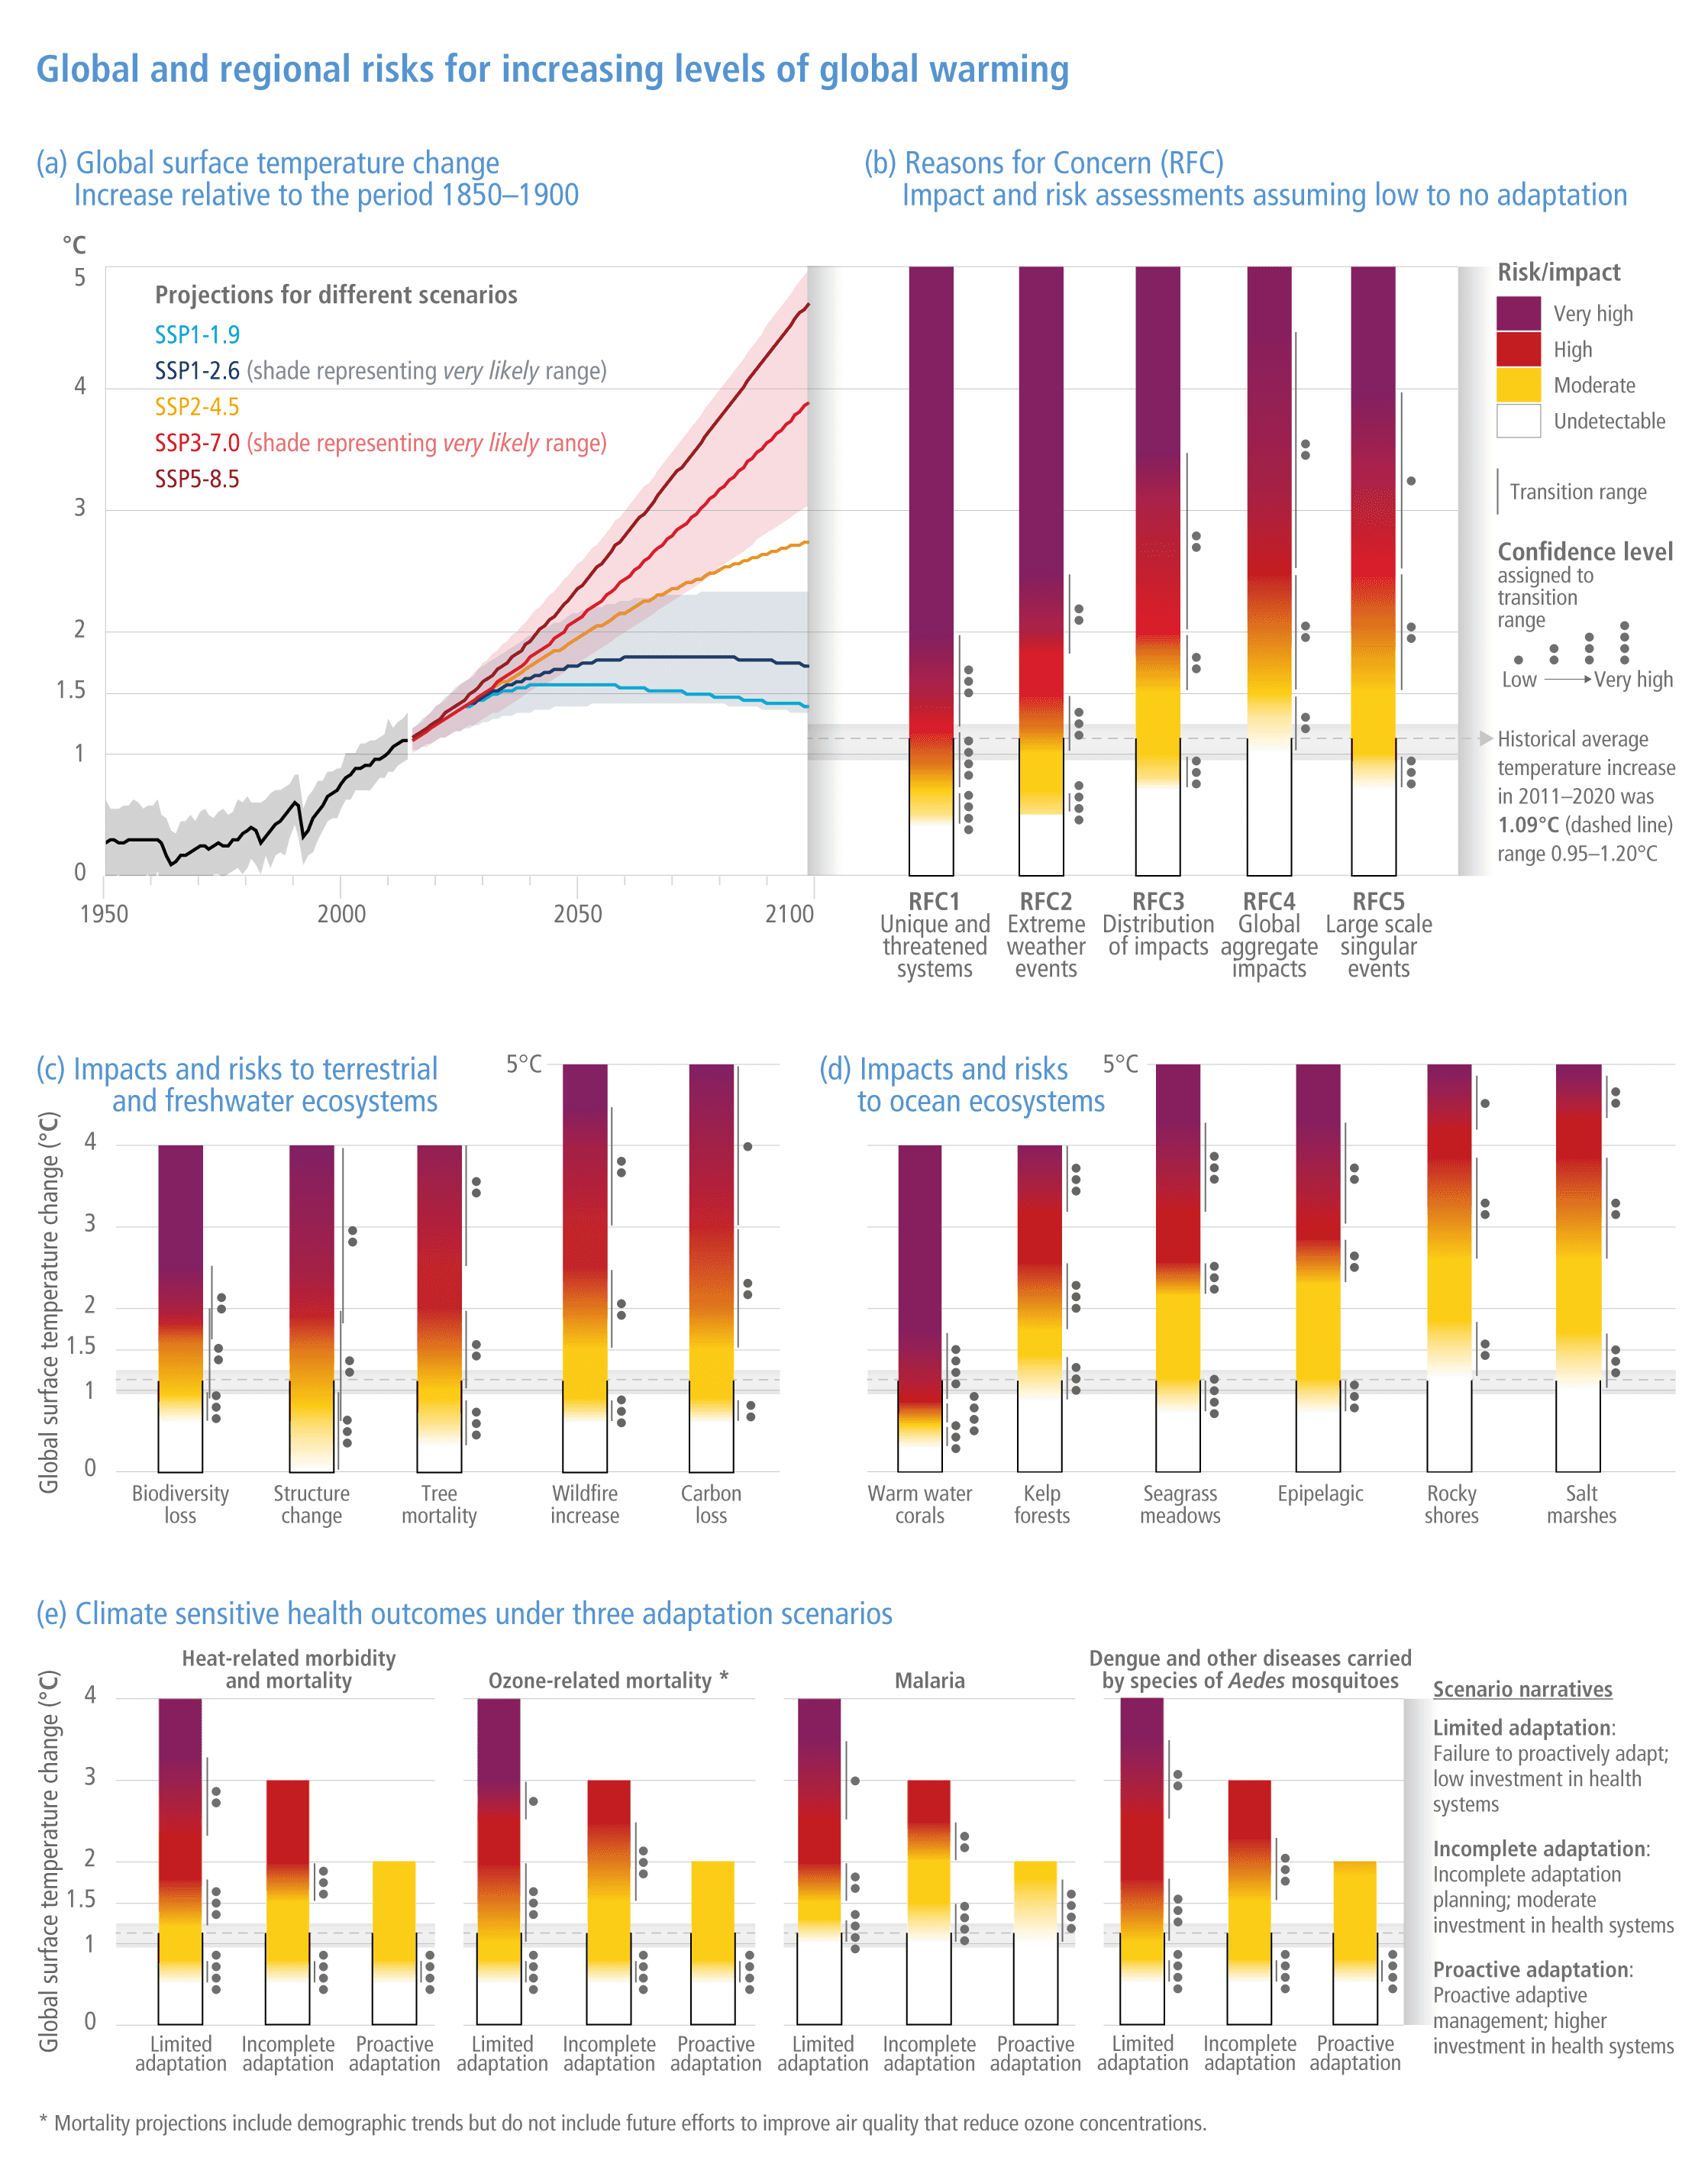
Global and regional risks for increasing levels of global warming. (a) Global surface temperature change increase relative to the period 1850-1900. (b) Reasons for concern (RFC) impact and risk assessments assuming low-to-no adaptation. (c) Impacts and risks to terrestrial and freshwater ecosystems. (d) Impacts and risks to ocean ecosystems. (e) Climate-sensitive health outcomes under three adaptation scenarios. Graphic: IPCC

Pacific Northwest heatwave in 2021 was a glimpse of global warming in North America – “We’re exposed to untold damage”

By Gillian Flaccus 1 March 2022 PORTLAND, Oregon (AP) – The U.S. Pacific Northwest was in the throes of a record-shattering heat wave last summer when a woman in her 70s was wheeled into an emergency room with symptoms of a life-threatening heat stroke. Desperate to cool her, Dr. Alexander St. John grabbed a body […]

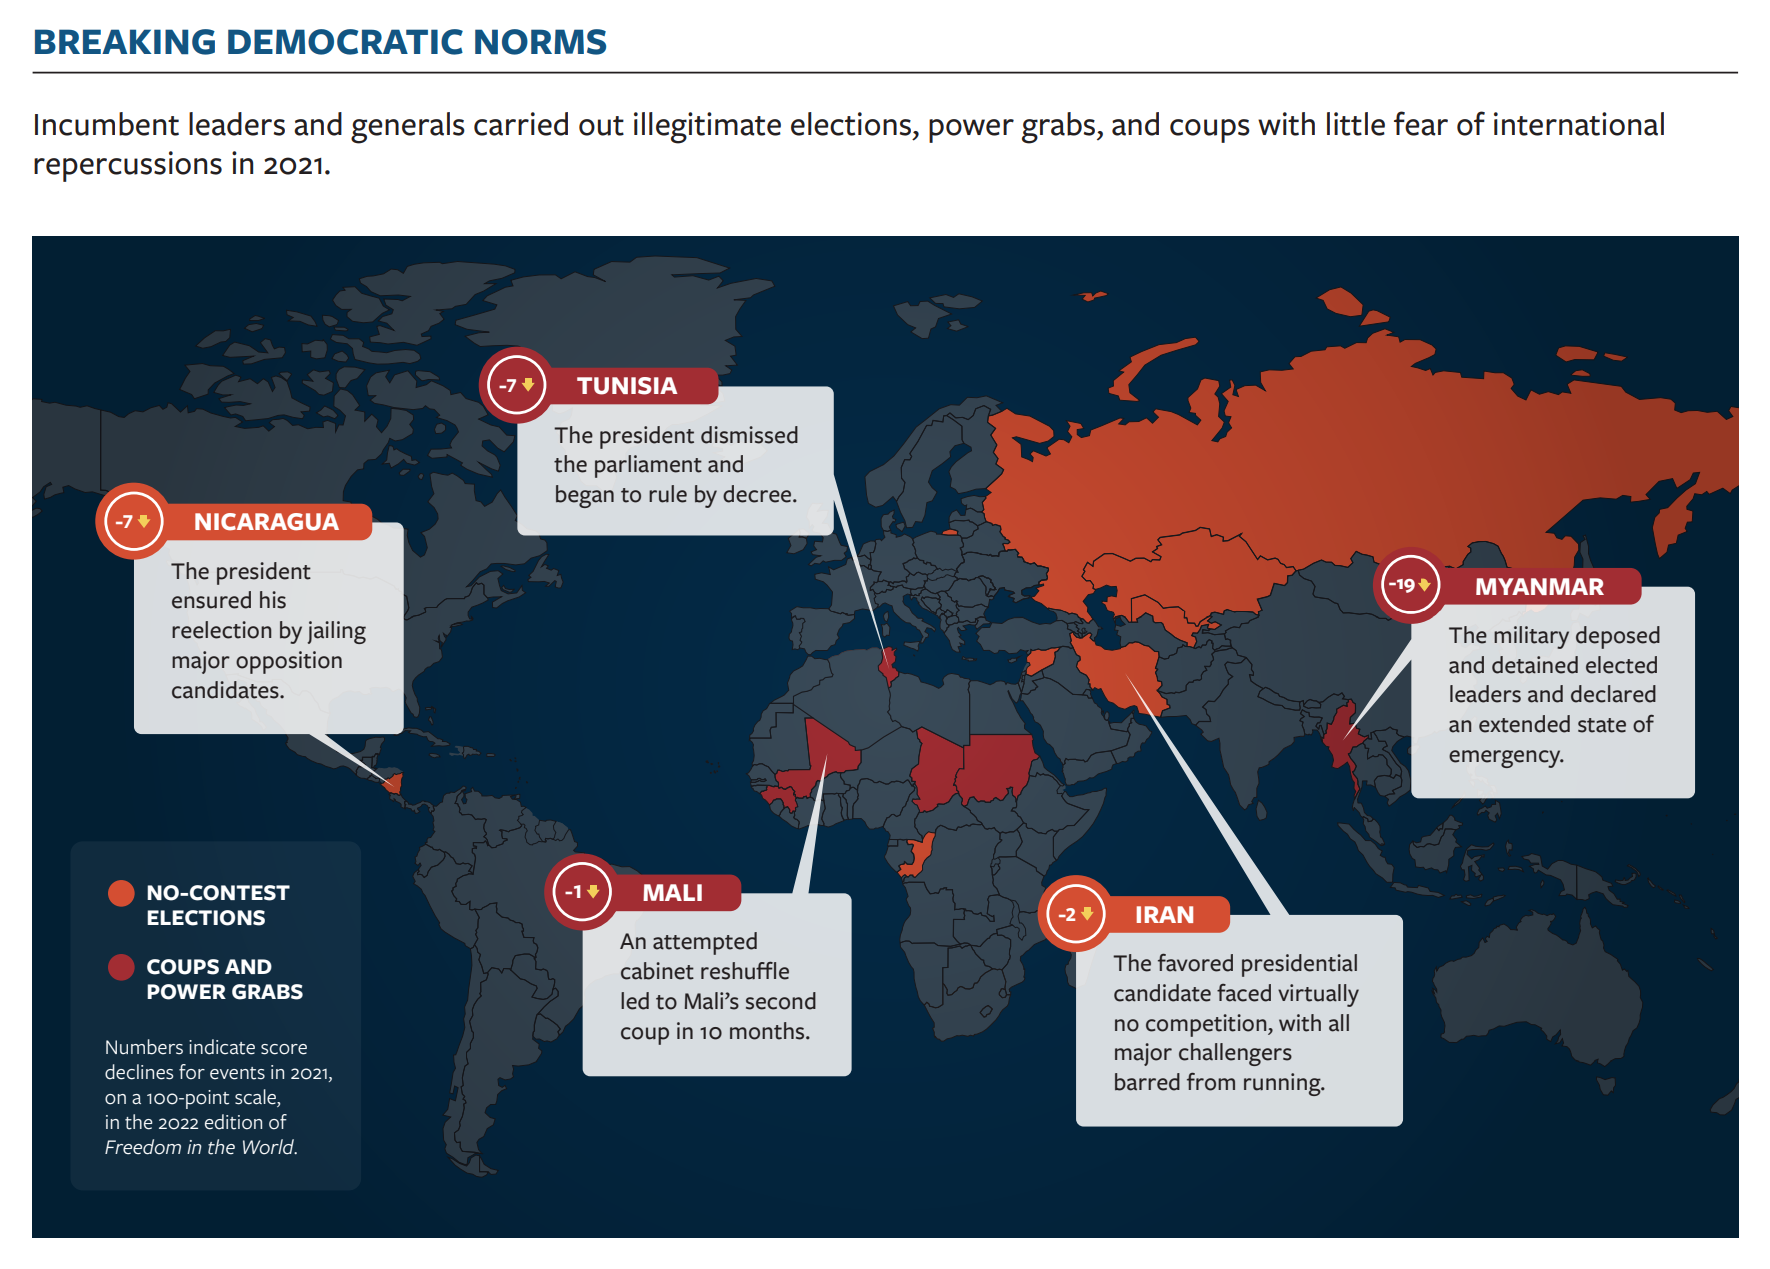
Map showing no-contest elections, coups, and power grabs globally in 2021. Numbers indicate score declines for events in 2021, on a 100-point scale, in the 2022 edition of the “Freedom in the World” report. Coups were more common in 2021 than in any of the previous 10 years. Graphic: Freedom House

The global expansion of authoritarian rule – “The present threat to democracy is the product of 16 consecutive years of decline in global freedom”

By Sarah Repucci and Amy Slipowitz 24 February 2022 (Freedom House) – Global freedom faces a dire threat. Around the world, the enemies of liberal democracy—a form of self-government in which human rights are recognized and every individual is entitled to equal treatment under law—are accelerating their attacks. Authoritarian regimes have become more effective at […]

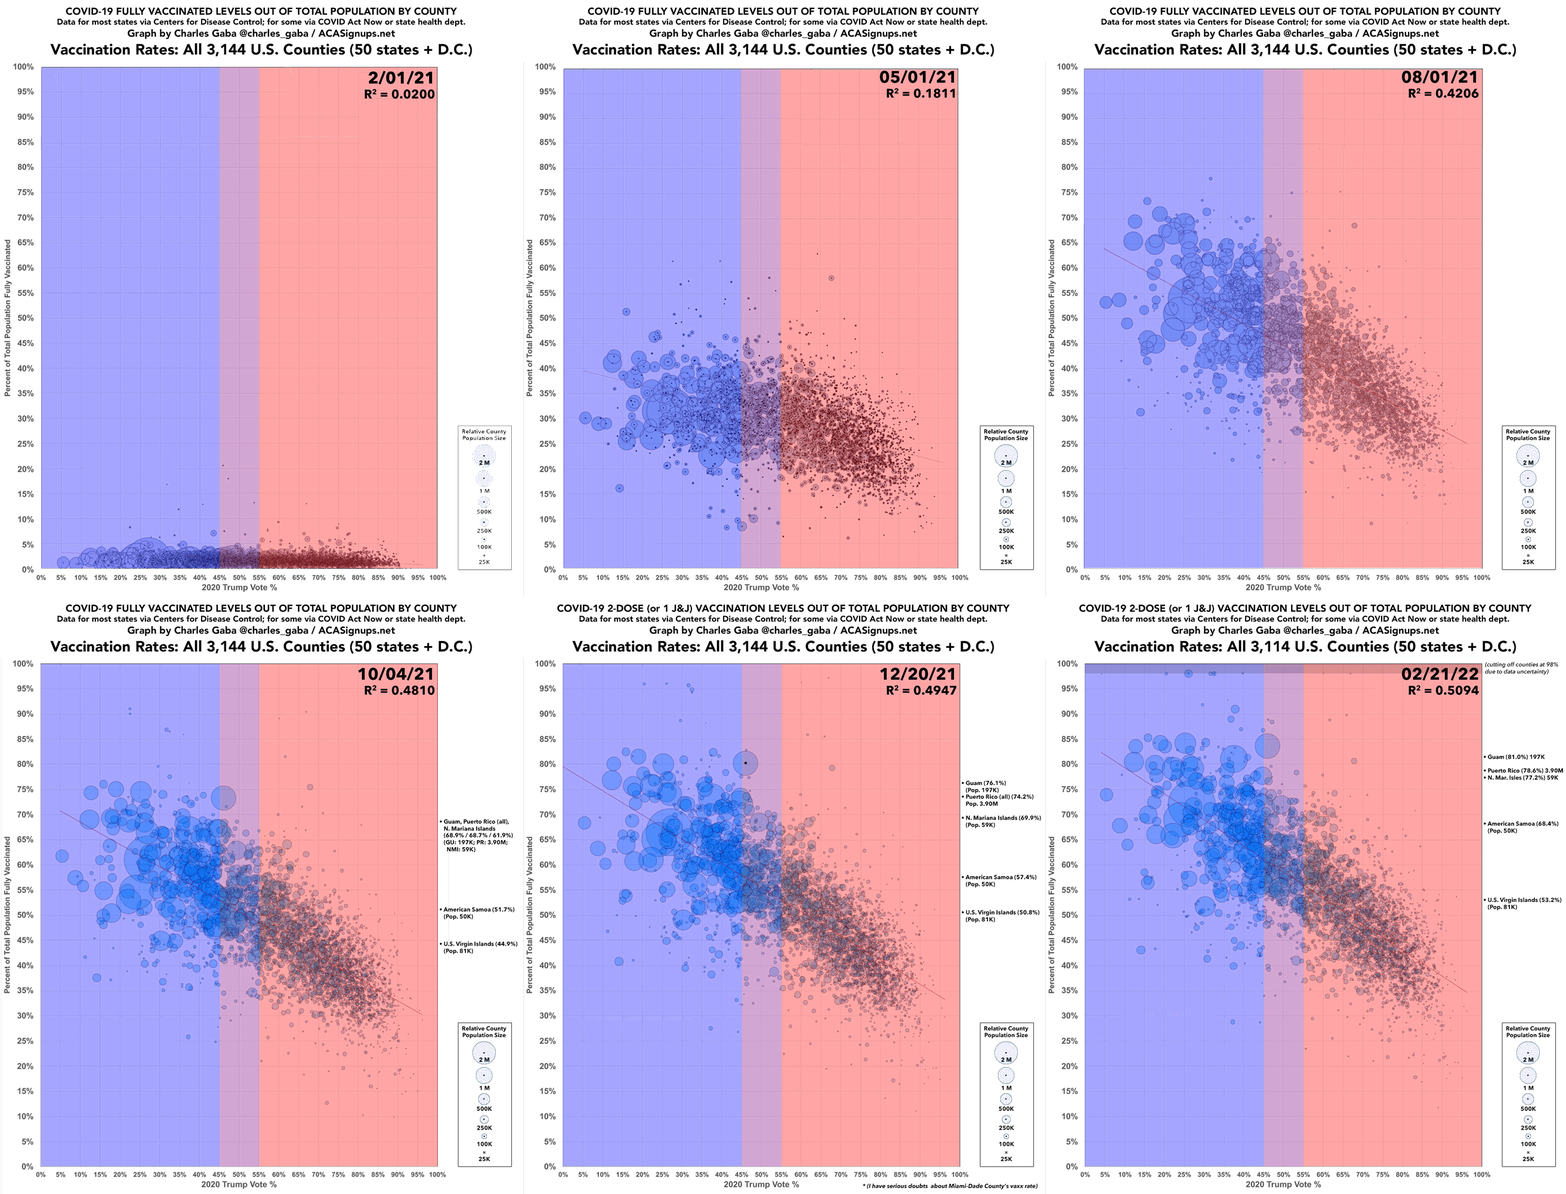
COVID-19 fully vaccinated levels out of total population by U.S. county, 1 February 2021 - 21 February 2022. In February and March 2021, there was virtually no partisan gap, when only seniors, healthcare workers, and some and other select groups were eligible to get COVID-19 vaccines. Starting in early April 2021, when all U.S. adults became eligible for the vaccine, the partisan divide started to ramp up quickly. The red/blue divide increased month after month regardless of other factors. Data: CDC / COVID Act Now / state health departments. Graph: Charles Gaba / ACA Signups

Graph of the Day: U.S. COVID-19 vaccinations by partisan lean, February 2021 – February 2022

By Charles Gaba 22 February 2022 (ACA Signups) – Last summer, I pulled together the occasional vaccination rate scatter plot graphs I’d been compiling for months into a single animated GIF image to show how both the correlation (R^2) and steepness (slope) of the partisan COVID vaccination divide grew from almost nothing at all to a gaping […]

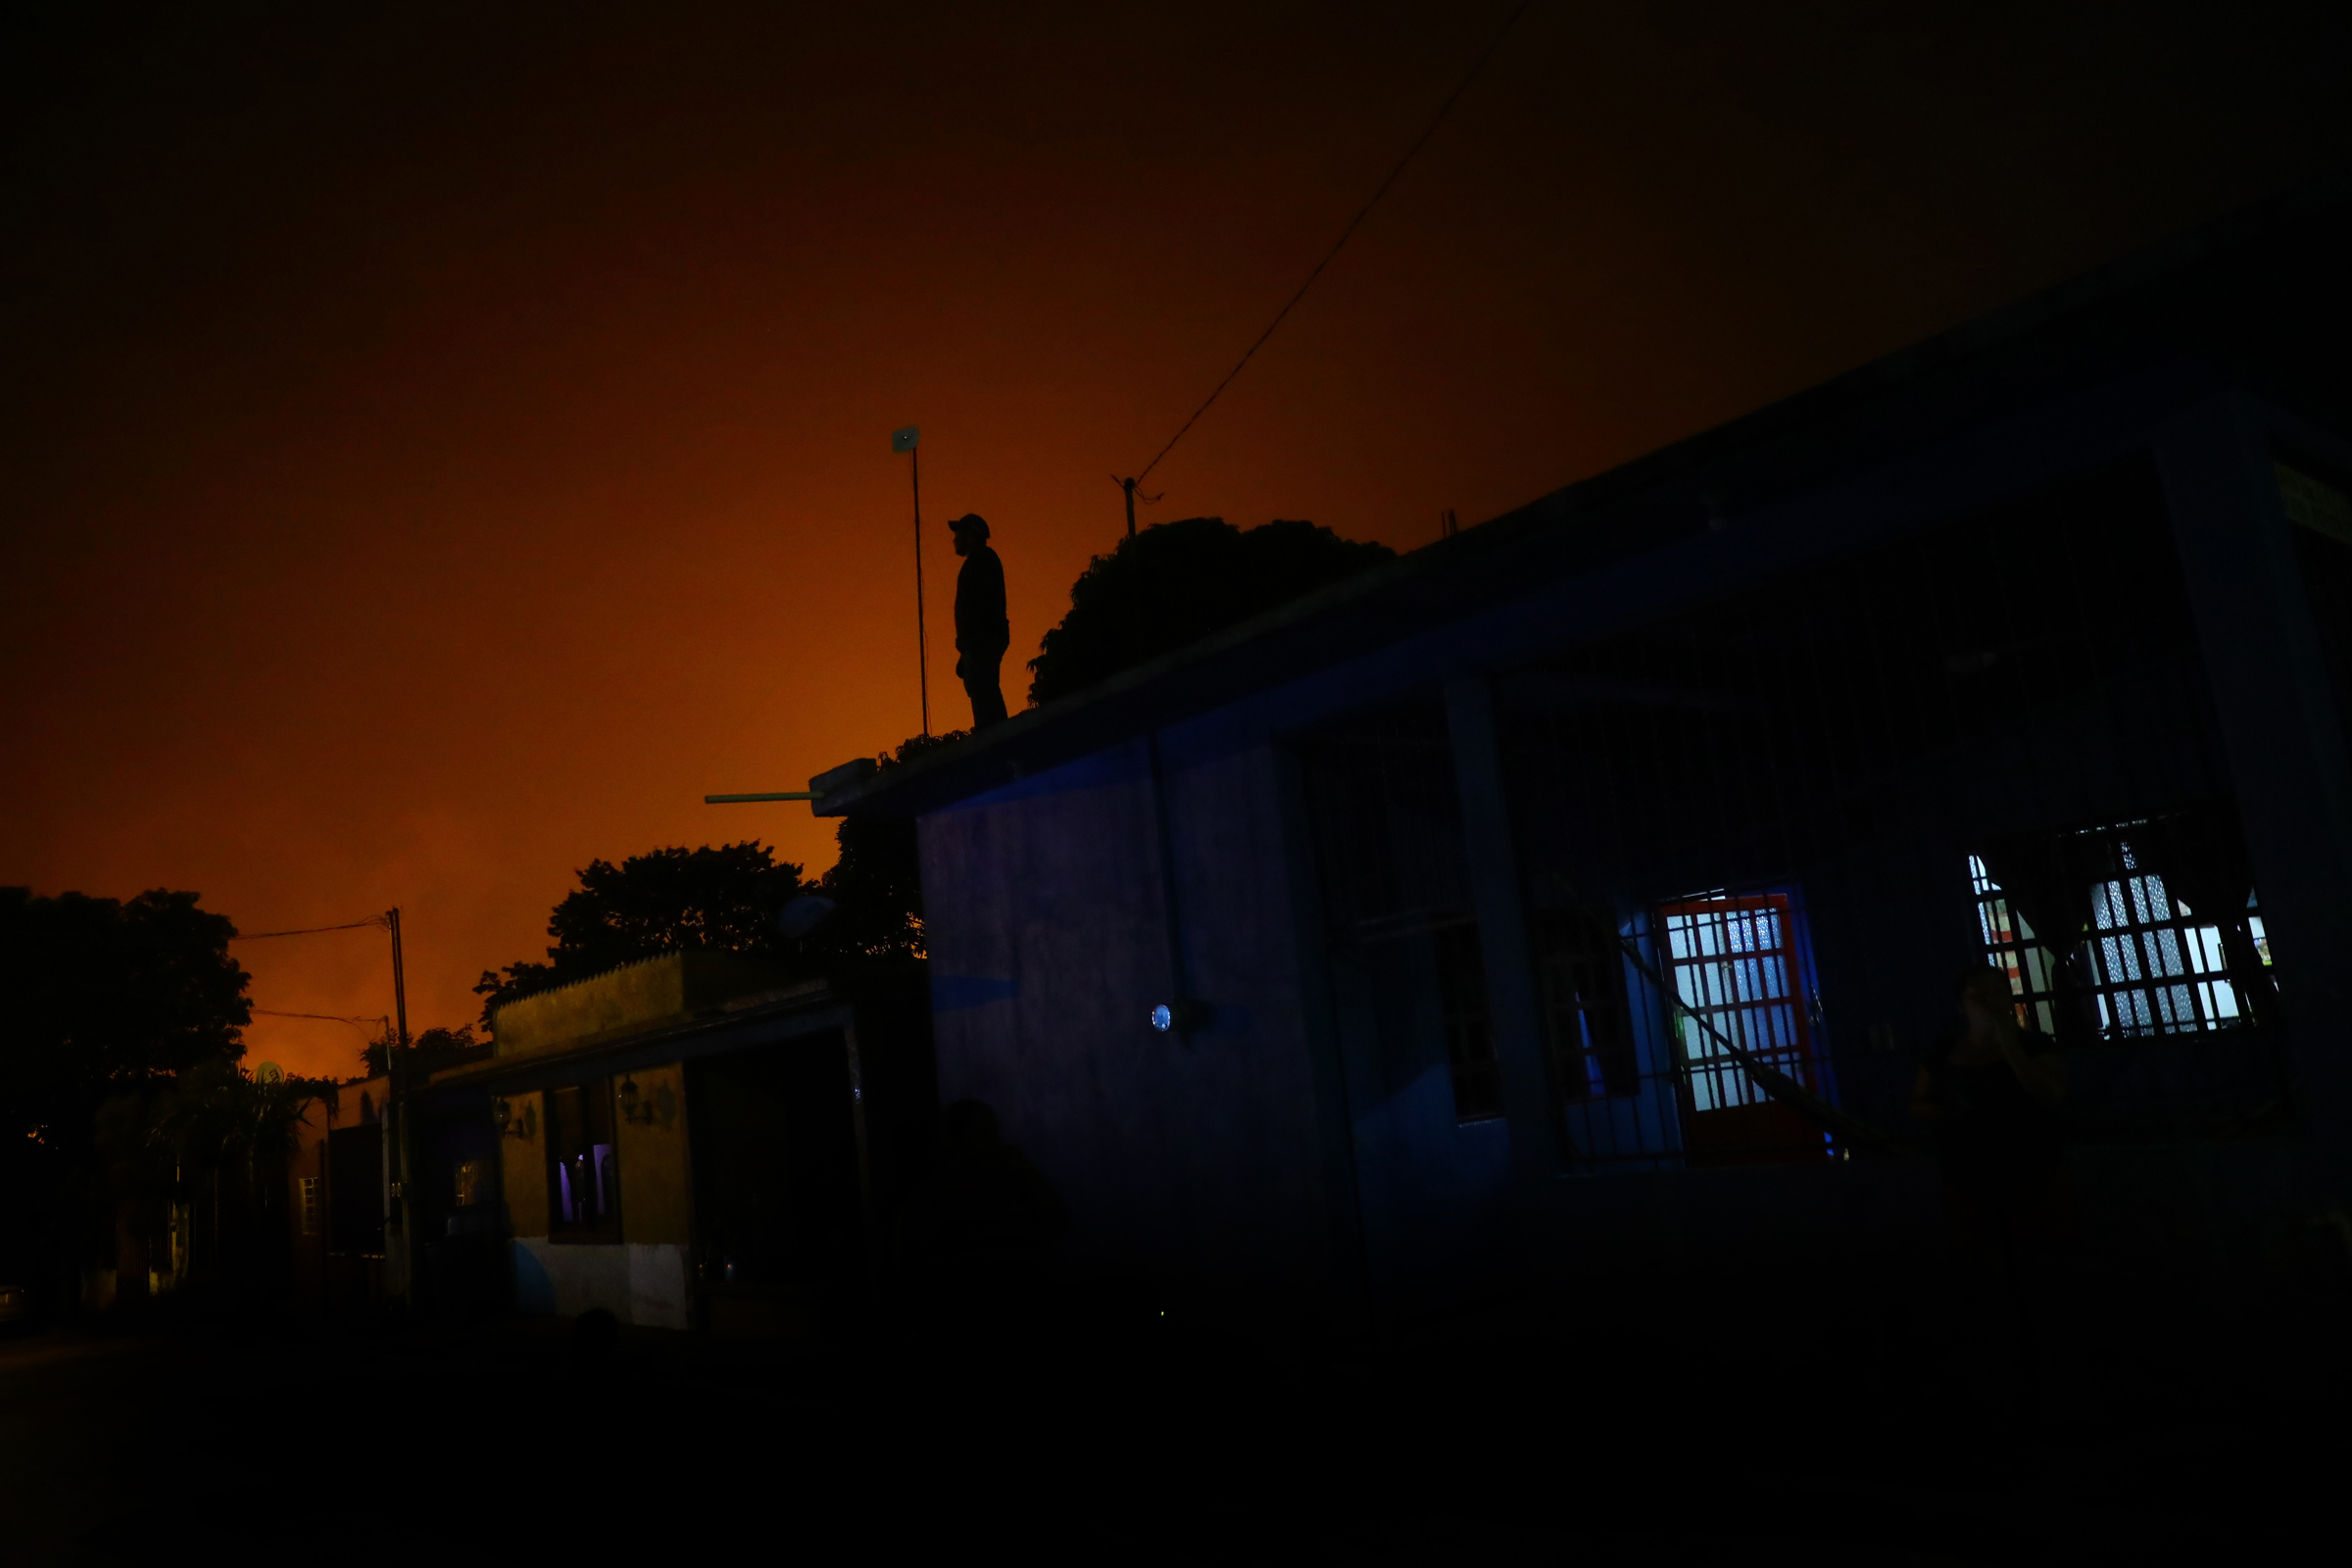
A man stands on the roof of a house in Colonia El Carmen as a red glare emanates from flares dotted around the Cactus gas processing center, run by state oil company Pemex, in Reforma municipality in Chiapas, Mexico. Photo: Edgard Garrido / REUTERS

Gas flaring soars in Mexico, derailing its climate change pledges as it seeks to boost oil output – “It’s like hell”

By Stefanie Eschenbacher 23 February 2022 (Reuters) – It never gets completely dark in Colonia El Carmen, home to Mexico’s largest natural gas processing center, in the poor southern state of Chiapas. After sunset, a red glare emanates from flares dotted around the Cactus gas processing center, run by state oil company Petroleos Mexicanos (Pemex). […]

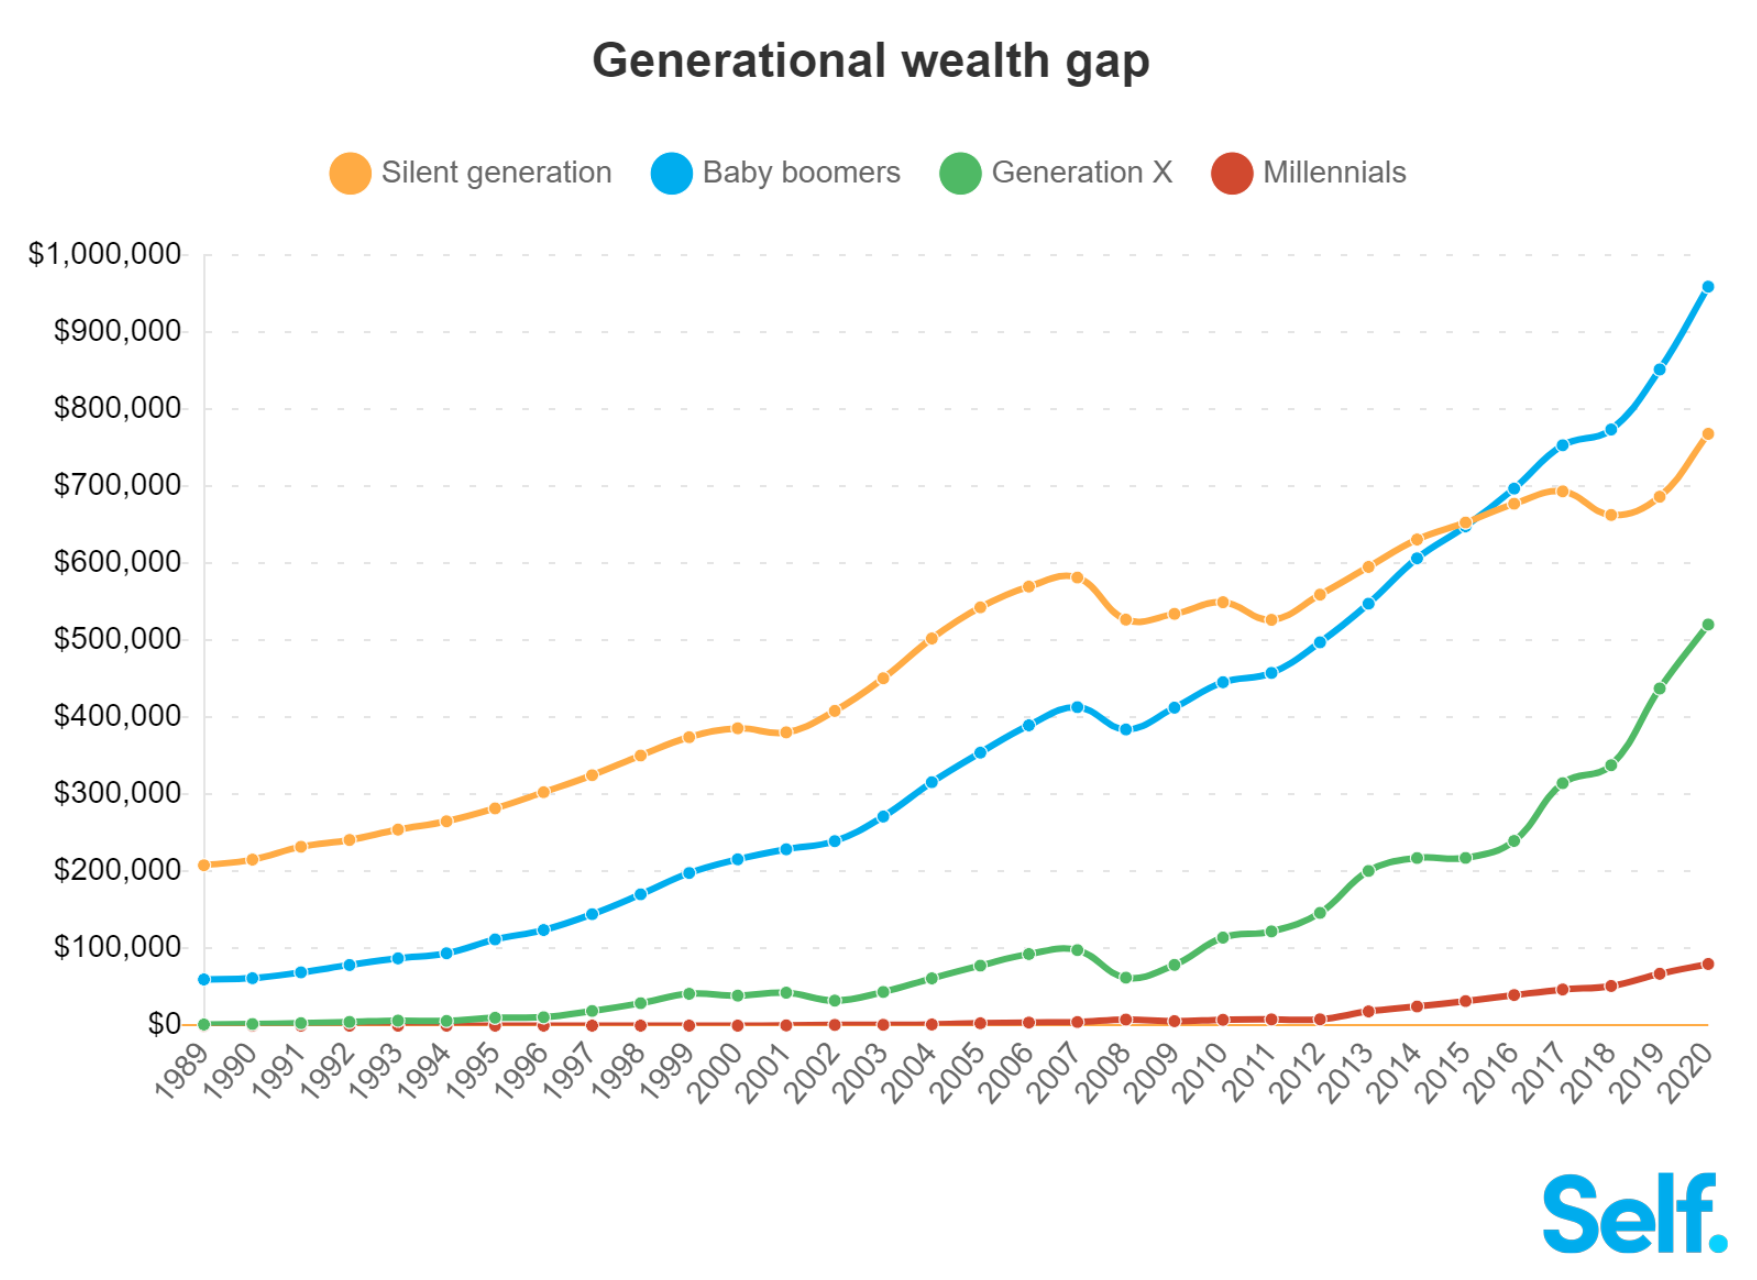
Generational wealth gap in the United States, 1989-2020. In 1998, the American population under 40 years old held 13.1 percent of America’s total wealth. In 2020, those under 40 hold only 6 percent of the total wealth. This means that millennials and Generation X own less than half of the wealth that older generations owned when they were the same age. Graphic: Self Financial, Inc.

Graph of the Day: Generational wealth gap in the United States, 1989-2020

20 December 2021 (Self Financial) – In 2021, the average net worth in an American household aged 64-75 reached over $1.2m [1], while the average household under 35 had a net worth of just $76k. With these massive generational wealth gaps, Self decided to dig deeper into the historical wealth distribution of different generations to understand […]

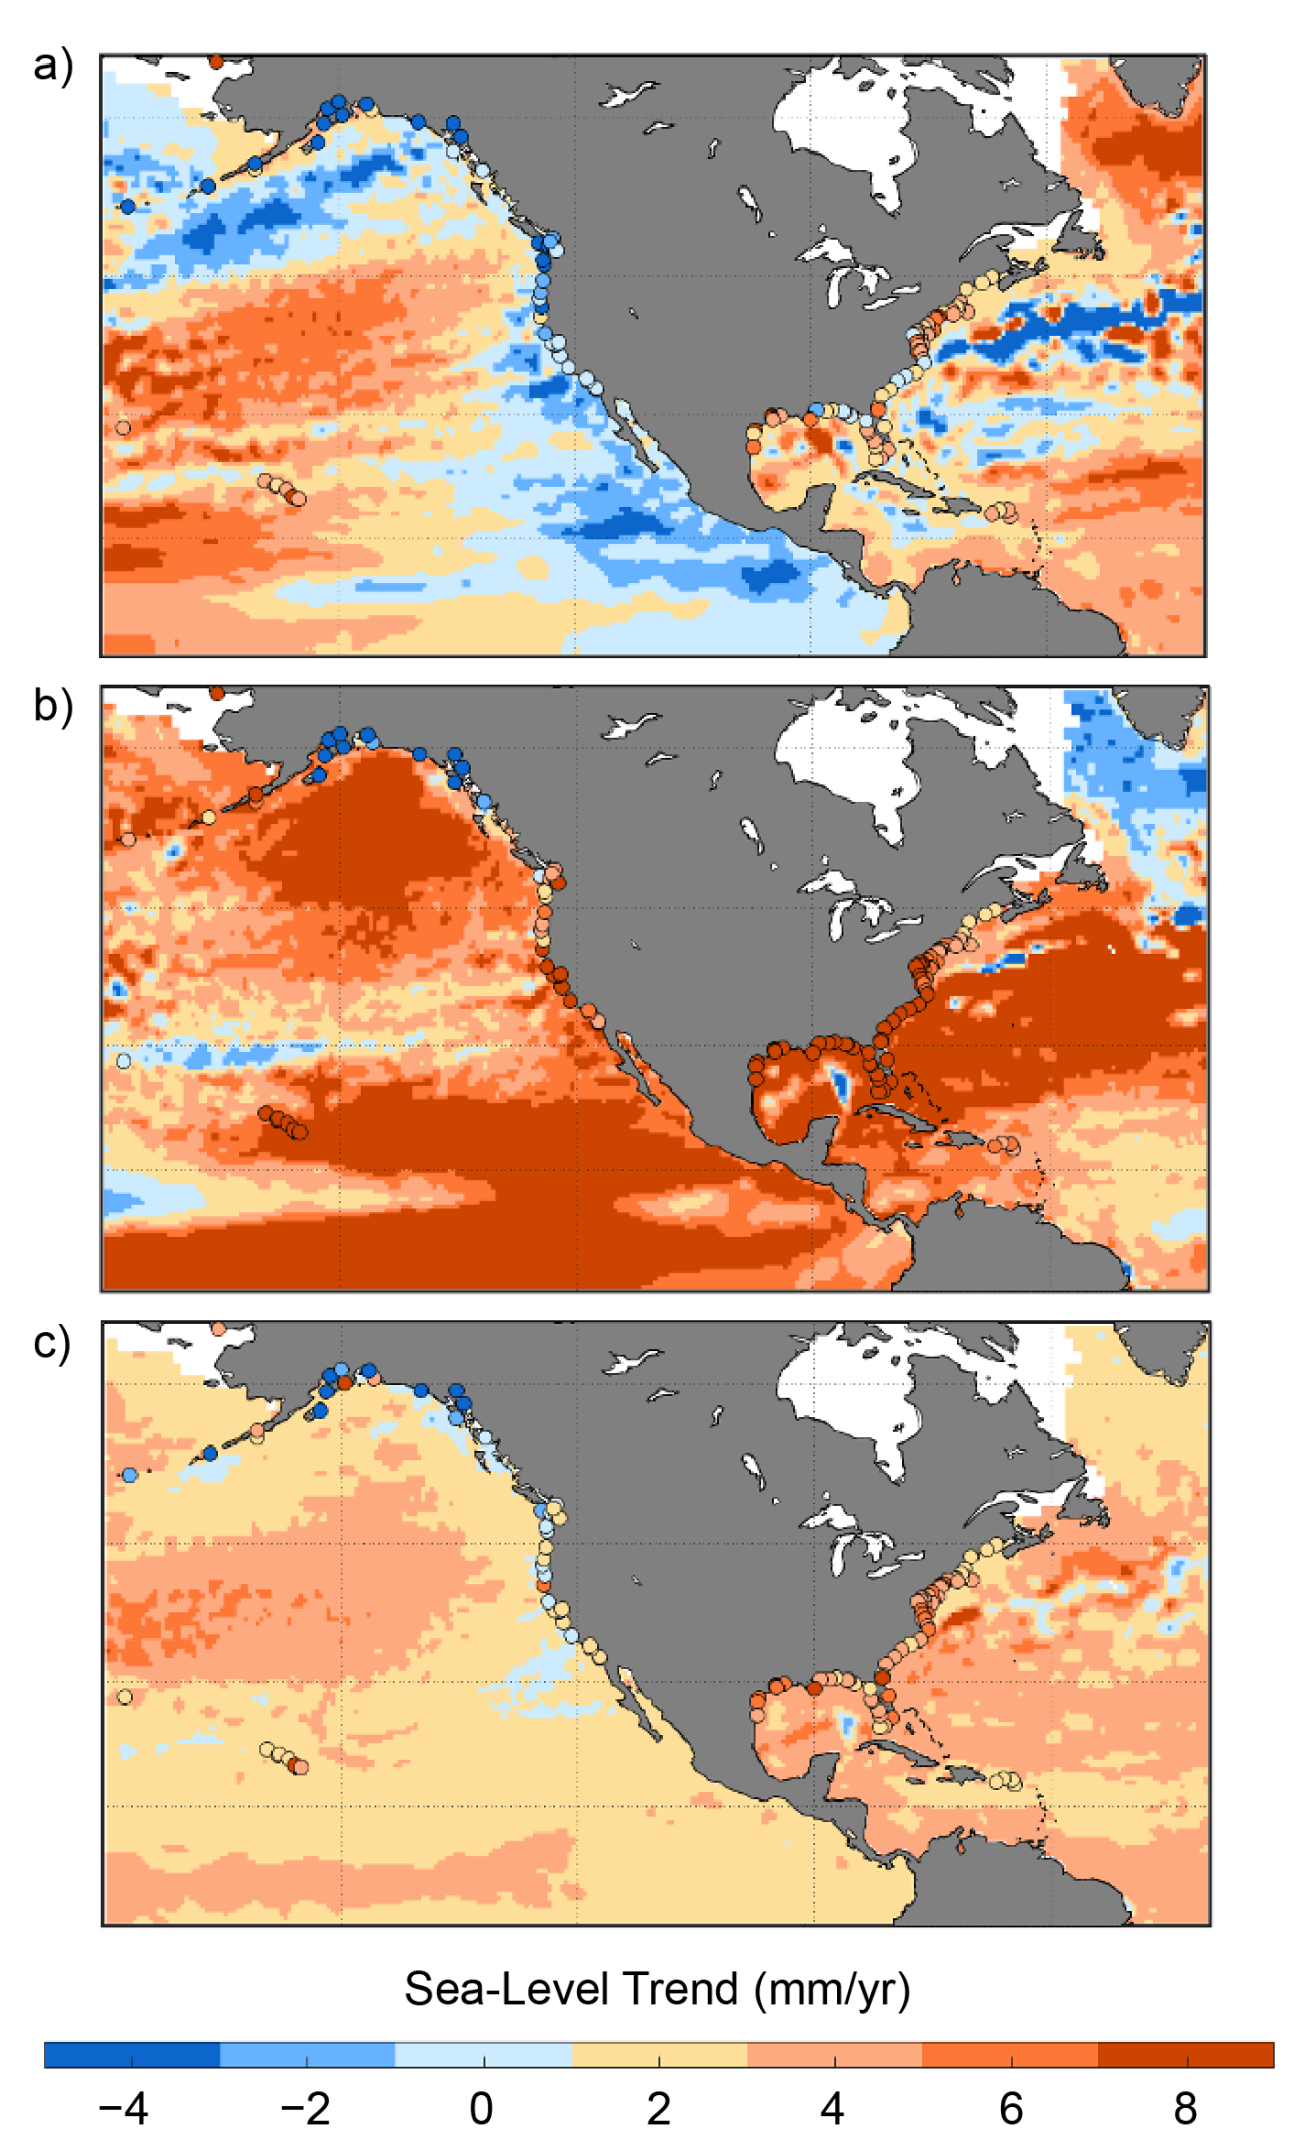
Maps showing regional sea level linear rates of rise (mm/year) from satellite altimetry over three different time periods: (a) 1993–2006, (b) 2007–2020, and (c) 1993–2020. Linear rates of change of relative sea level (ocean and land height changes) from tide gauges over the same time period are also shown (circles). Graphic: Sweet, et al., 2022 / NOAA

U.S. coastline to see up to a foot of sea level rise by 2050 – Report projects a century of sea level rise in 30 years – “These numbers mean a change from a single flooding event every 2-5 years to multiple events each year”

15 February 2022 (NOAA) – The United States is expected to experience as much sea level rise by the year 2050 as it witnessed in the previous hundred years. That’s according to a NOAA-led report updating sea level rise decision-support information for the U.S. released today in partnership with half a dozen other federal agencies. […]

A trailer indicating support for anti-vax Freedom Convoy blocks the highway close to the Customs Inspection cubicles throughout a protest towards COVID-19 vaccine mandates on the Ambassador Bridge border crossing, in Windsor, Ontario, on 8 February 2022. The protestors, helping the Truckers Convoy in Ottawa, blocked visitors within the Canada certain lanes since the night of 8 February 2022. Roughly $323 million price of products cross the Windsor-Detroit border every day on the Ambassador Bridge, making it North America’s busiest worldwide border crossing. Photo: AFP

How a spy from the Ram Ranch Resistance infiltrated and seized anti-vax trucker chat rooms – “What they did in Windsor, blocking an international border, that to me is domestic terrorism”

By Claire Goforth 14 February 2022 (Daily Dot) – A member of a group that trolled trucker convoy protests by spamming them with a gay porn song infiltrated and took over a private chat protesters used to communicate and strategize. In recent weeks, truckers and people sympathetic to them have protested Canada’s requirements for truckers […]

Protesters carry swastikas and other flags at the truckers' anti-vaccine occupation in Ottawa, 29 January 2022. Photo: Centre for Israel and Jewish Affairs / Twitter

Fearful Ottawa residents flee downtown as anti-vaccine mandate occupation drags on – Residents fed up with noise, racist harassment, and threats of violence – Police hate crimes hotline receives more than 200 calls – PM denounces “people waving swastikas”

By Kimberley Molina 8 February 2022 (CBC News) – As the disruptive protest in Ottawa drags into its second week, some residents of the downtown core say they’ve been living a nightmare, under siege and terrified to leave their homes — except to seek refuge away from the epicentre. For 10 days, downtown residents have been subjected to relentless honking, random fireworks and choking diesel fumes […]

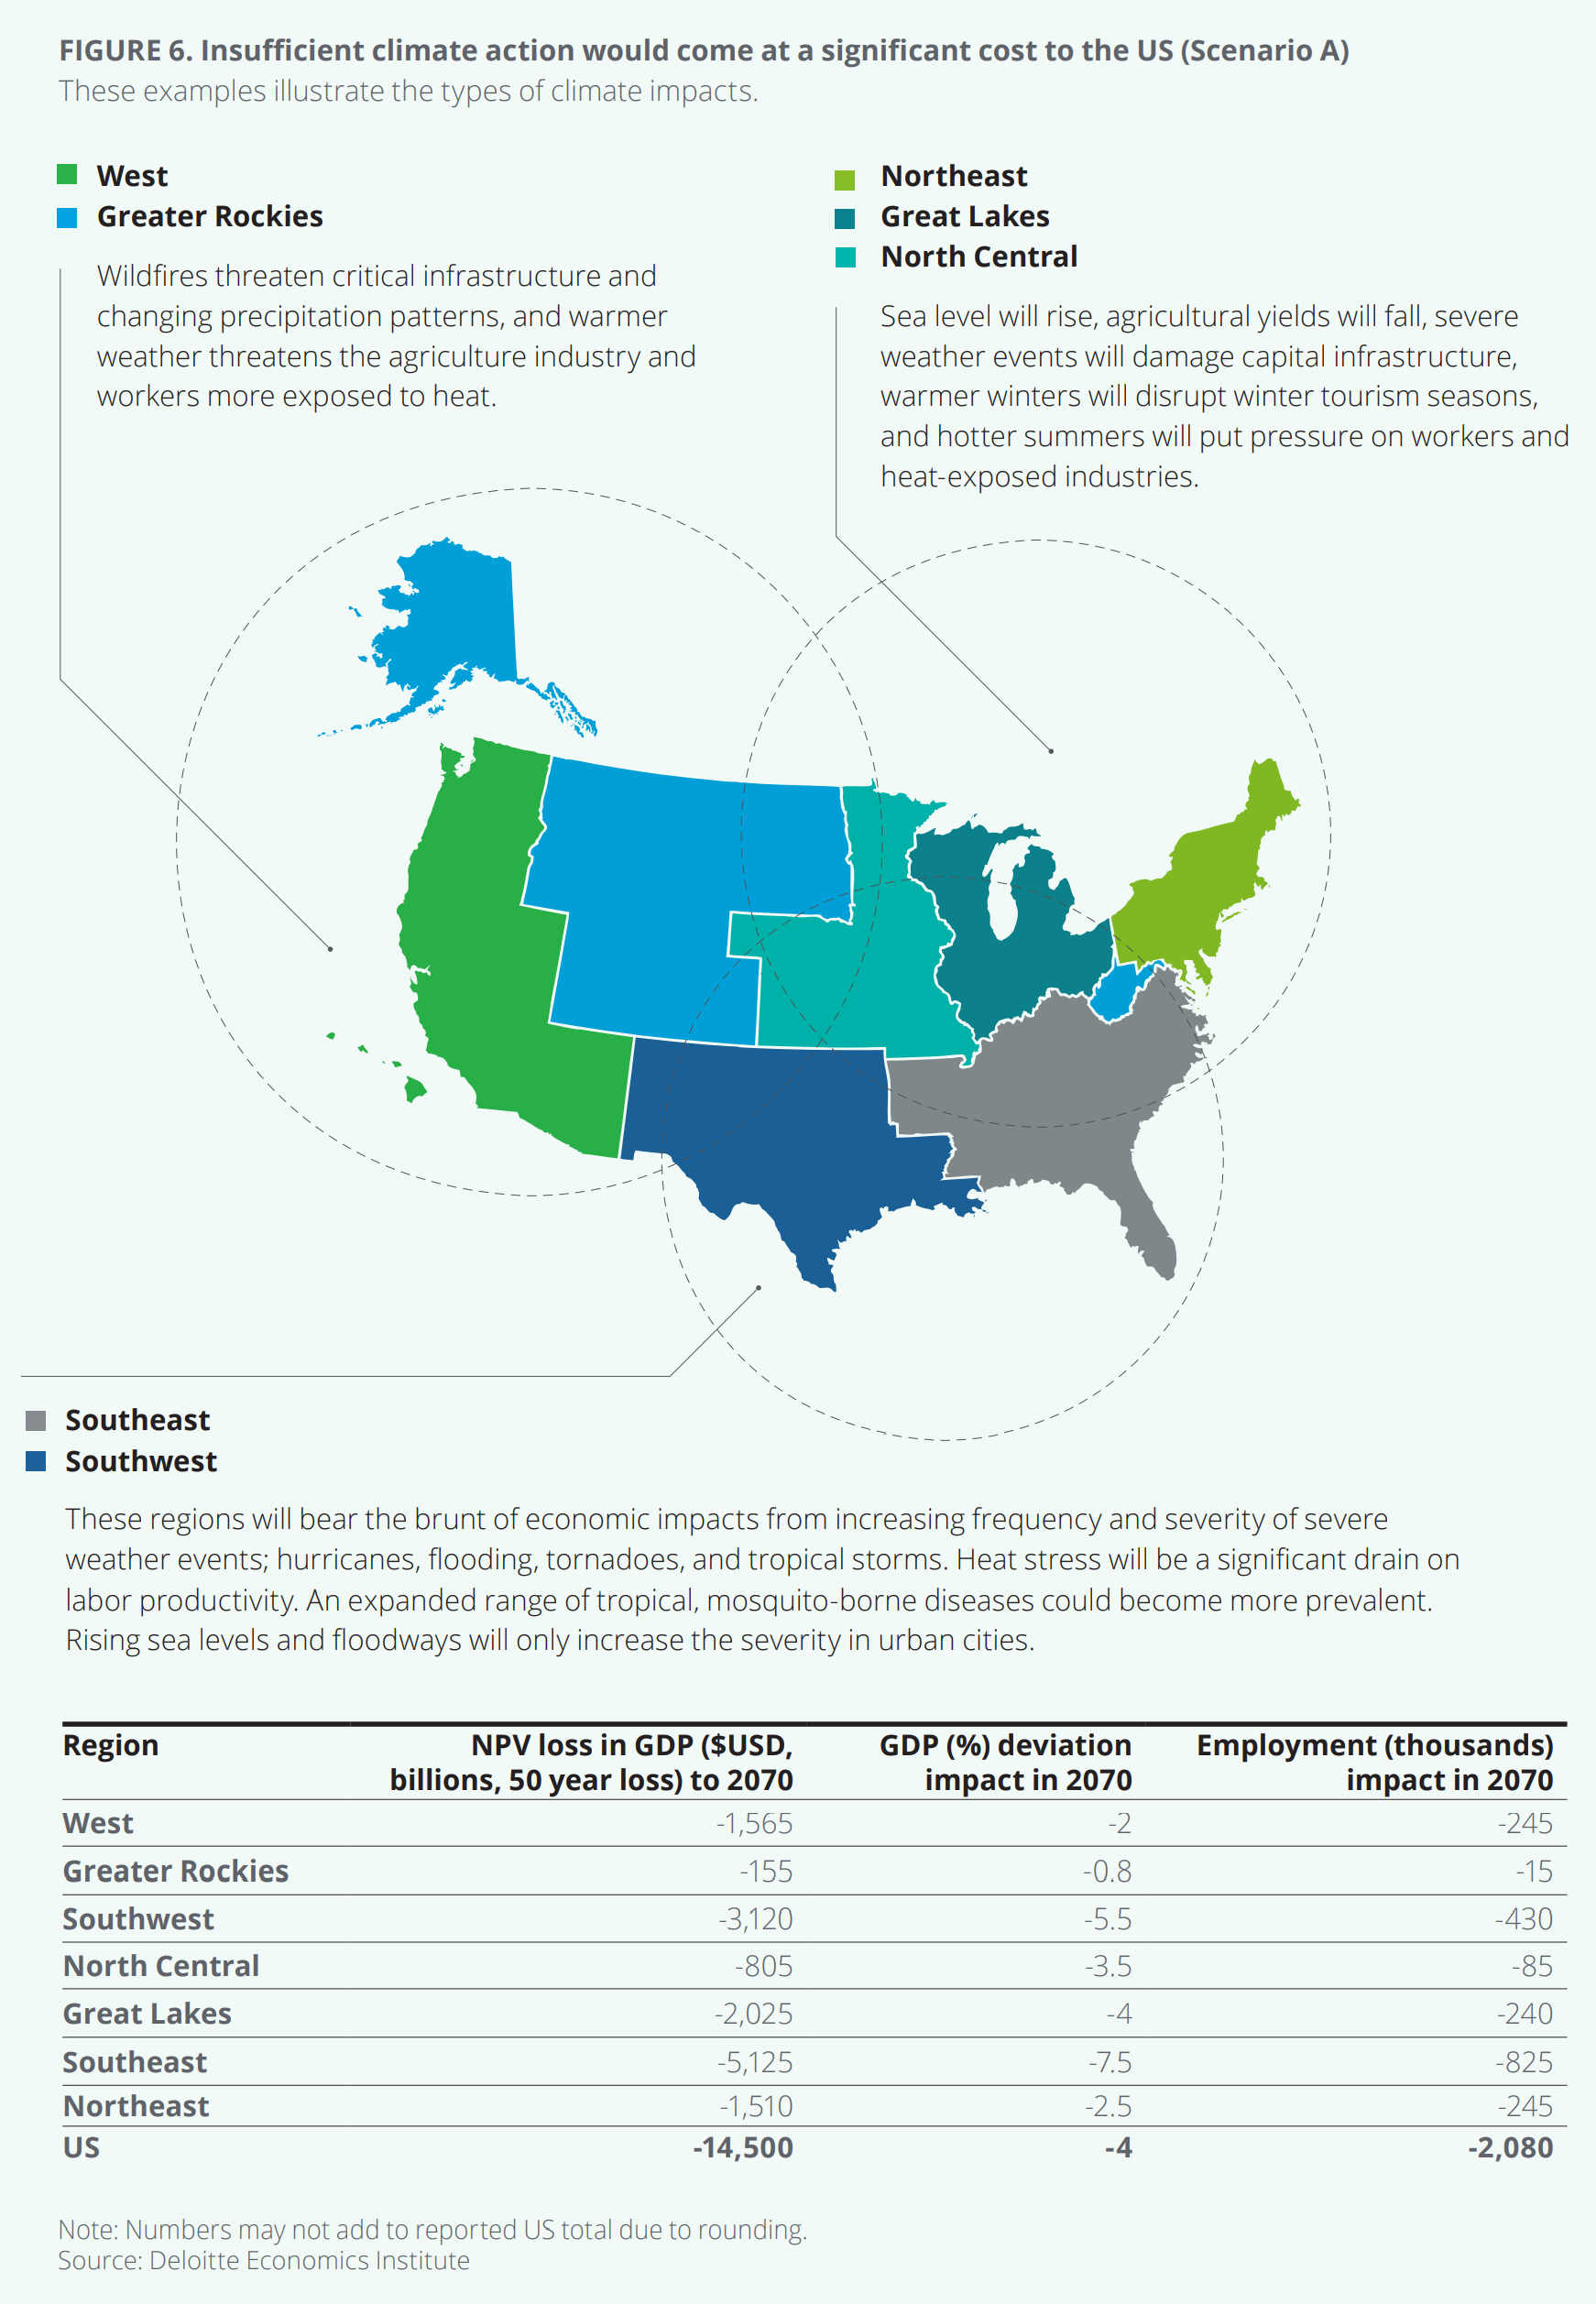
Estimated economic impacts of unmitigated climate change on seven geographical regions in the United States. Over the next 50 years, climate change-induced economic losses in the U.S. could total approximately $14.5 trillion in present-value terms. Graphic: Deloitte

Climate change-induced losses in the U.S. could total $14.5 trillion by 2070 – “In a climate-damaged world of 2070, the U.S. could lose nearly 4 percent of GDP in that year alone”

By Rachel Koning Beals 26 January 2022 (MarketWatch) – Definitive and deliberate climate action from Wall Street to Washington and beyond could deliver a $3 trillion gain to the U.S. economy over the next 50 years to 2070. But it’s the toll of inaction that would cost the nation nearly five times that amount, a […]
Social media & sharing icons powered by UltimatelySocial