By Josh Lederman 17 February 2021 WASHINGTON (NBC News) – A devastating winter storm that has plunged Texas into an electricity crisis offers warning signs for the U.S. as the Biden administration seeks to prepare for a future in which extreme weather is a greater risk and America is almost entirely powered by renewable energy. Generating energy is one challenge. But […]
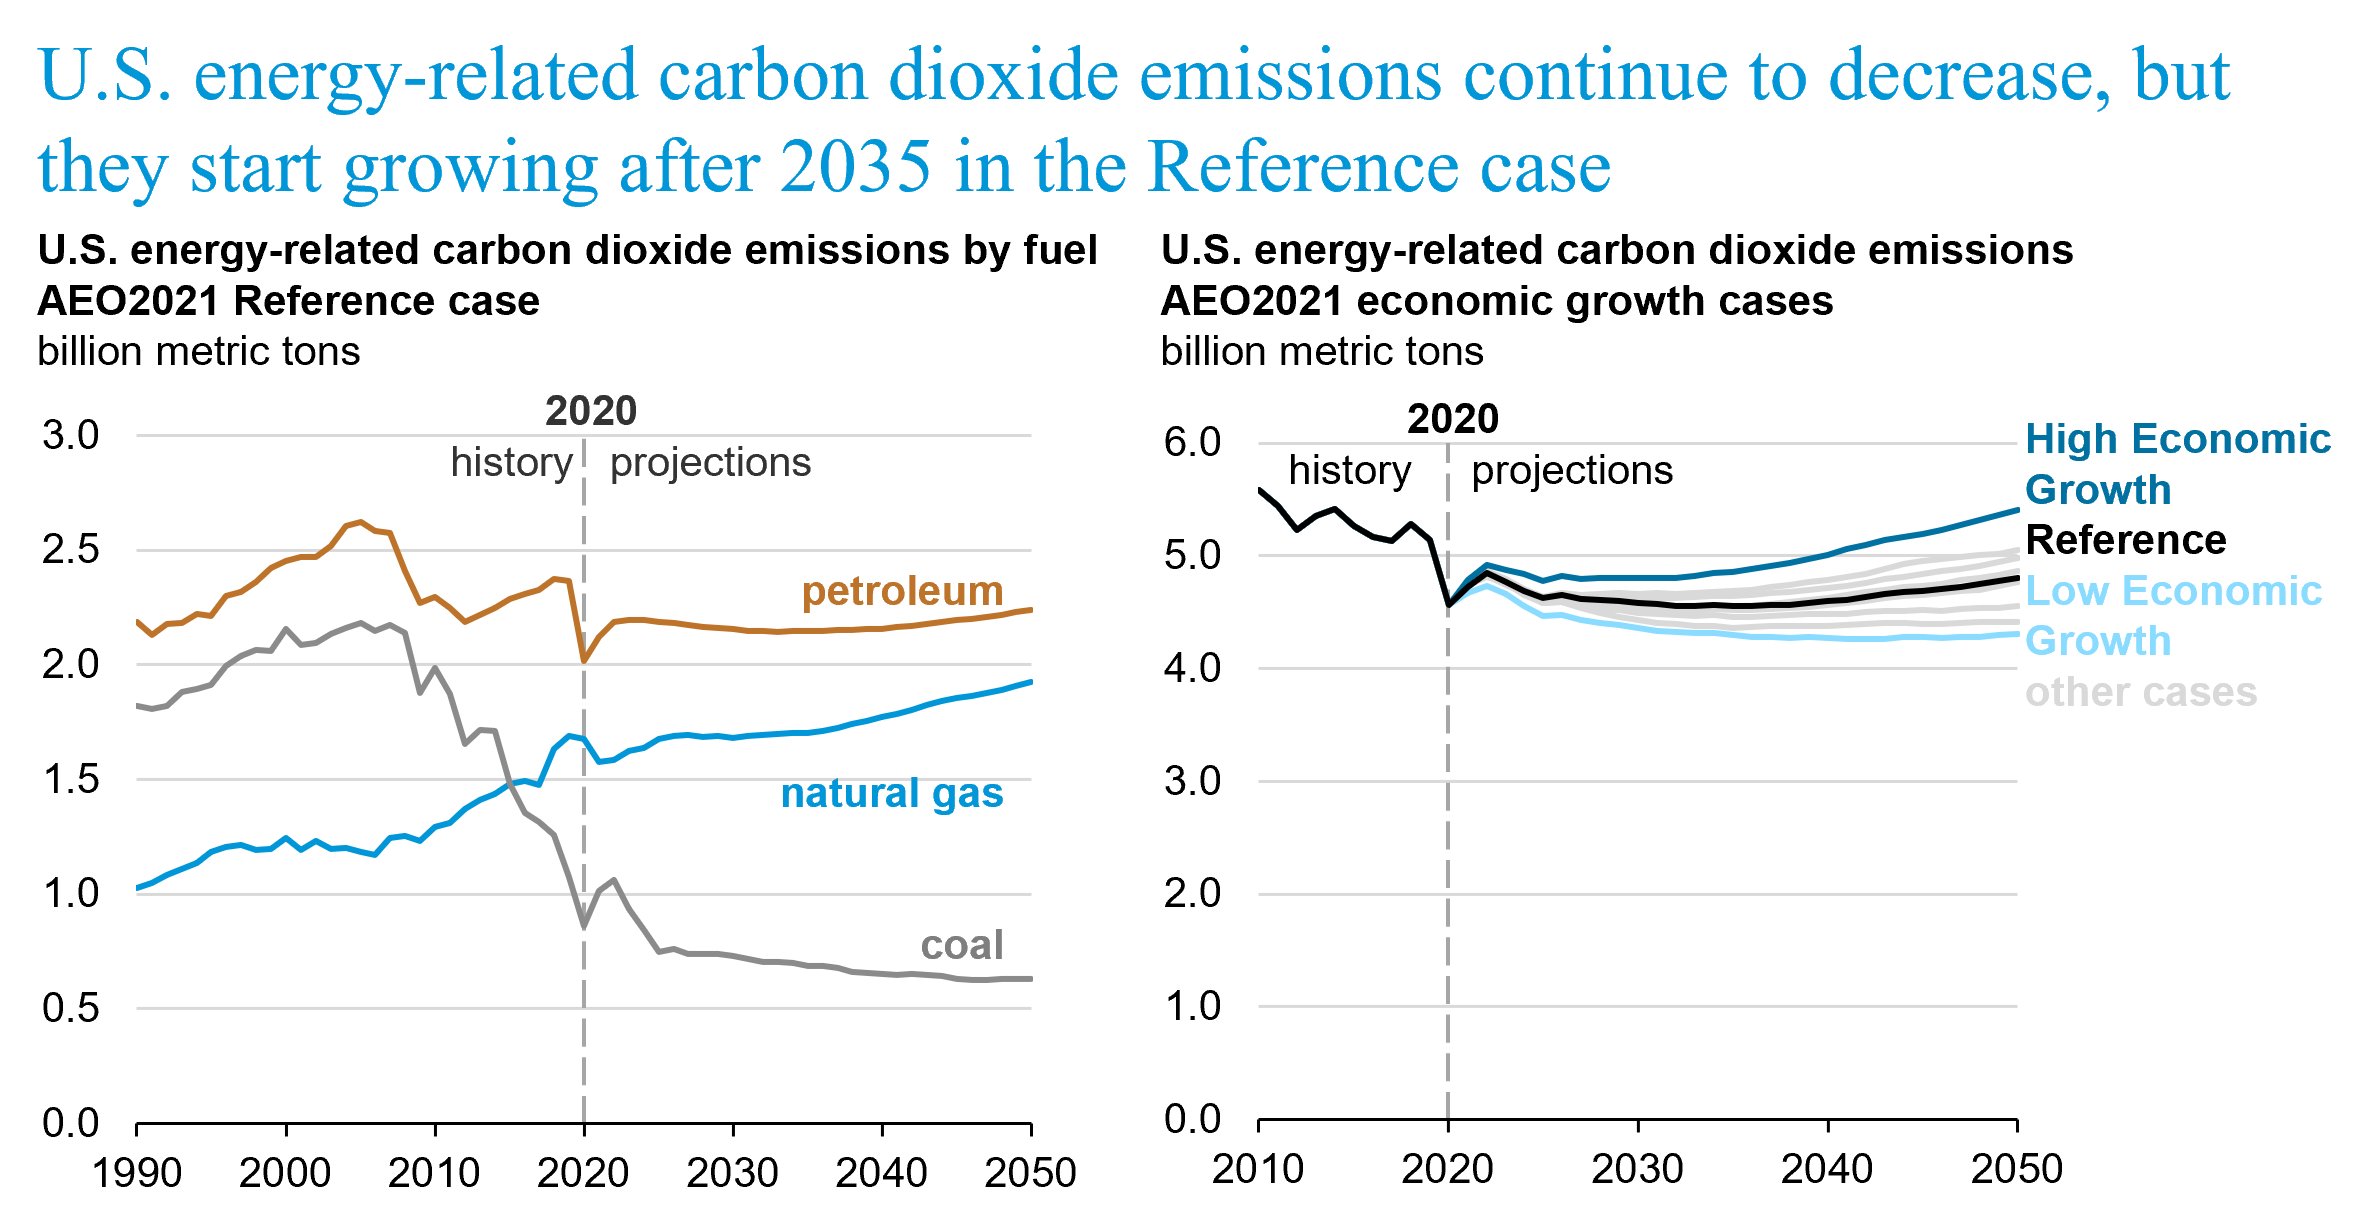
By Ari Kahan 3 February 2021 (EIA) – The United States will likely take years to return to 2019 levels of energy consumption and carbon dioxide emissions following the impact of COVID-19 on the U.S. economy and global energy sector, according to projections in the U.S. Energy Information Administration’s (EIA) Annual Energy Outlook 2021 (AEO2021). […]
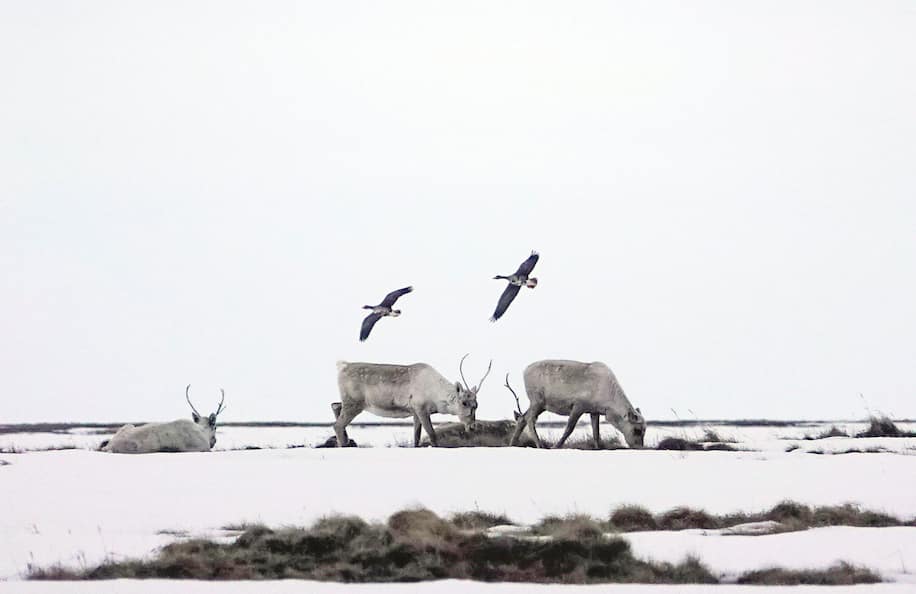
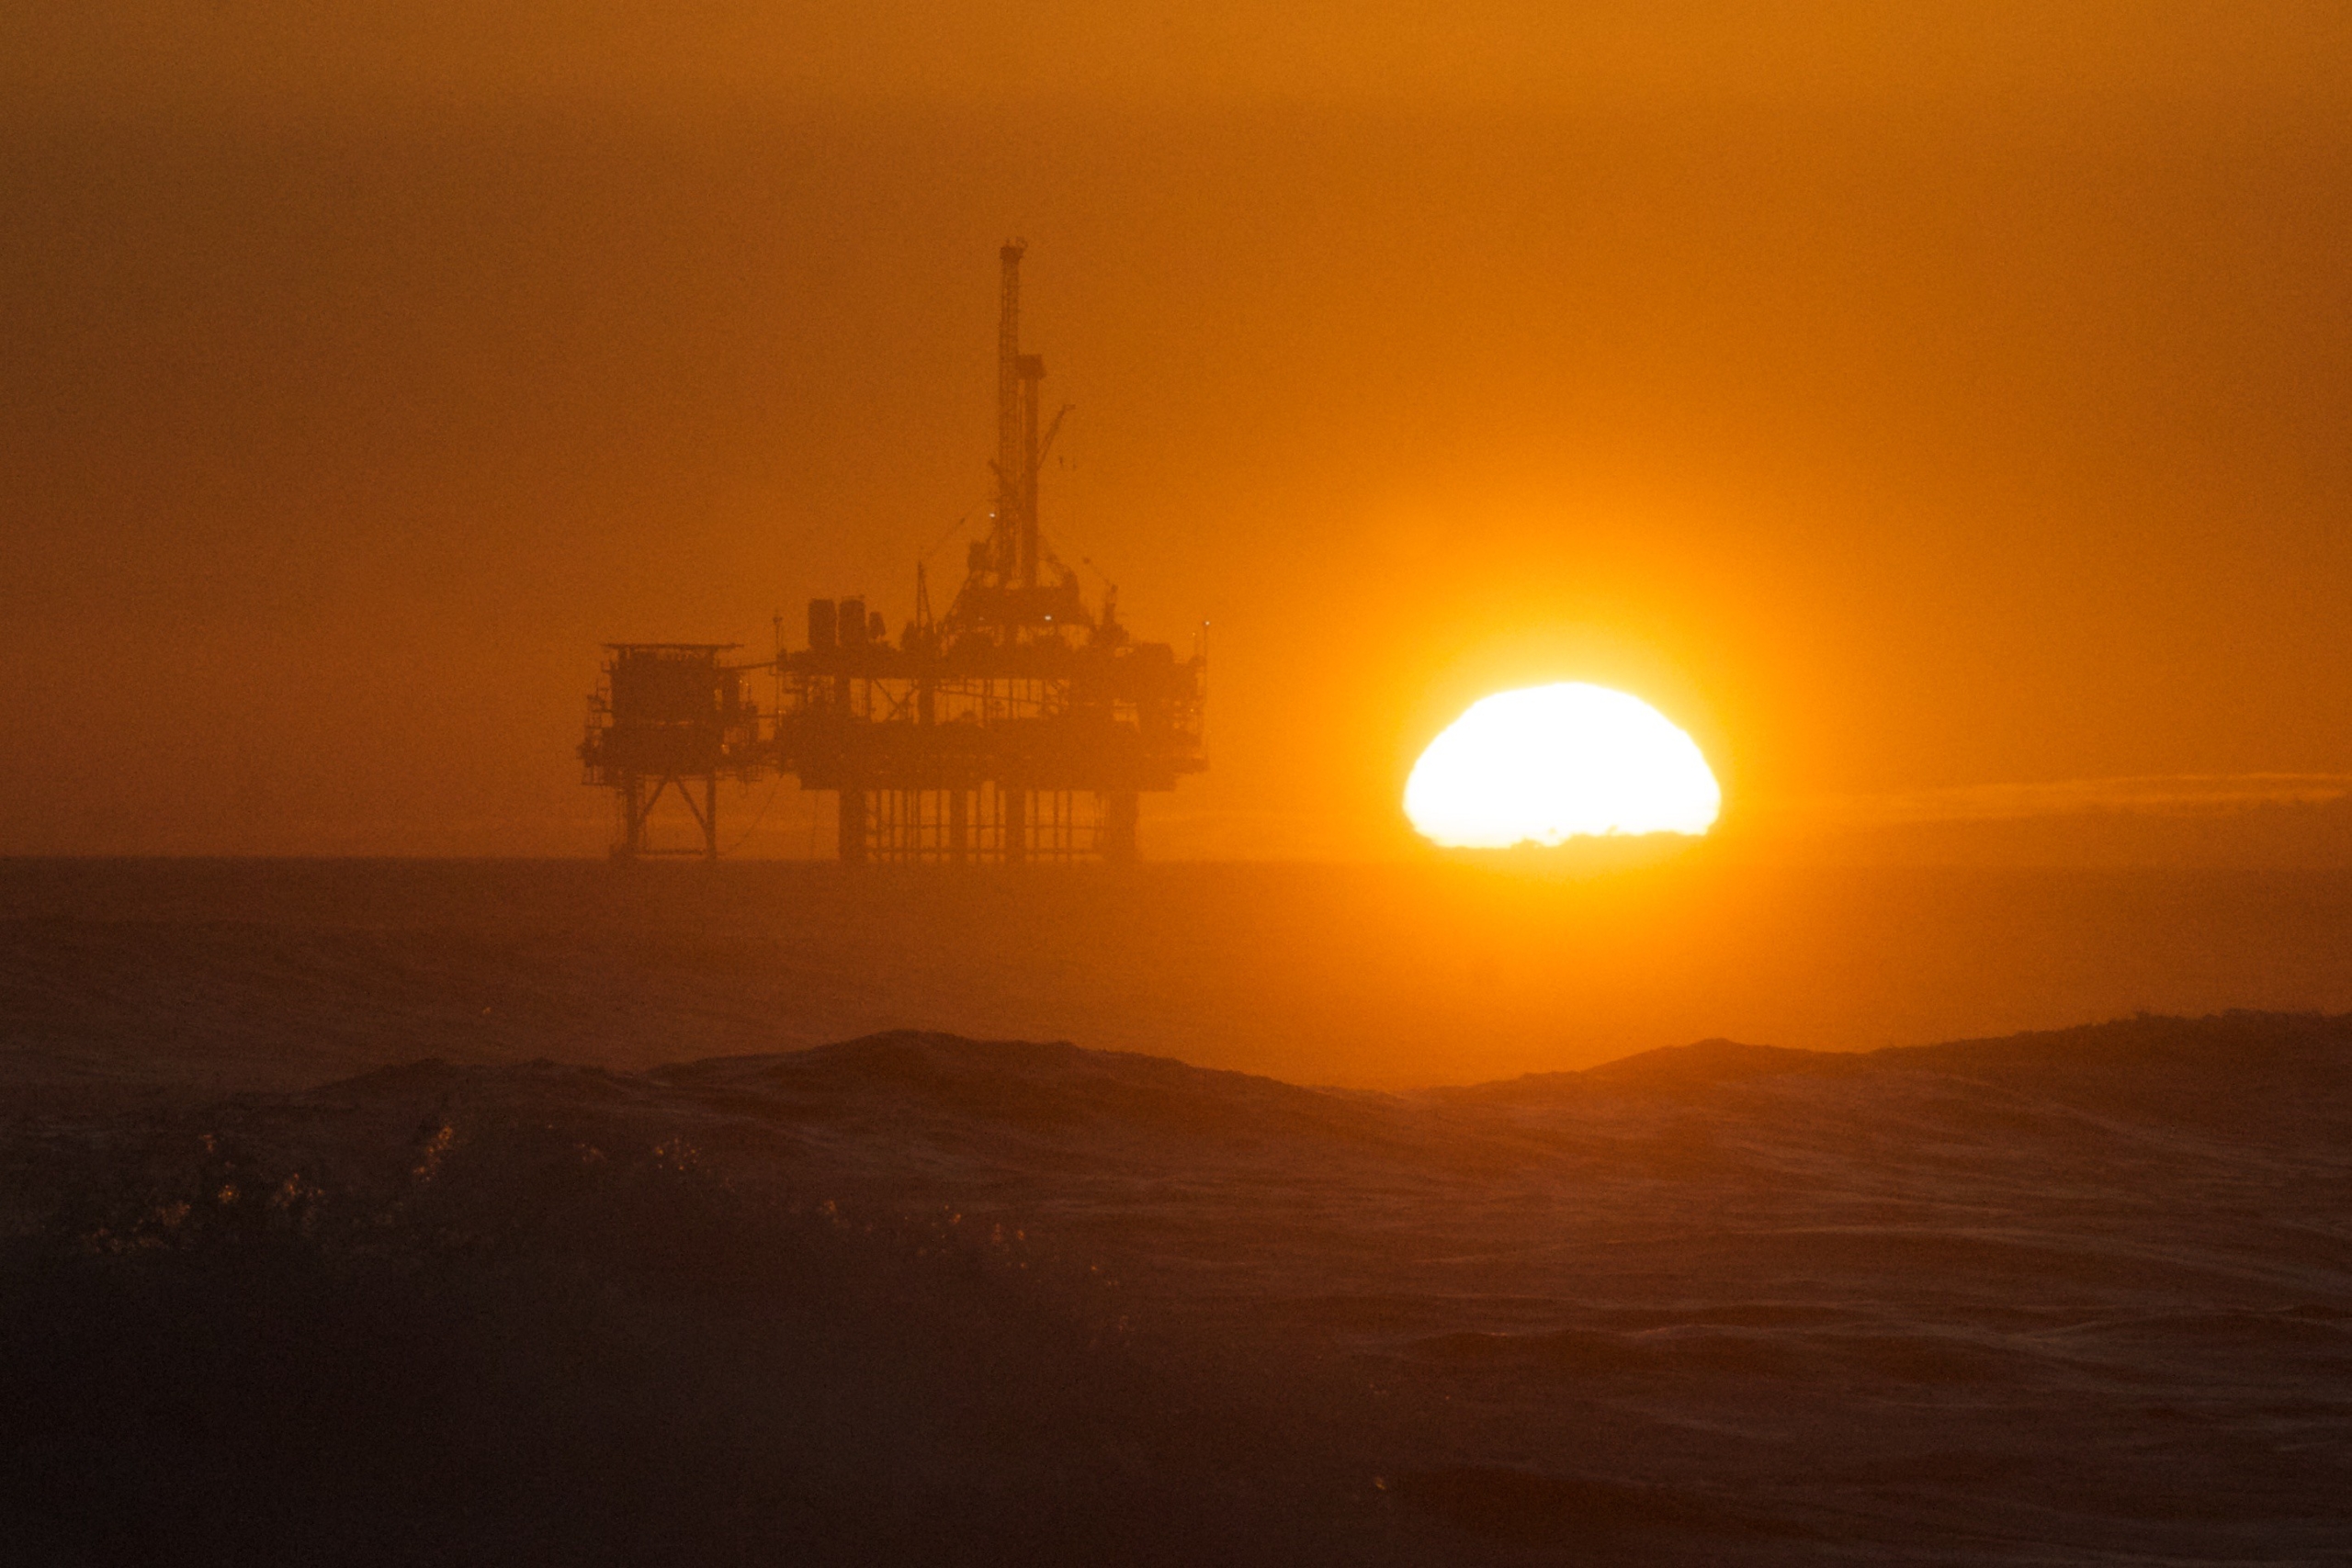
By Dino Grandoni 5 January 2021 (The Washington Post) – The Trump administration, in its final days, decided to open millions more acres of land in the Alaskan Arctic to oil and gas drilling. The decision from the Bureau of Land Management on Monday, finalized just two weeks before President Trump is set to leave office, will […]
29 July 2020 (Global Witness) – Global Witness today revealed the highest number of land and environmental defenders murdered on record in a single year, with 212 people killed in 2019 for peacefully defending their homes and standing up to the destruction of nature. The NGO’s annual report also shed a light on the urgent role […]
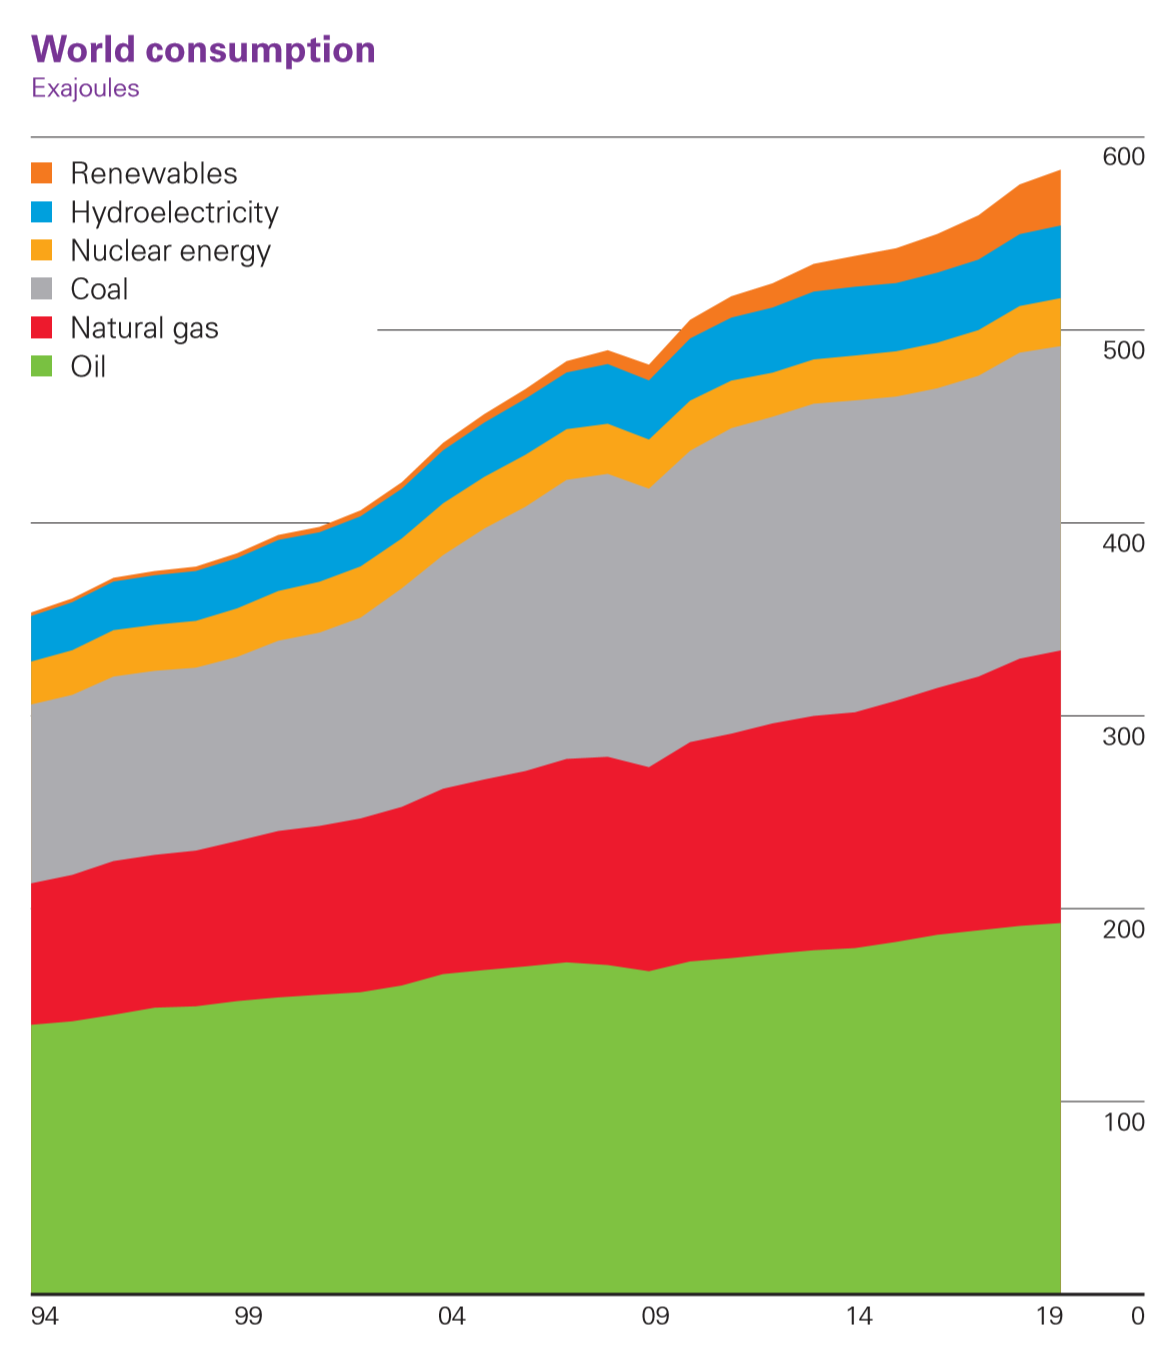
By Bernard Looney 17 June 2020 (BP) – The COVID-19 pandemic may well turn out to be the most tragic and disruptive event that many of us will ever live through. As I write this – in the middle of June – over 400 thousand people globally have lost their lives to the infection. Millions […]
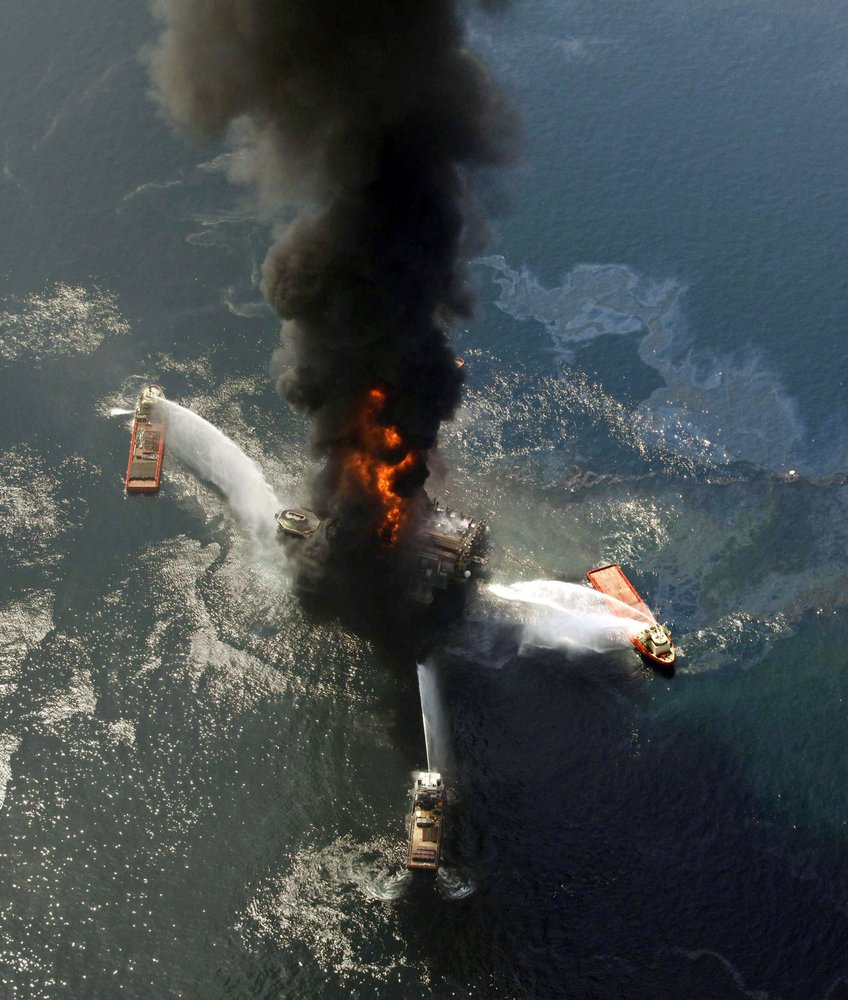
By Kevin Mcgill and Matthew Brown 18 April 2020 NEW ORLEANS (AP) – Ten years after an oil rig explosion killed 11 workers and unleashed an environmental nightmare in the Gulf of Mexico, companies are drilling into deeper and deeper waters, where the payoffs can be huge but the risks are greater than ever. Industry leaders and […]
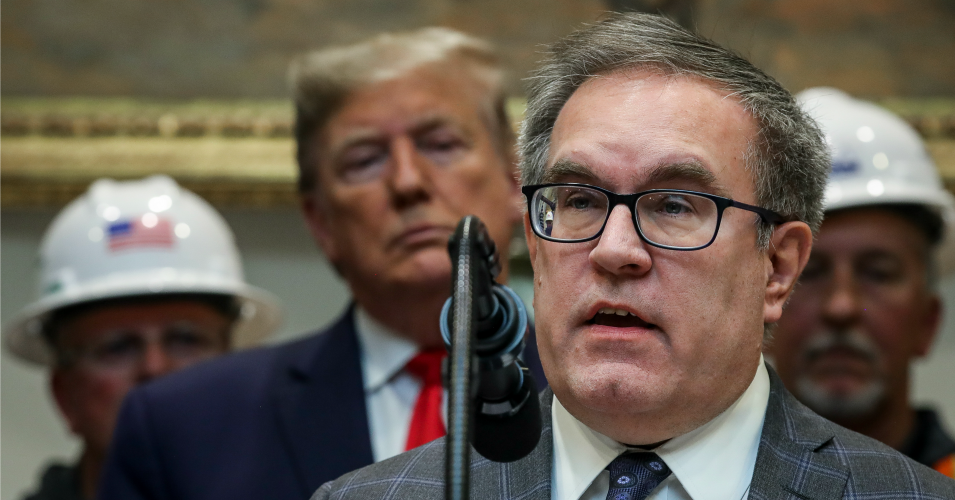
By Rebecca Beitsch 26 March 2020 (The Hill) – The Environmental Protection Agency (EPA) issued a sweeping suspension of its enforcement of environmental laws Thursday, telling companies they would not need to meet environmental standards during the coronavirus outbreak. The temporary policy, for which EPA has set no end date, would allow any number of […]
By Maria Caffrey 20 March 2020 (UCS) – We are currently in a state of national emergency thanks in no small part to the Trump administration’s muzzling of public health experts and slow response to the COVID-19 pandemic. As we all do our part to limit the extent of this outbreak, the Department of the Interior (DOI) instead appears to be […]
13 March 2020 (Carbon Tracker) – Company pay practice doesn’t yet live up to climate ambition, with the gap between stated ambition and demonstrable action widening. The energy transition is a challenge to the traditional business model of the oil and gas industry, and companies are increasingly exposed to transition-related financial risks. Over the past […]
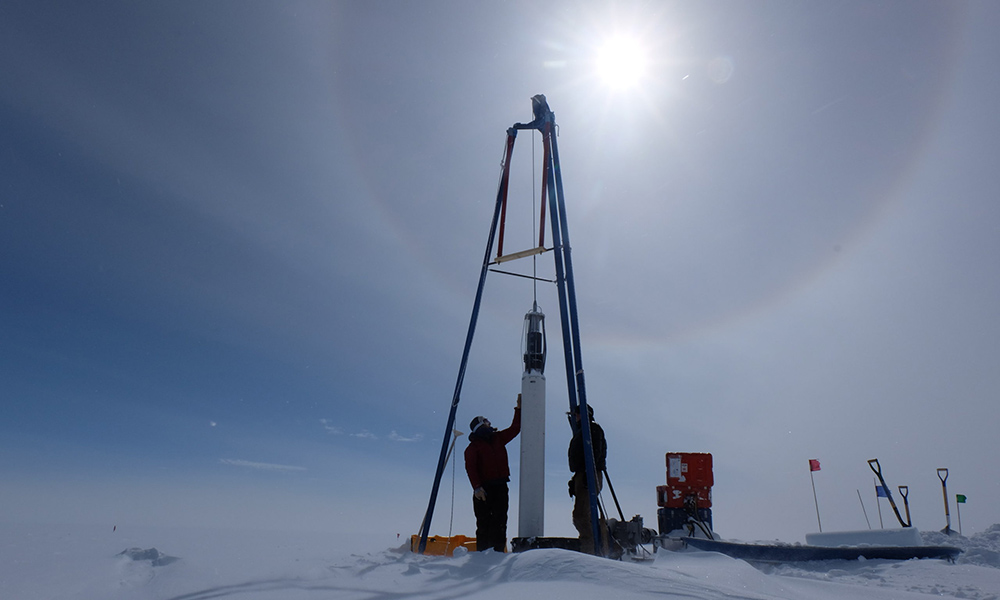
By Lindsey Valich 19 February 2020 (University of Rochester) – Methane is a powerful greenhouse gas and large contributor to global warming. Methane emissions to the atmosphere have increased by approximately 150 percent over the past three centuries, but it has been difficult for researchers to determine exactly where these emissions originate; heat-trapping gases like […]