Desdemona Despair

Blogging the End of the World™

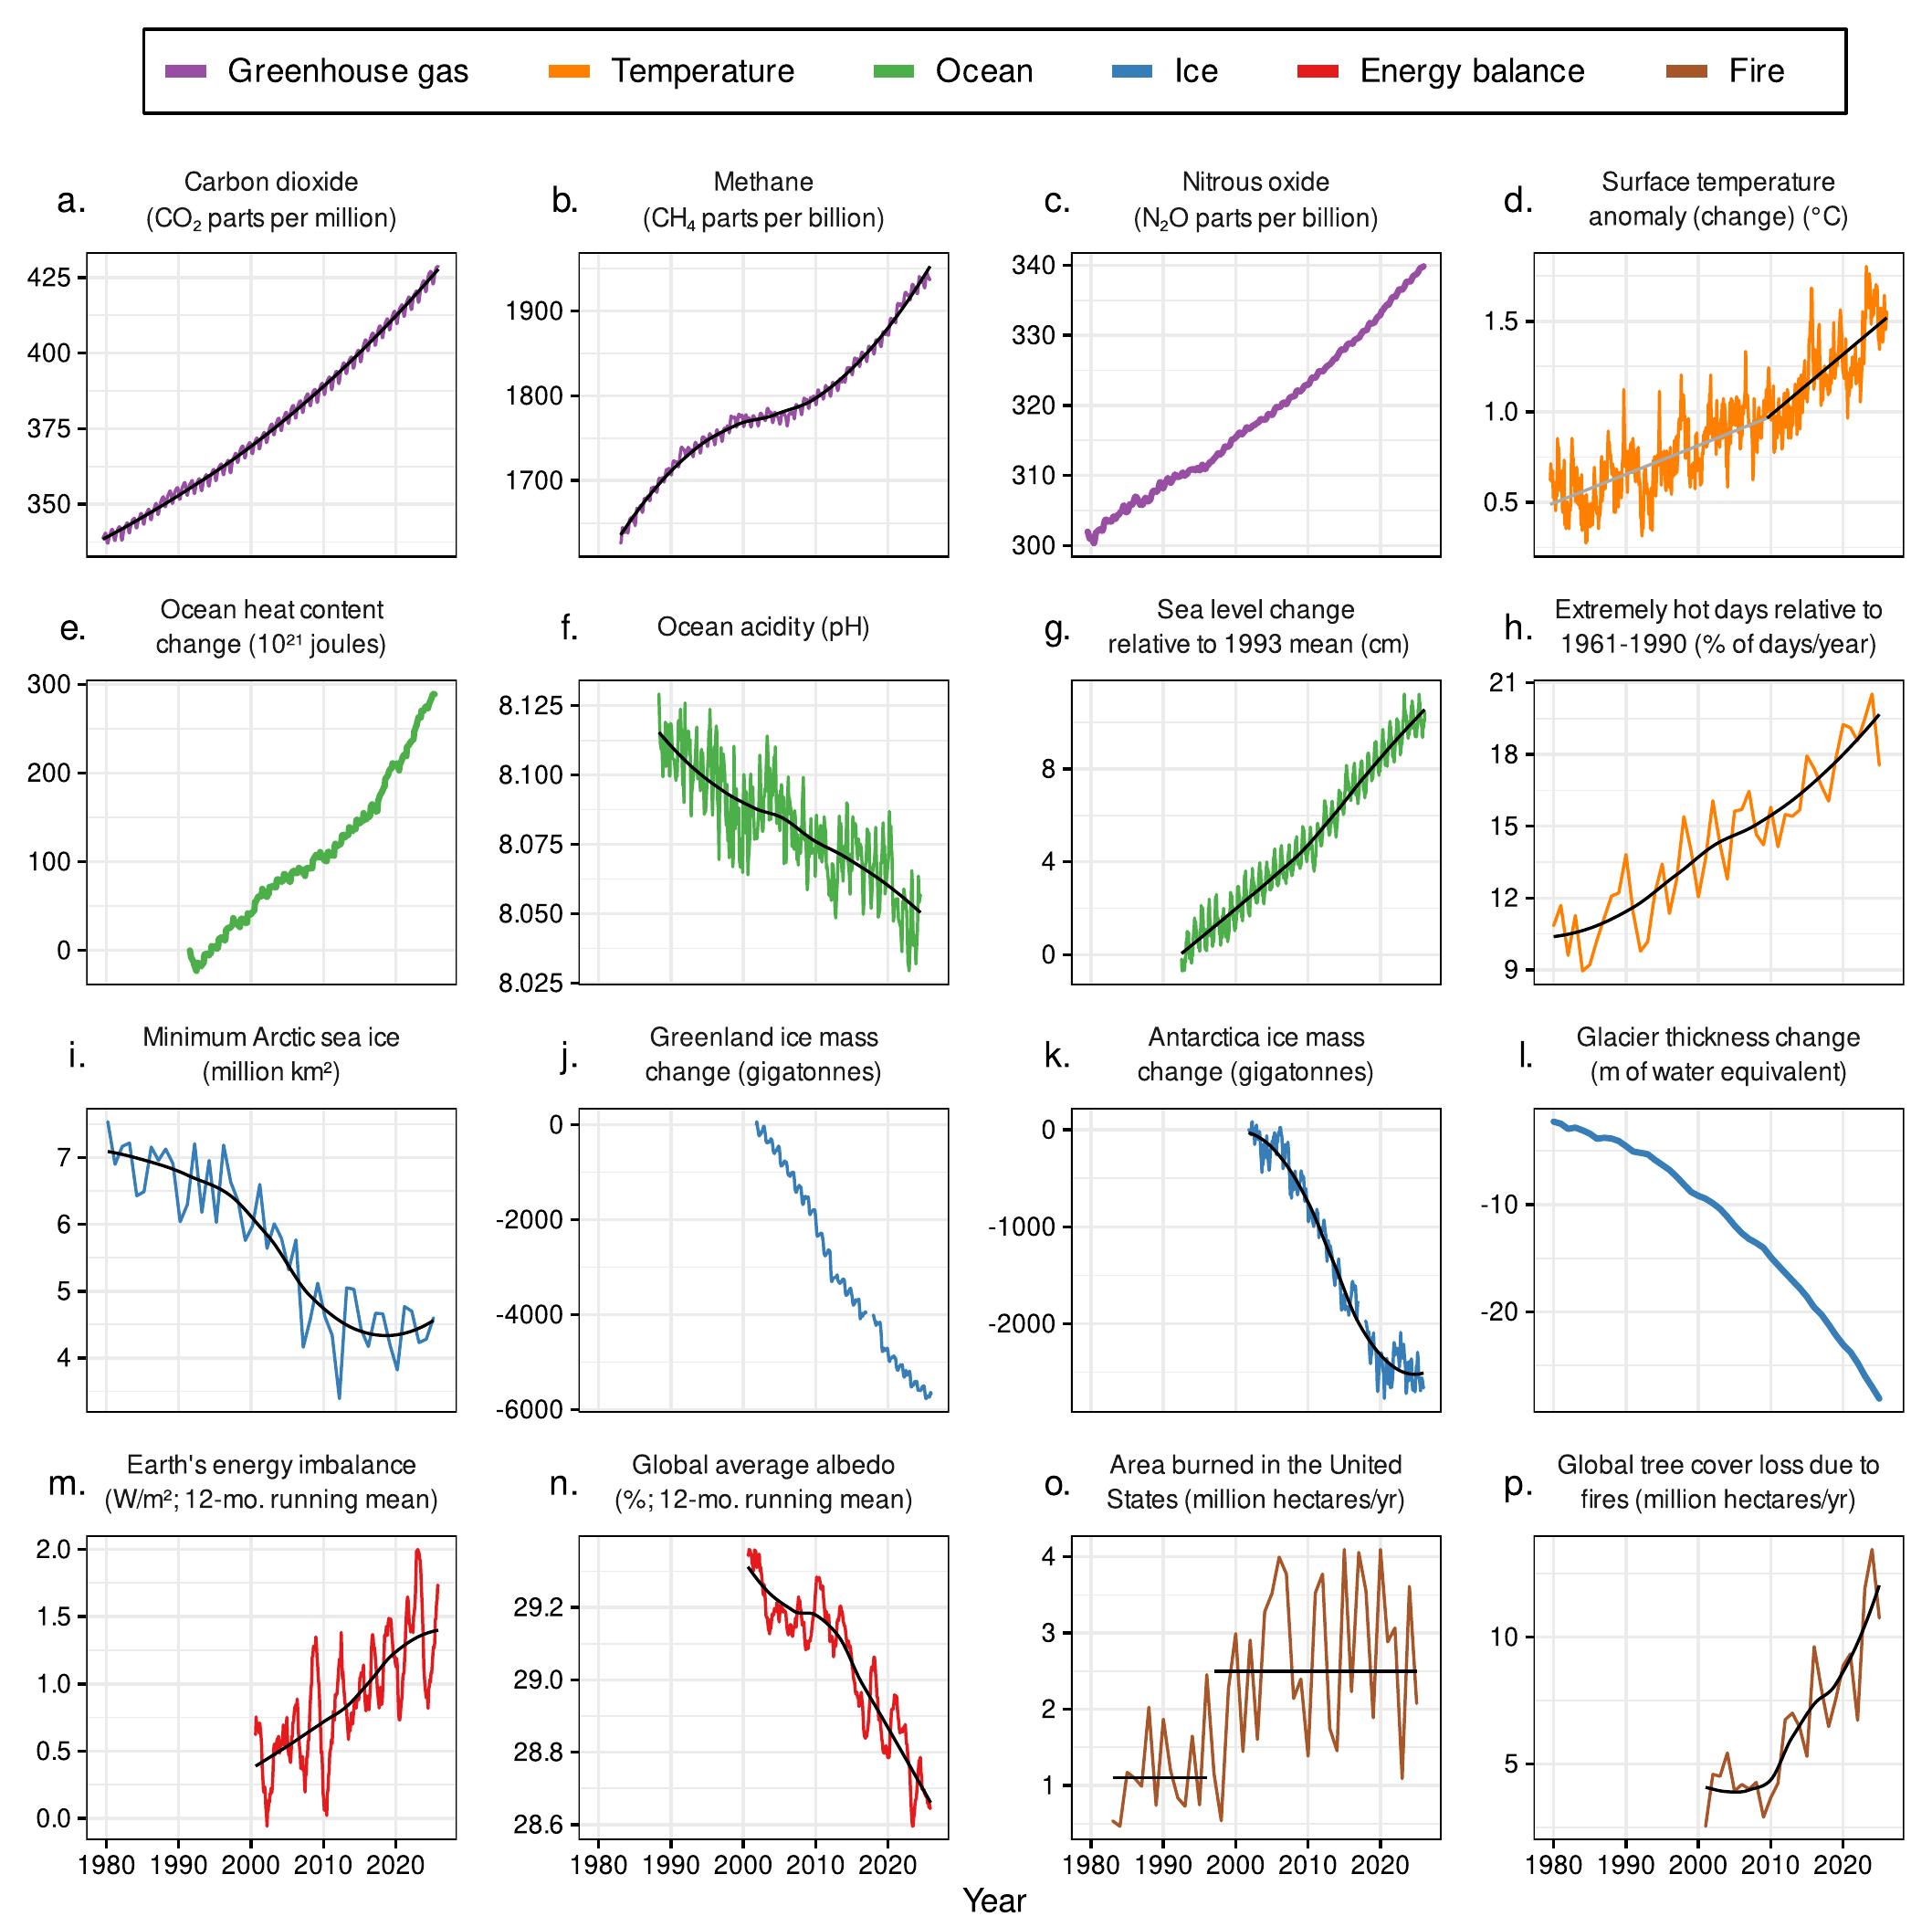
Time series of climate-related responses, the planetary vital signs, 1980-2026. Of 16 vital signs spanning greenhouse gas concentrations, temperatures, the oceans, ice, energy balance, and wildfire, 7 (44 percent) are currently at record extremes, and several show evidence of acceleration or abrupt shifts. For surface temperature anomaly (d), estimates based on a segmented linear regression model are shown in gray (prior to 2010) and black (beginning in 2010). For area burned (o), the black horizontal lines show changepoint model estimates, which indicate abrupt shifts. For other variables with relatively high variability, local regression trendlines are shown in black. The variables were measured at various frequencies (e.g., annual, monthly, weekly). The labels on the x-axis correspond to midpoints of years. Graphic: Ripple, et al., 2026 / BioScience

Seven of 16 planetary vital signs are at record extremes, scientists report – Global warming has accelerated to 0.36°C per decade since 2010, and 2°C could be reached before 2050 – “This is no longer a warning for the future; it is a diagnosis of the present”

14 October 2026 (BioScience) – We are witnessing the rapid destabilization of the Earth’s climate system. This is no longer a warning for the future; it is a diagnosis of the present. Earth’s life-support systems are being pushed beyond stable limits, with changes unfolding faster than our ability to respond. Human activities are driving profound […]

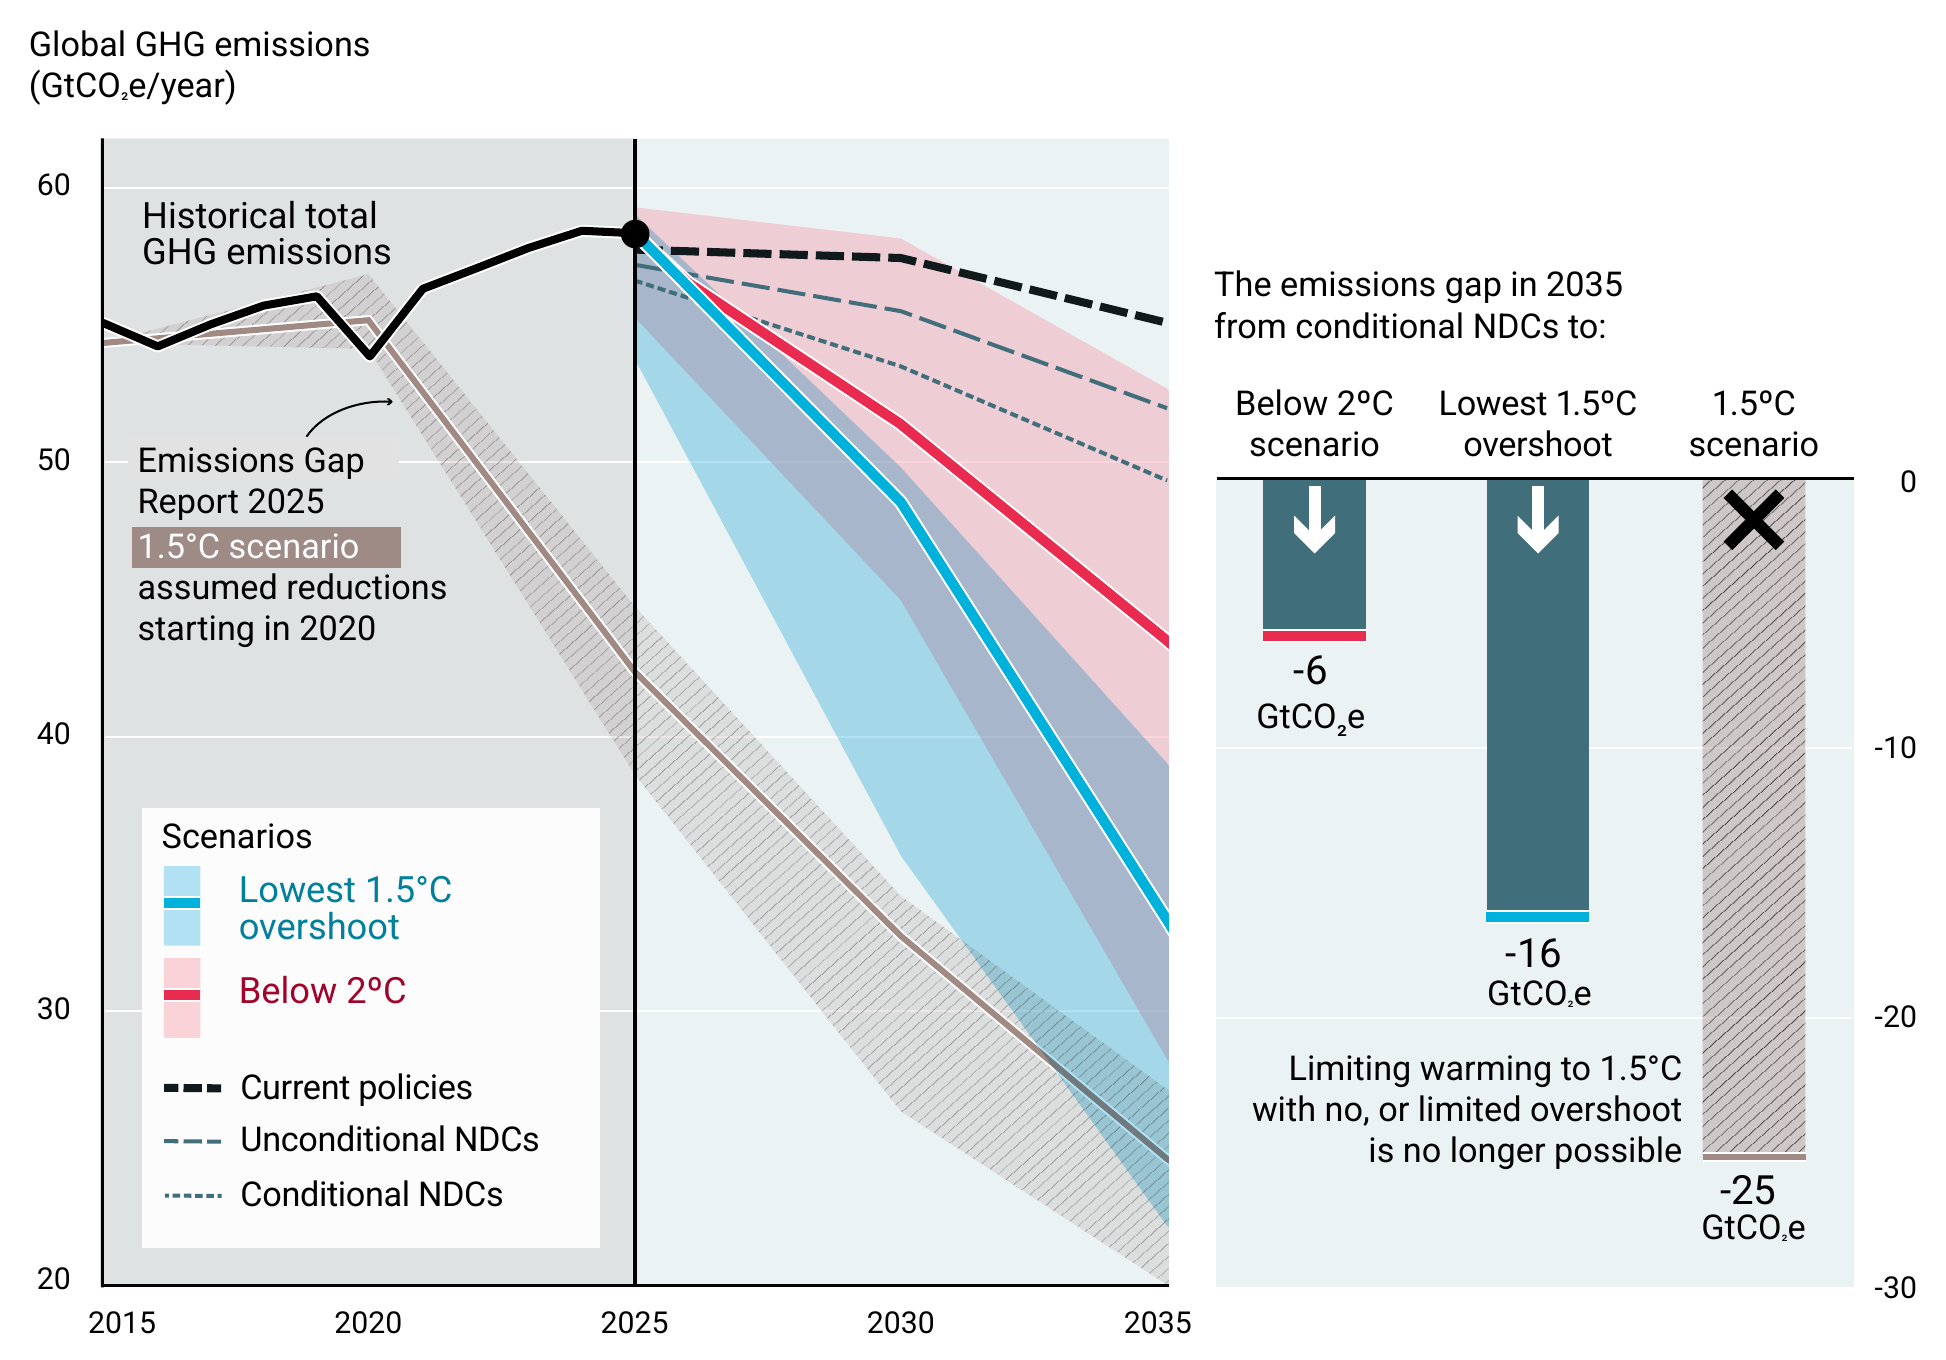
Global greenhouse gas (GHG) emissions under different scenarios, 2015-2035, and the emissions gap in 2035 with respect to the below 2°C and lowest 1.5°C overshoot scenarios. Limiting warming to 1.5°C with no or limited overshoot is no longer possible. The gap in 2035 between full implementation of the conditional nationally determined contributions (NDCs) and the lowest 1.5°C overshoot scenario is 16 GtCO2e; the gap to the below 2°C scenario is 6 GtCO2e. The hatched grey band is the 1.5°C scenario of the Emissions Gap Report 2025, which assumed reductions starting in 2020; the gap to it from conditional NDCs would have been 25 GtCO2e. Graphic: UNEP

UN Emissions Gap Report: exceedance of 1.5°C is now “imminent and unavoidable” – Emissions hit 58.4 GtCO2e in 2025; current policies lead to 2.8°C by 2100 – “The opportunity to bridge the 1.5°C emissions gap with ‘no or limited’ overshoot has been lost”

21 October 2026 (UNEP) – The headline finding of this seventeenth Emissions Gap Report is sobering. The opportunity to bridge the 1.5°C emissions gap with ‘no or limited’ overshoot has been lost. Decades of insufficient mitigation action means that larger exceedance of 1.5°C above pre-industrial levels based on multidecadal averages is now imminent and unavoidable. […]

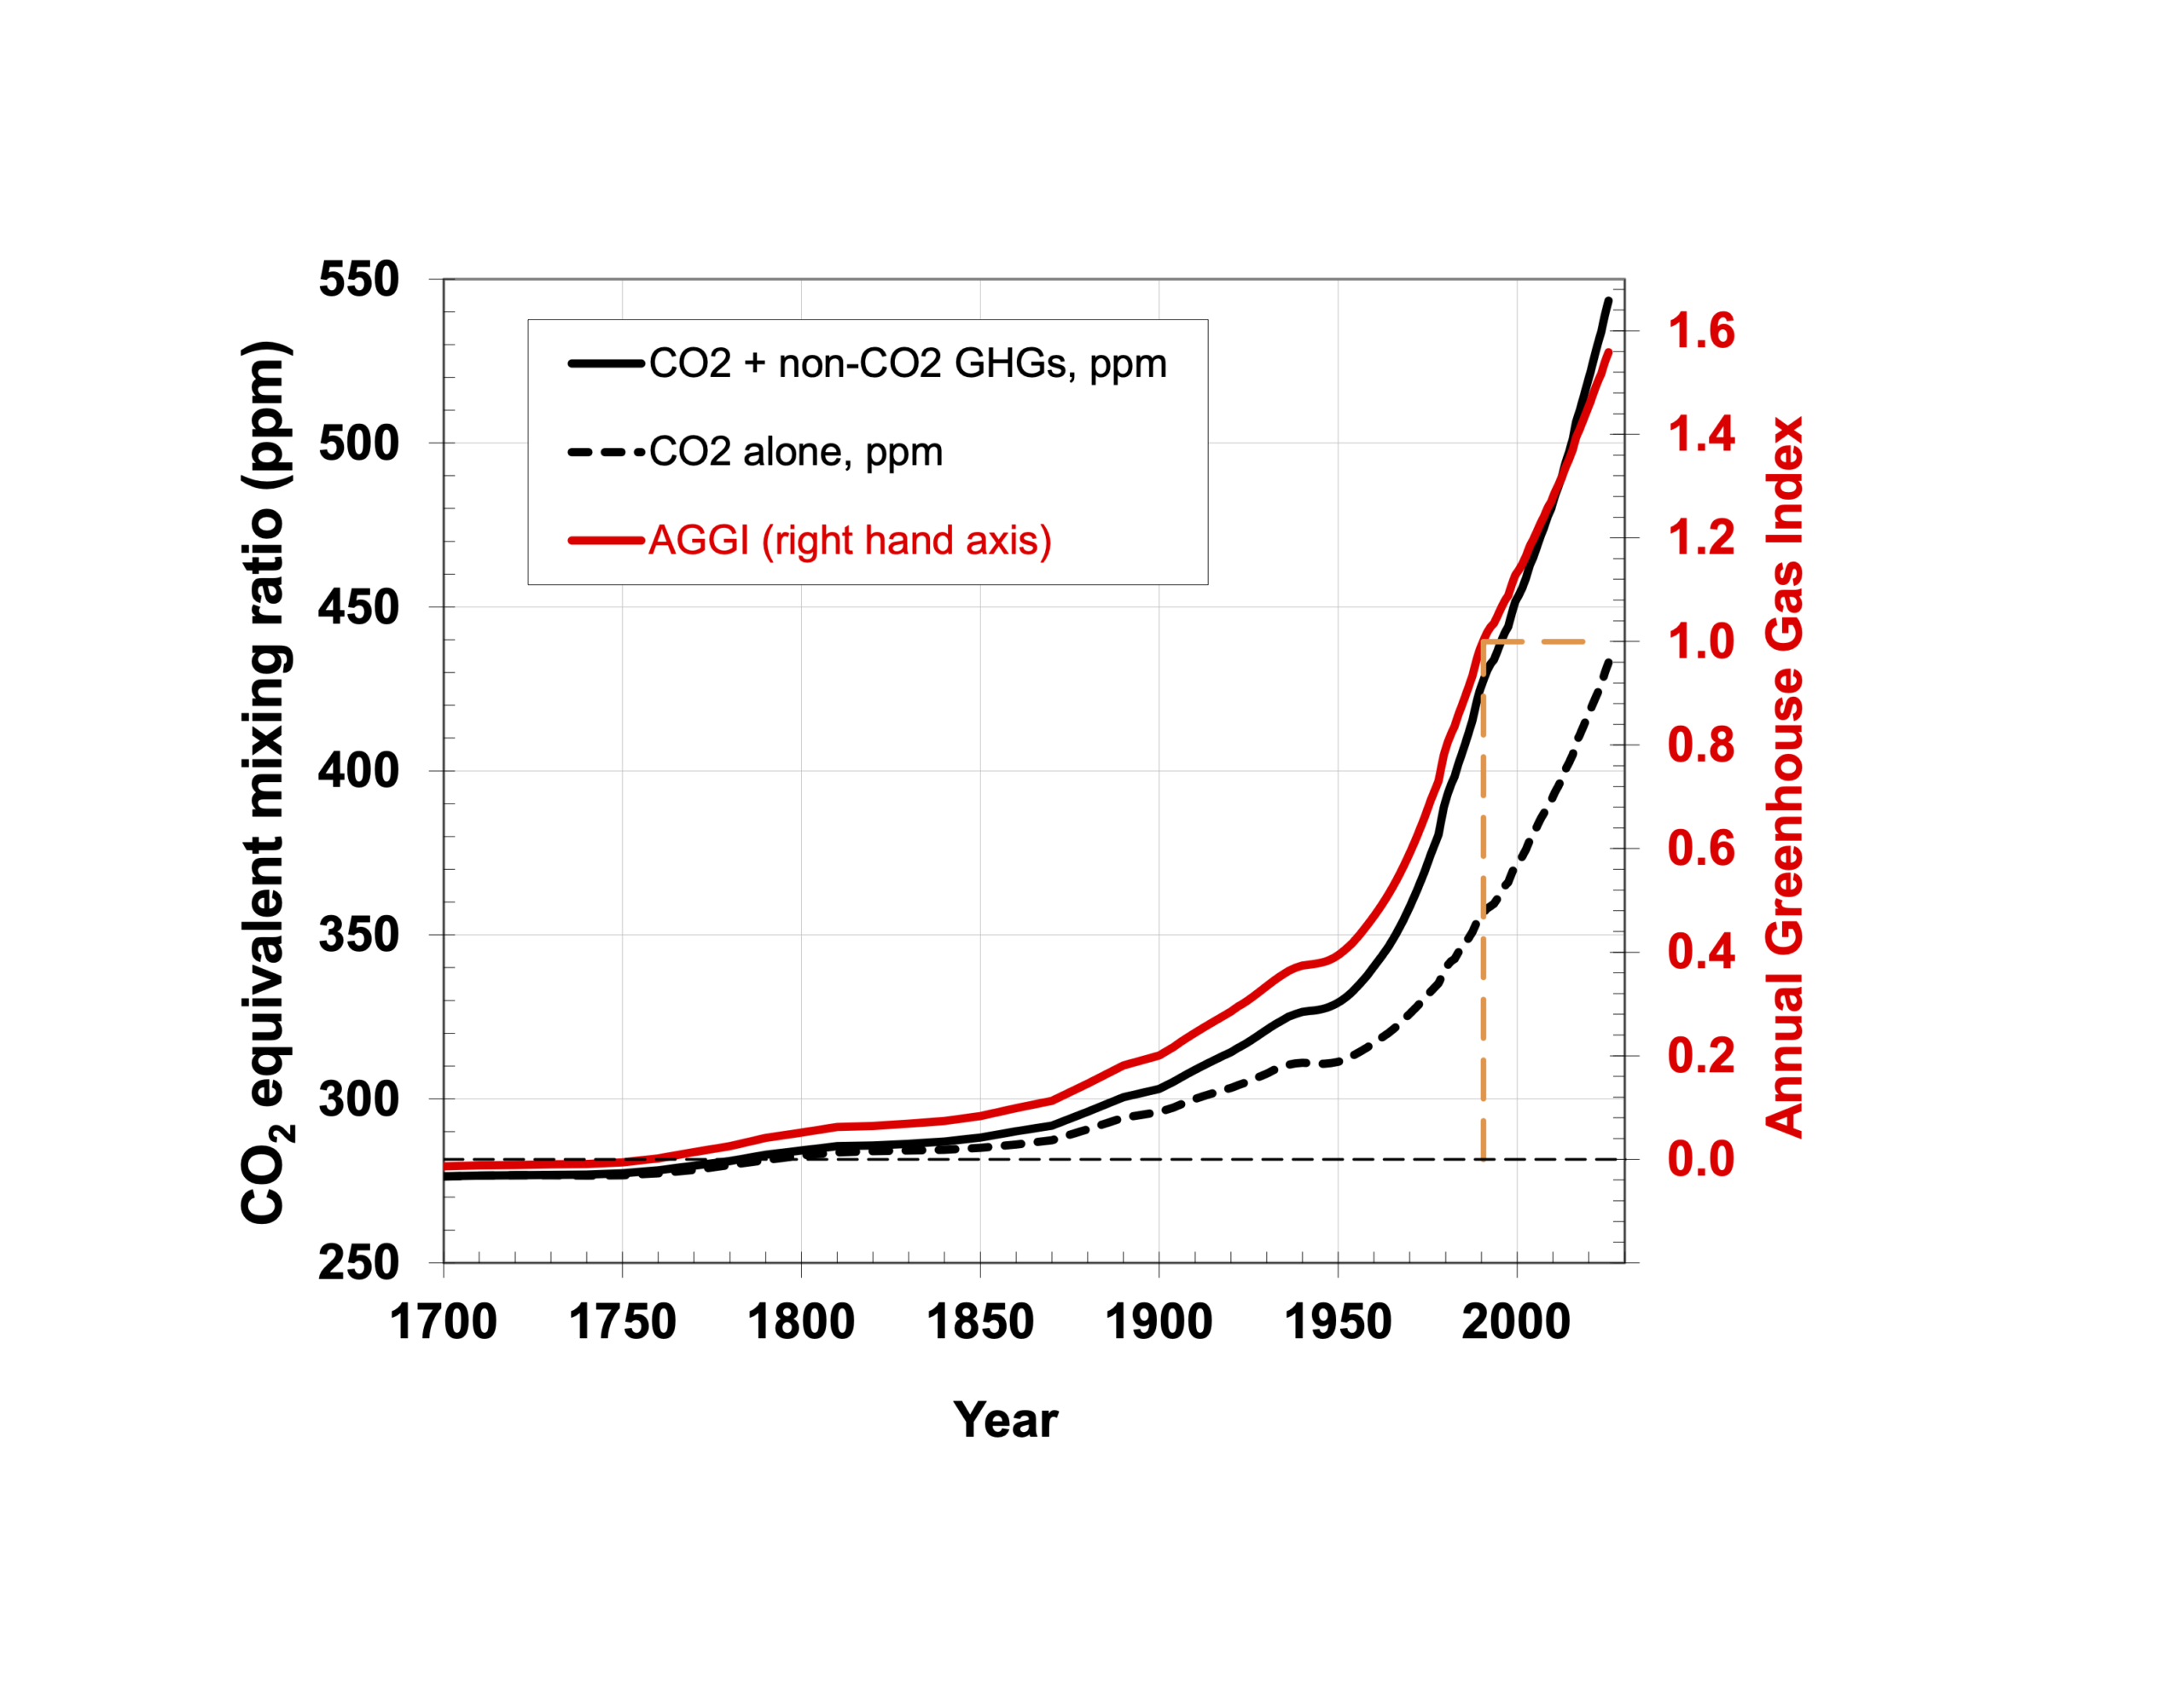
Annual Greenhouse Gas Index (AGGI), 1700-2025. For 2025, the AGGI was a record high 1.56, representing a 56 percent increase in effective radiative forcing from long-lived greenhouse gases since 1990. Time series since 1700 for atmospheric CO2 abundance (black dashed line), CO2-equivalent abundance based on ongoing measurements of all greenhouse gases reported here (black line), and the AGGI (red line, right-hand scale). The measurements of CO2 between the 1950s and 1978 are from C.D. Keeling [Keeling et al., 1958]. Prior to 1978, atmospheric abundances represent values derived from air trapped in ice and snow above glaciers [Machida et al., 1995, Battle et al., 1996, Etheridge et al., 1996; Butler et al., 1999]. The dashed orange lines highlight the AGGI reference year (1990) at which the index is normalized to a value of 1.0. Graphic: NOAA Global Monitoring Laboratory

Another record high for NOAA Annual Greenhouse Gas Index in 2025 – Long-lived greenhouse gases trapped 56 percent more heat than in 1990 – Carbon dioxide reached 425.62 ppm, and its rate of increase has accelerated to 2.5 ppm per year

21 October 2026 (NOAA) – The AGGI quantifies radiative forcing from long-lived trace gases and its change over time. The index is derived from NOAA GML’s long-term measurements of greenhouse gas abundances in the remote atmosphere at sites across the globe; it is formulated to provide an understanding of the change in radiative forcing in […]

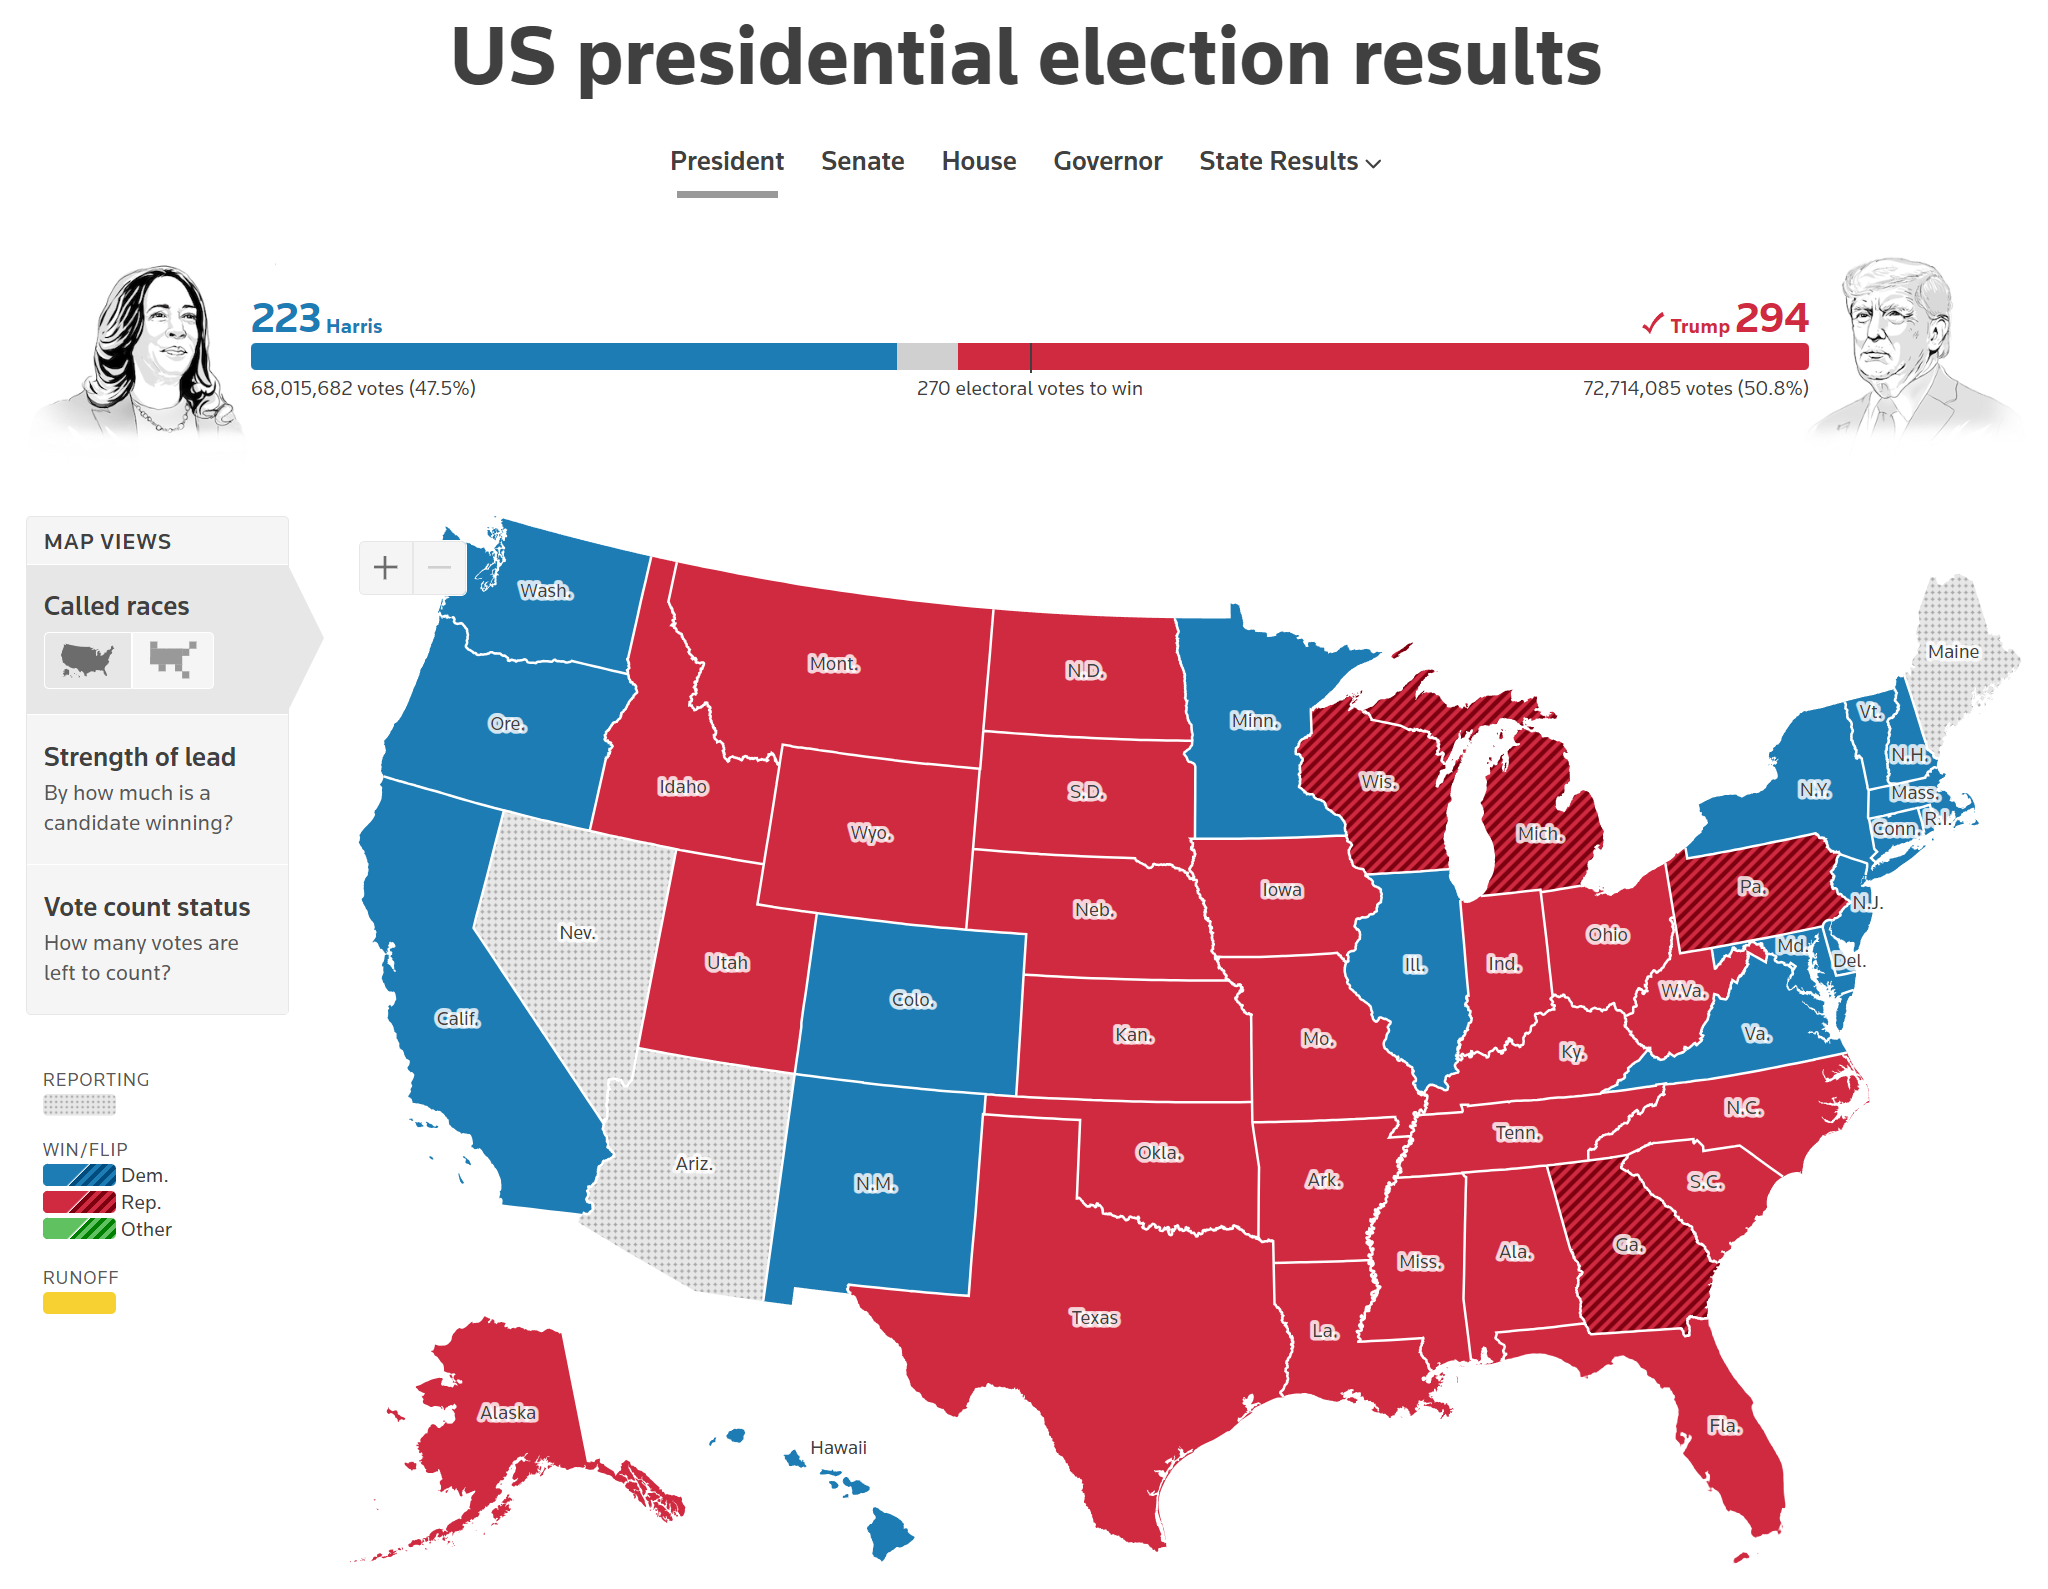
Map showing the results of the disastrous U.S. presidential election, 7 November 2024. Graphic: Reuters

Desdemona going dark

7 November 2024 (Desdemona Despair) – My work here is done. After more than 13,000 posts warning of the end of the Phanerozoic eon and the imminent extinction of the human species, I’m calling it quits. The first Desdemona blog post was on 14 November 2008 and was titled, Rising CO2 accelerates coral bleaching: study. […]

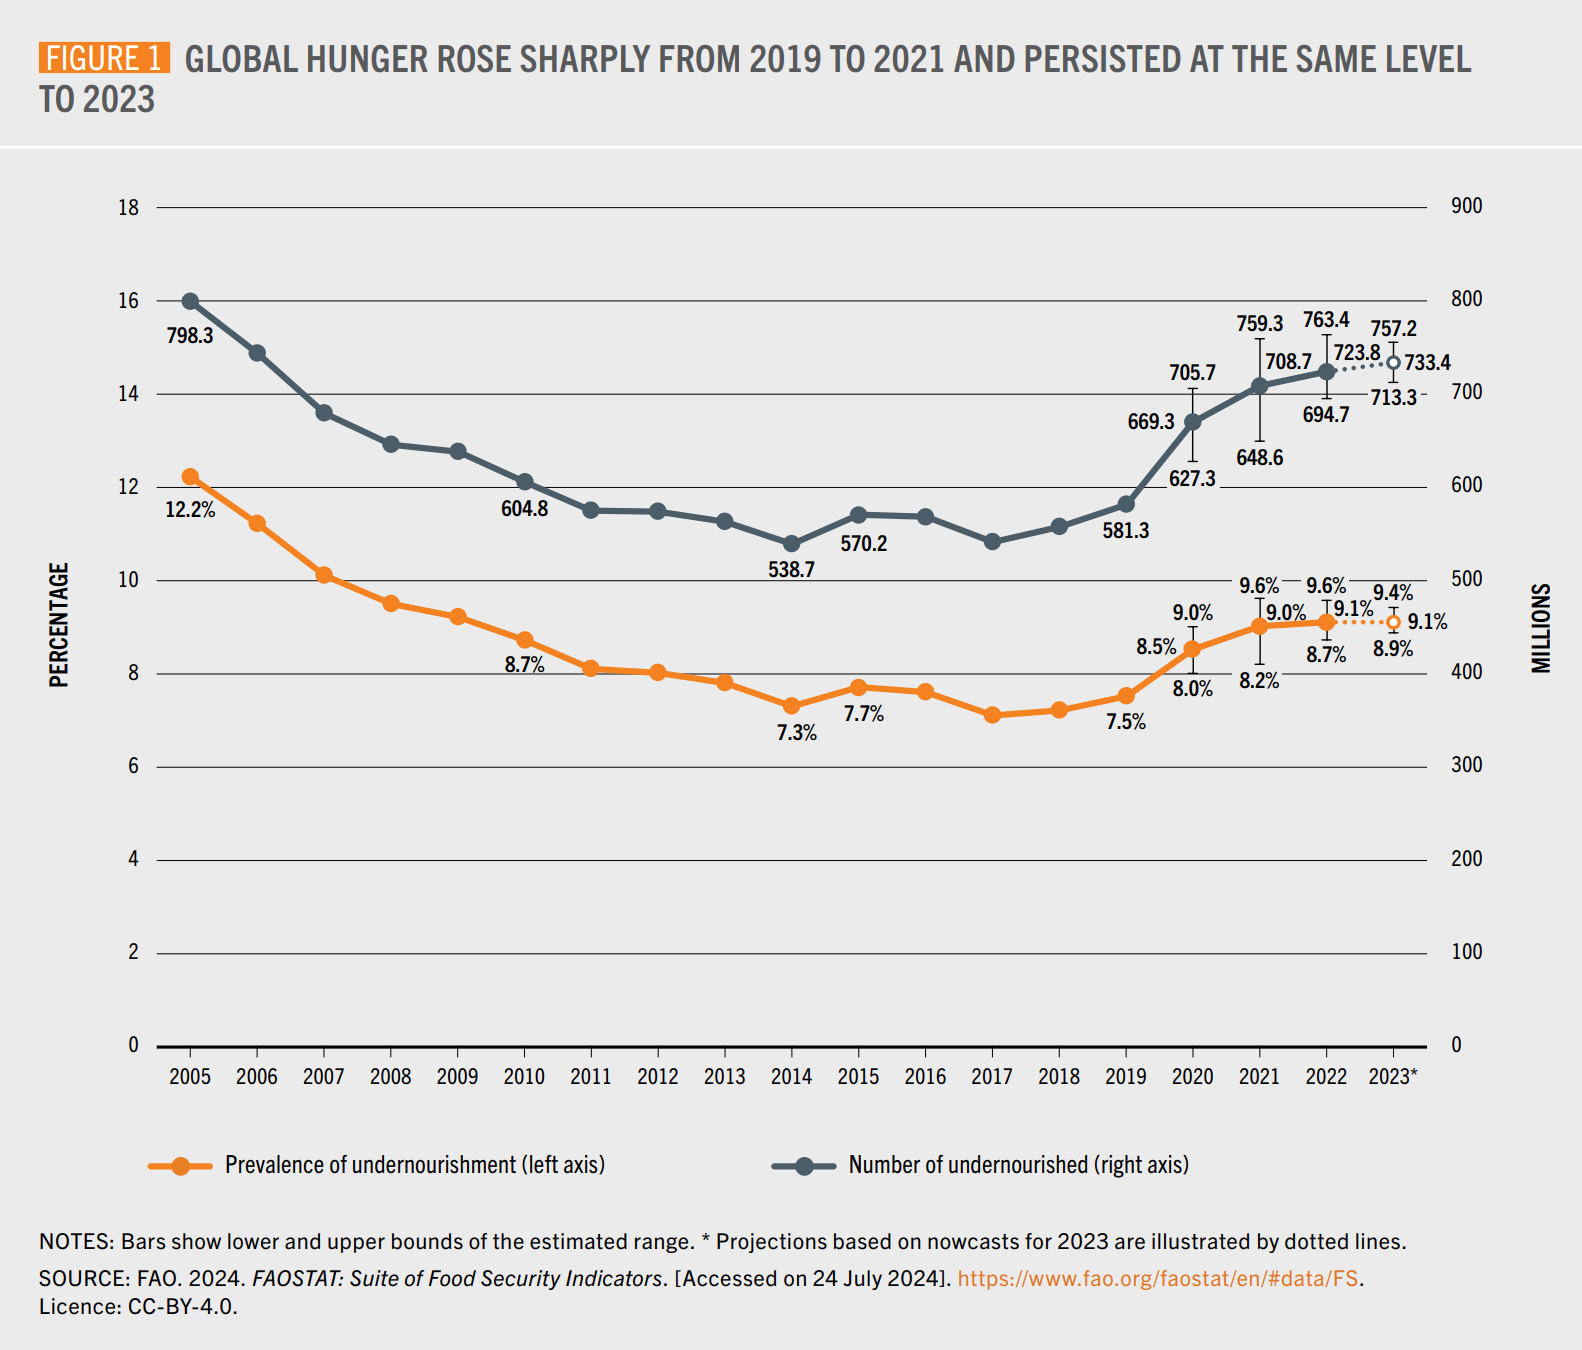
Prevalence of undernourishment (left axis) Number of undernourished (right axis), 2005-2023. After rising sharply from 2019 to 2021, the proportion of the world population facing hunger persisted at virtually the same level for three consecutive years, with the latest estimates indicating a global PoU of 9.1 percent in 2023. In terms of population, between about 713 and 757 million people (8.9 and 9.4 percent of the global population, respectively) were estimated to be undernourished in 2023. Considering the mid-range estimate (733 million), about 152 million more people may have faced hunger in 2023 compared to 2019. Graphic: FAO

Hunger numbers stubbornly high for three consecutive years as global crises deepen: UN report – The world has been set back 15 years, with levels of undernourishment comparable to those in 2008-2009 – 1 in 11 people worldwide faced hunger in 2023, 1 in 5 in Africa

30 September 2024 (World Bank) – Domestic food price inflation remains high in many low- and middle-income countries. Inflation higher than 5 percent is experienced in 77.3 percent of low-income countries (18.2 percentage points higher since the last Update on June 27, 2024), 54.3 percent of lower-middle-income countries (8.7 percentage points lower), 44% of upper-middle-income […]

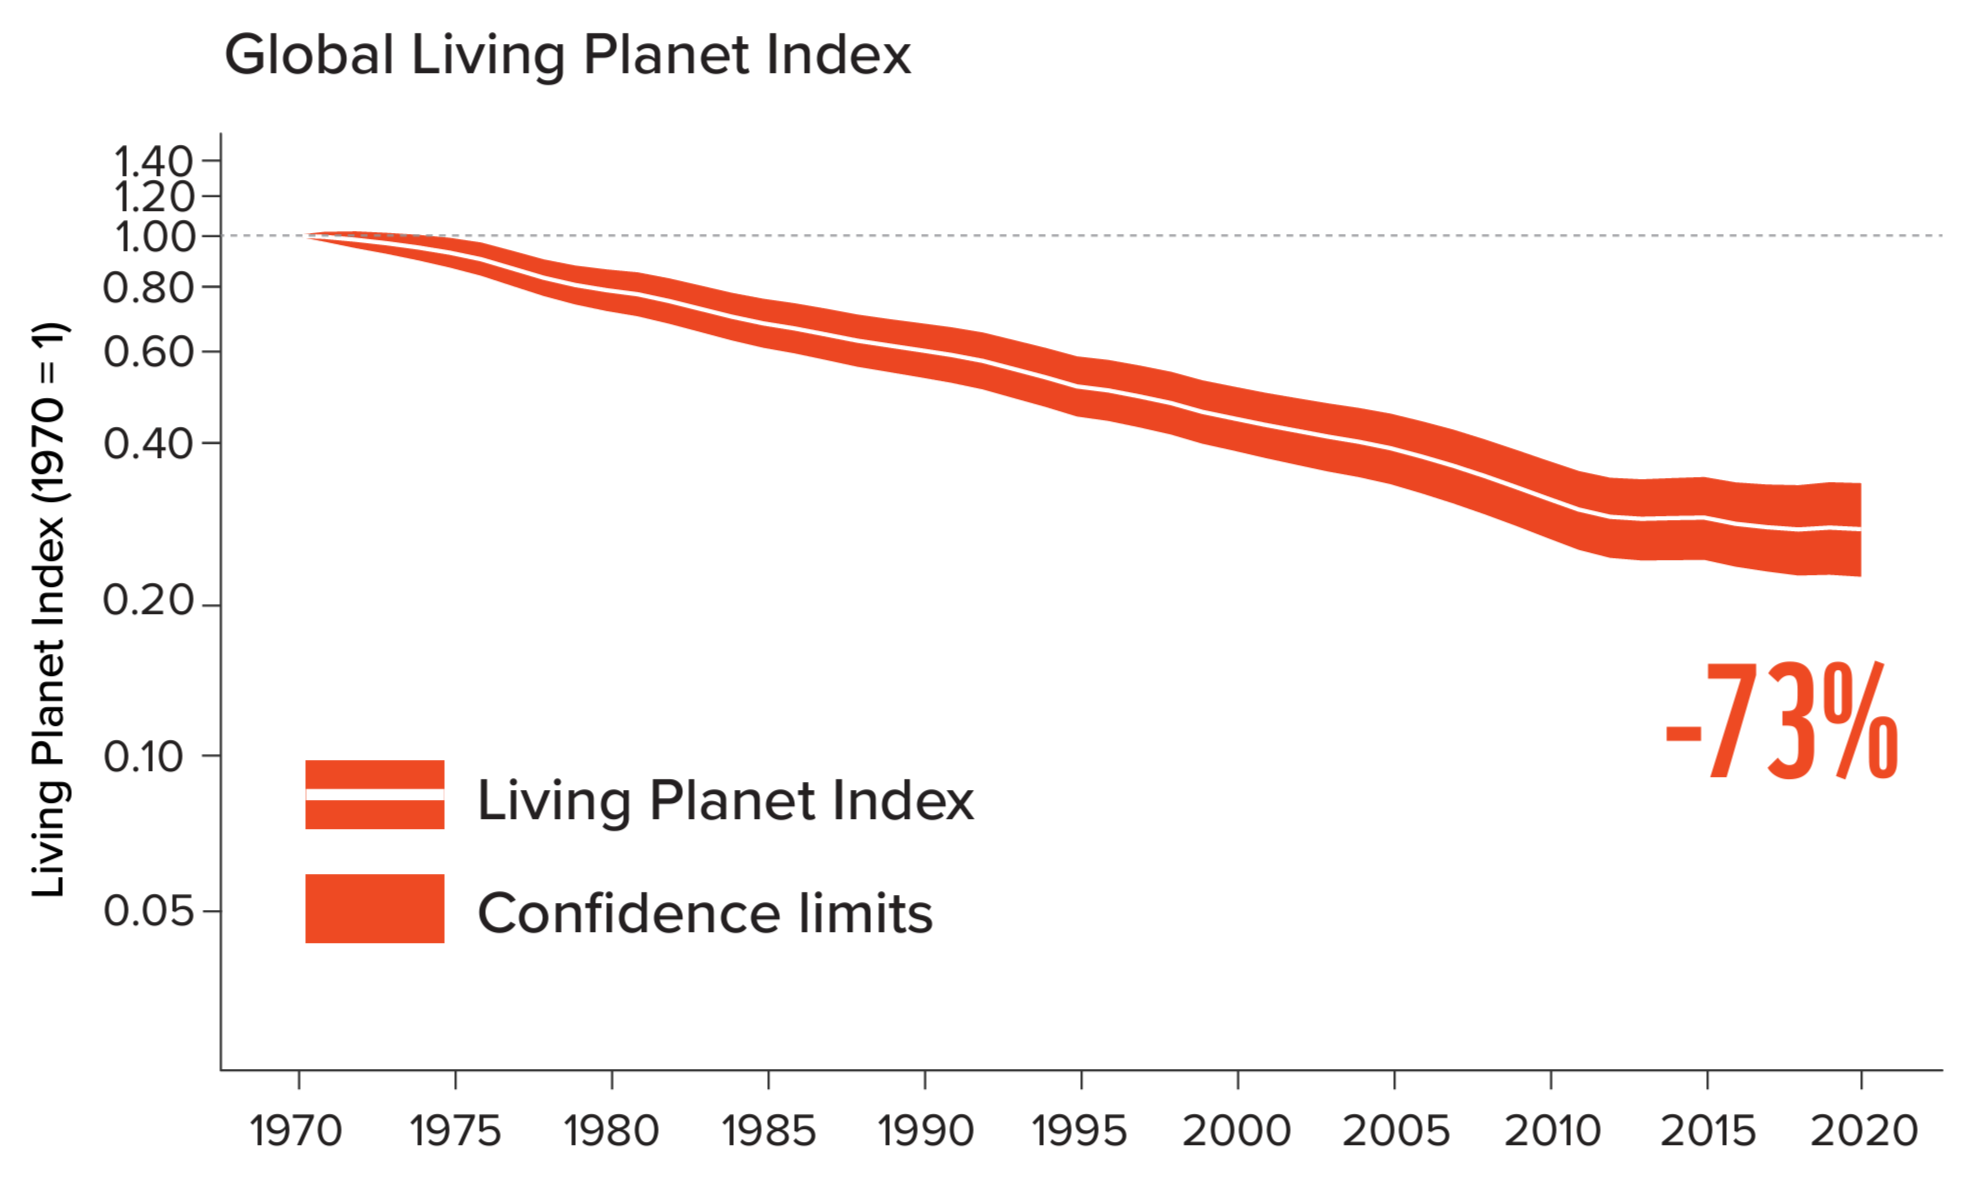
The global Living Planet Index, 1970-2020. The LPI is based on 34,836 monitored populations of 5,495 vertebrate species. The white line represents the index value, and the shaded areas represent the statistical uncertainty surrounding the value. Graphic: WWF / ZSL

Global biodiversity report shows “catastrophic decline” in wildlife populations – “In just my lifetime, 50 years, we’ve seen a decline of 73 percent in the average size of these wildlife populations”

By Molly McCrea 18 October 2024 (CBS News) – A shocking new report on global biodiversity is detailing what it calls “a catastrophic decline” in wildlife populations ahead of a major international conference on biodiversity. On Monday, 21 October 2024, the United Nations will convene a two-week conference in Cali, Colombia called COP16. On the agenda […]

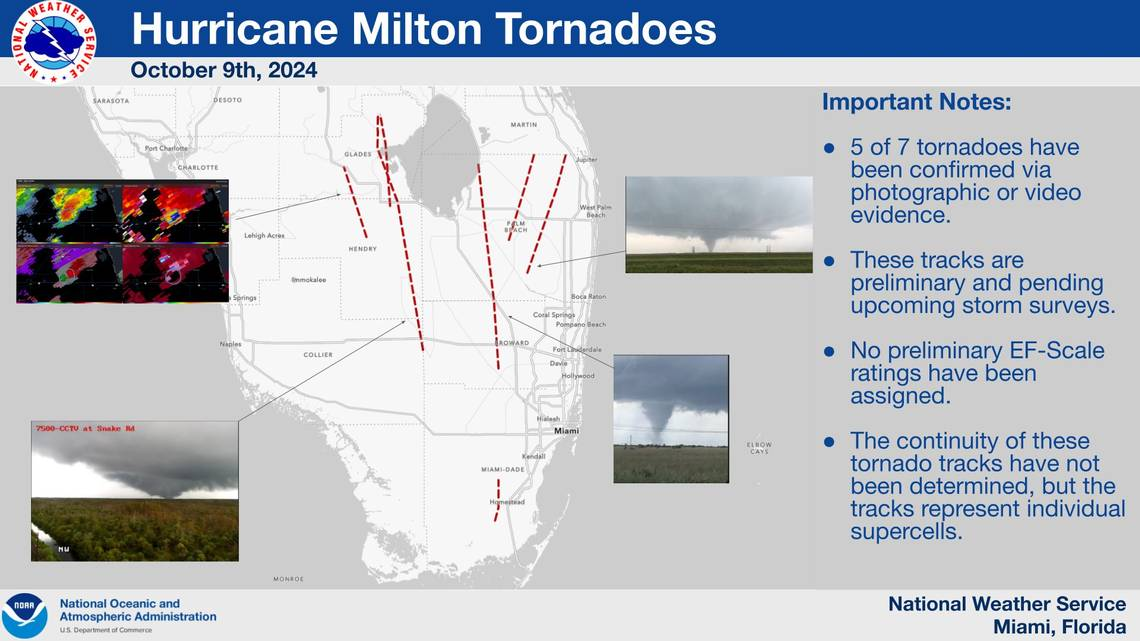
Map showing tornado tracks during Hurricane Milton on 9 October 2024. The Miami office of the National Weather Service confirmed at least 5 tornadoes during Hurricane Milton’s approach. Graphic: NWS

Hurricane Milton’s terrible twisters: Outbreak in Florida killed at least 5, leveled buildings – Miami National Weather Service issued a record 55 tornado warnings, beating a previous record of 49 during Category 4 Hurricane Ian in 2022

By Alex Harris 10 October 2024 (Miami Herald) – A deadly and unprecedented wave of tornadoes swirled across Florida ahead of the arrival of Category 3 Hurricane Milton, which crossed the state from Sarasota to the Space Coast Wednesday evening. A series of twisters that struck St. Lucie County left at least five dead and, […]

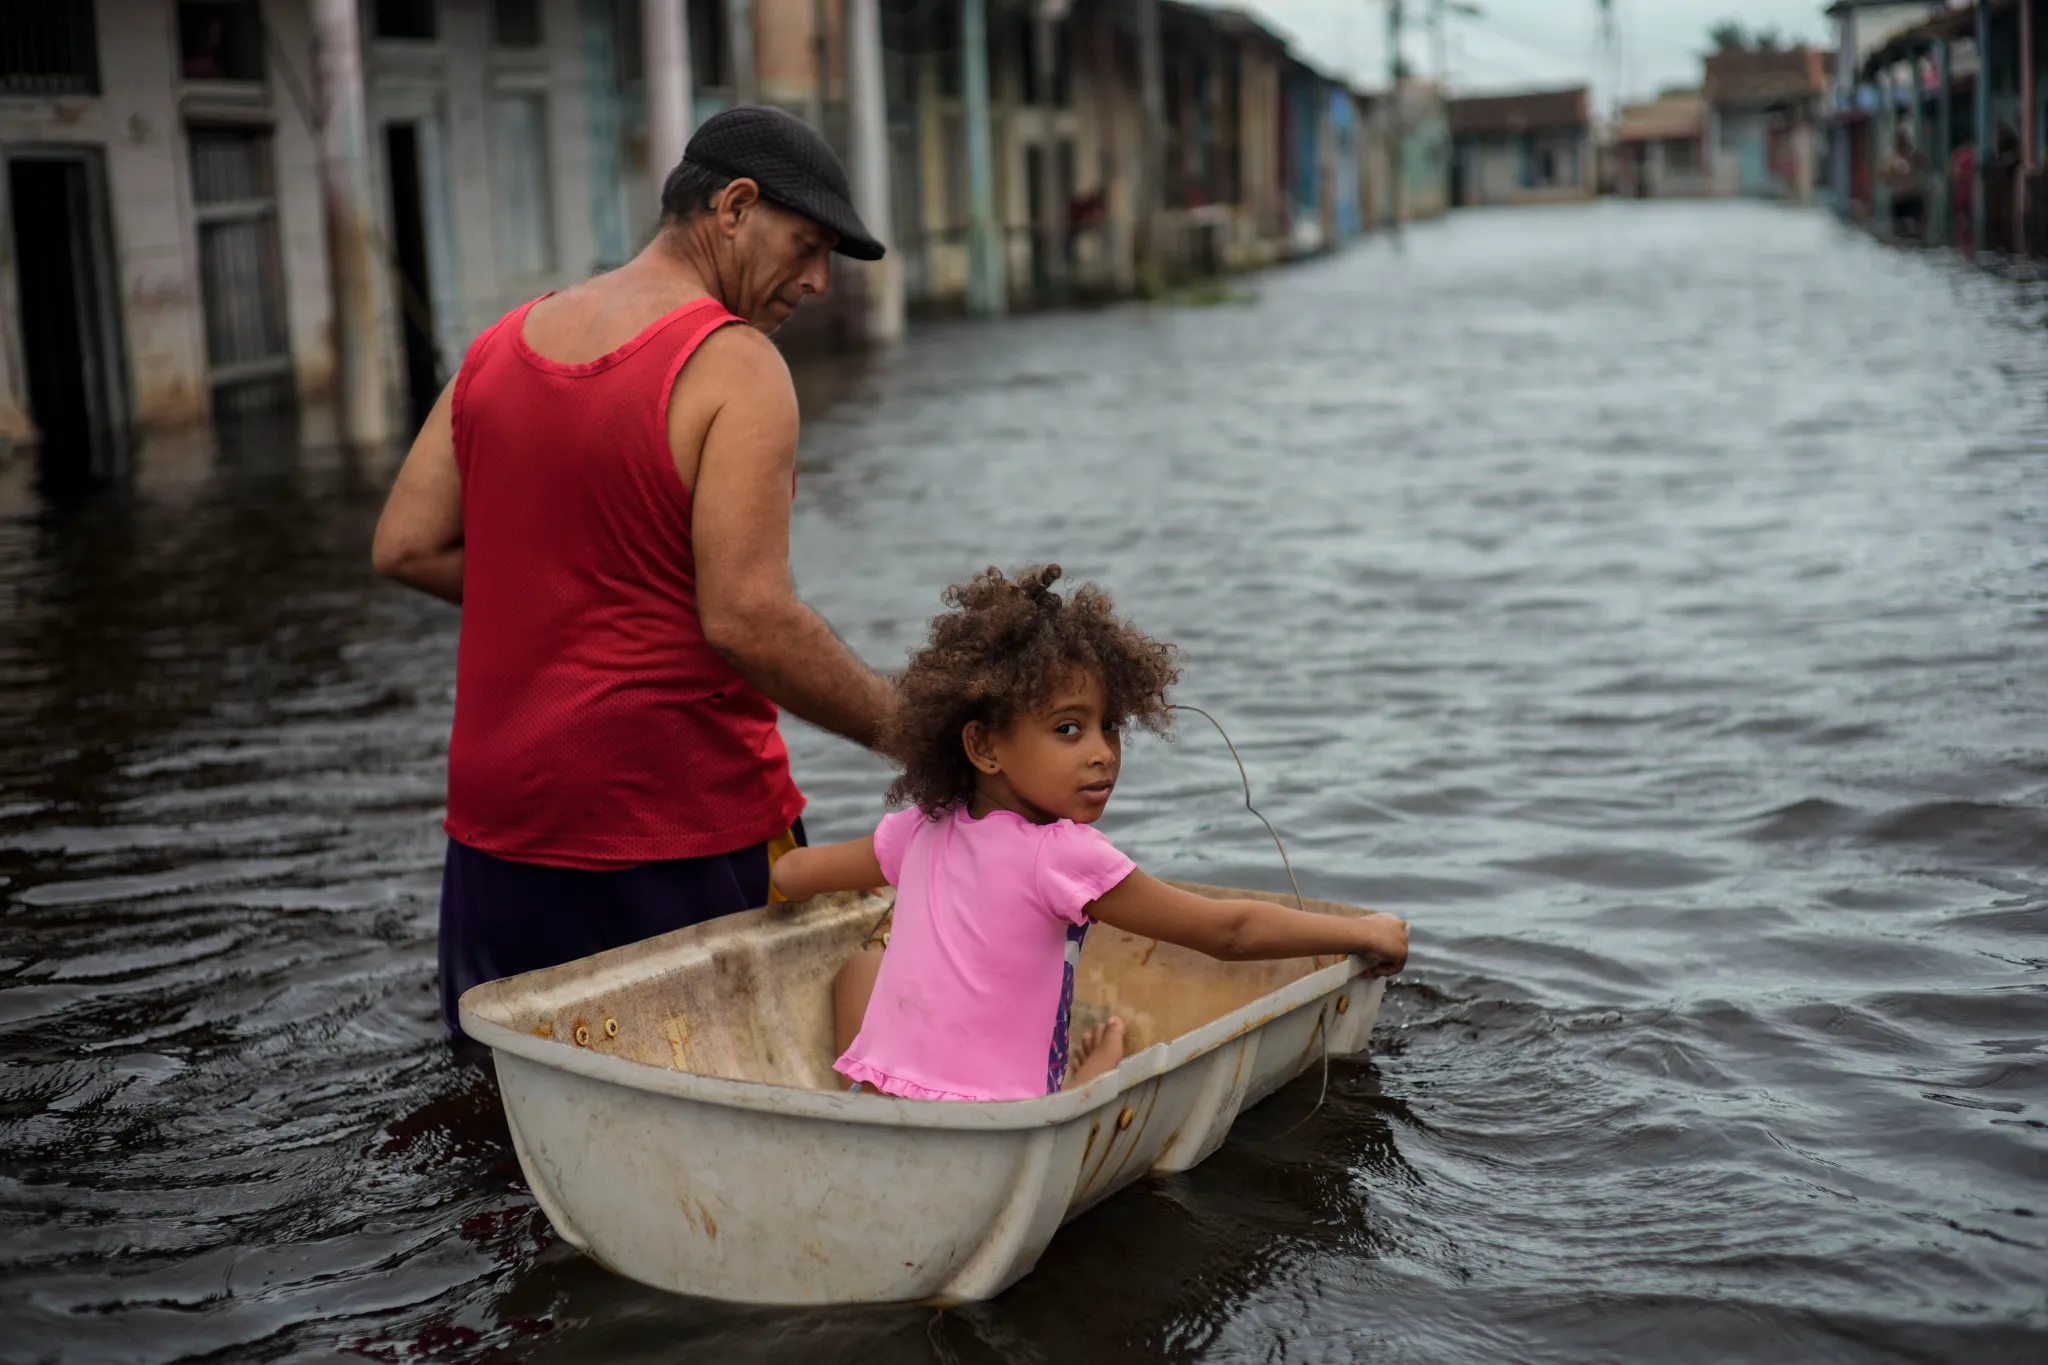
Jesus Hernandez guides his granddaughter Angelina via a container through a street flooded in the passing of Hurricane Helene, in Batabano, Mayabeque province, Cuba, on Thursday, 26 September 2024. Photo: Ramon Espinosa / AP Photo

Our dystopian climate isn’t just about fires and floods. It’s about society fracturing.

By Bill McKibben 9 October 2024 (The Guardian) – Even as the good people of Florida’s west coast pulled the soggy mattresses from Helene out to the curb, Milton appeared on the horizon this week – a double blast of destruction from the Gulf of Mexico that’s a reminder that physics takes no time off, not even in the […]

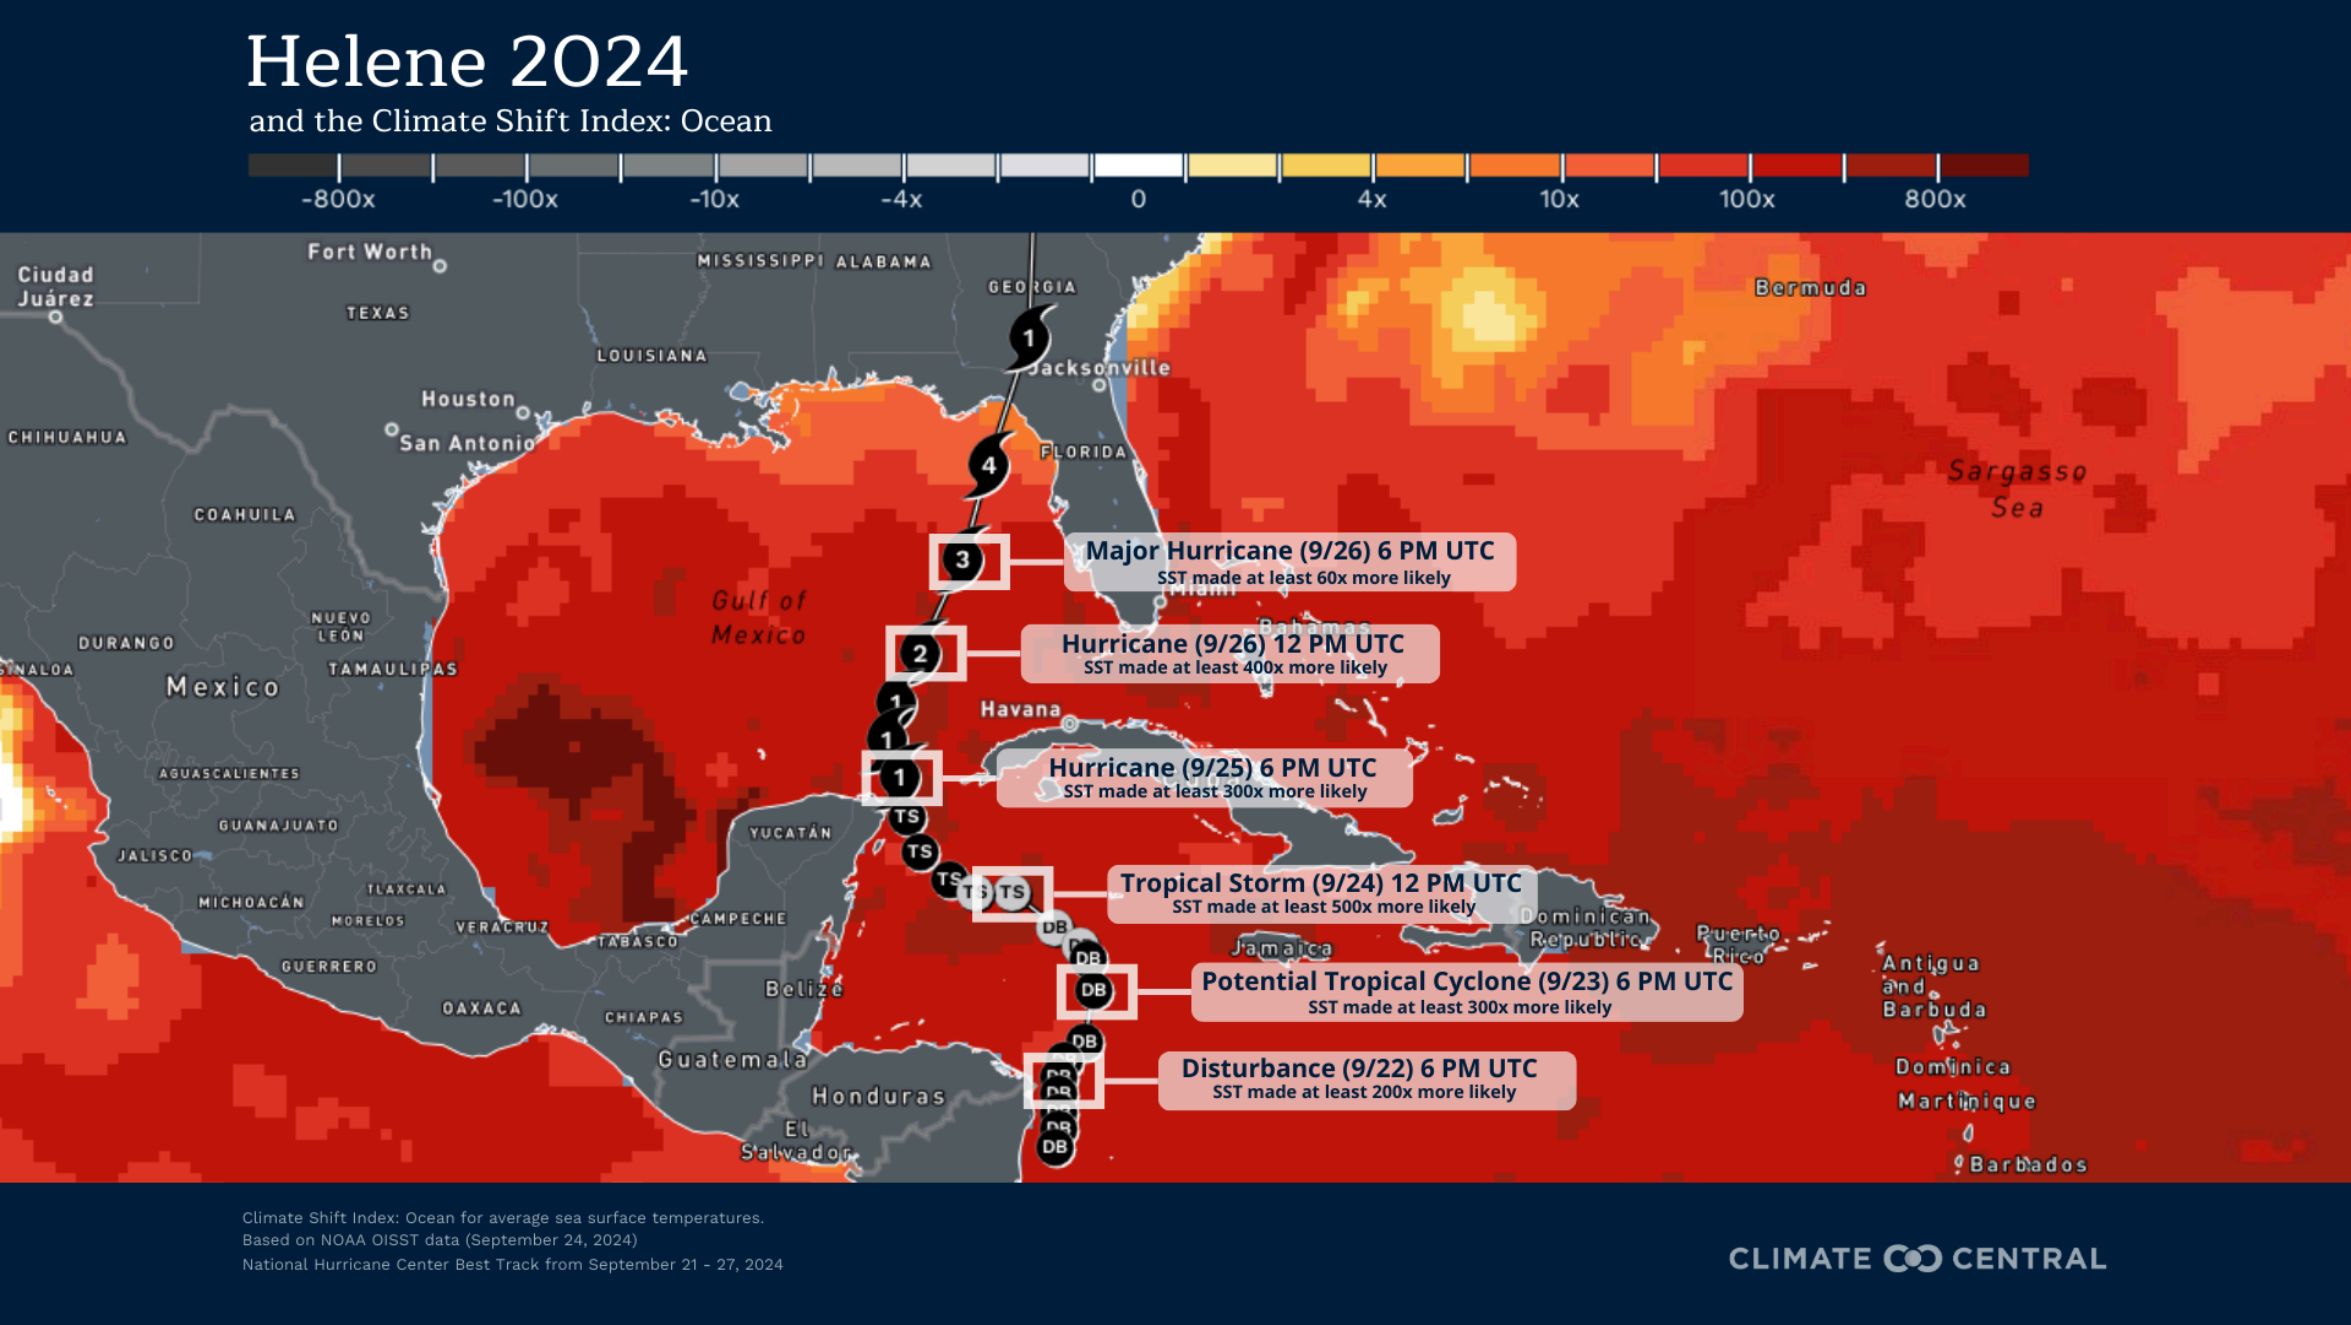
Ocean Climate Shift Index (CSI) along the track of Helene, as it developed from disturbance to tropical storm to hurricane to major hurricane. Ocean CSI in surrounding regions are drawn from 24 September 2024, when the storm developed from a potential tropical cyclone to a tropical storm, coinciding with the highest Ocean CSI (in excess of 500) measured along its track. Graphic: Climate Central

Hurricane Helene was supercharged by ultra-warm water made up to 500 times more likely by global warming, study finds – “The heat that human activities are adding to the atmosphere and oceans is like steroids for hurricanes”

By Rachel Ramirez 9 October 2024 (CNN) – The exceptionally warm water of the Gulf of Mexico that supercharged deadly Helene last month was made up to 500 times more likely by human-caused climate change, which also ramped up the hurricane’s wind and rain, according to a new scientific analysis. Helene, which made landfall in Florida as […]

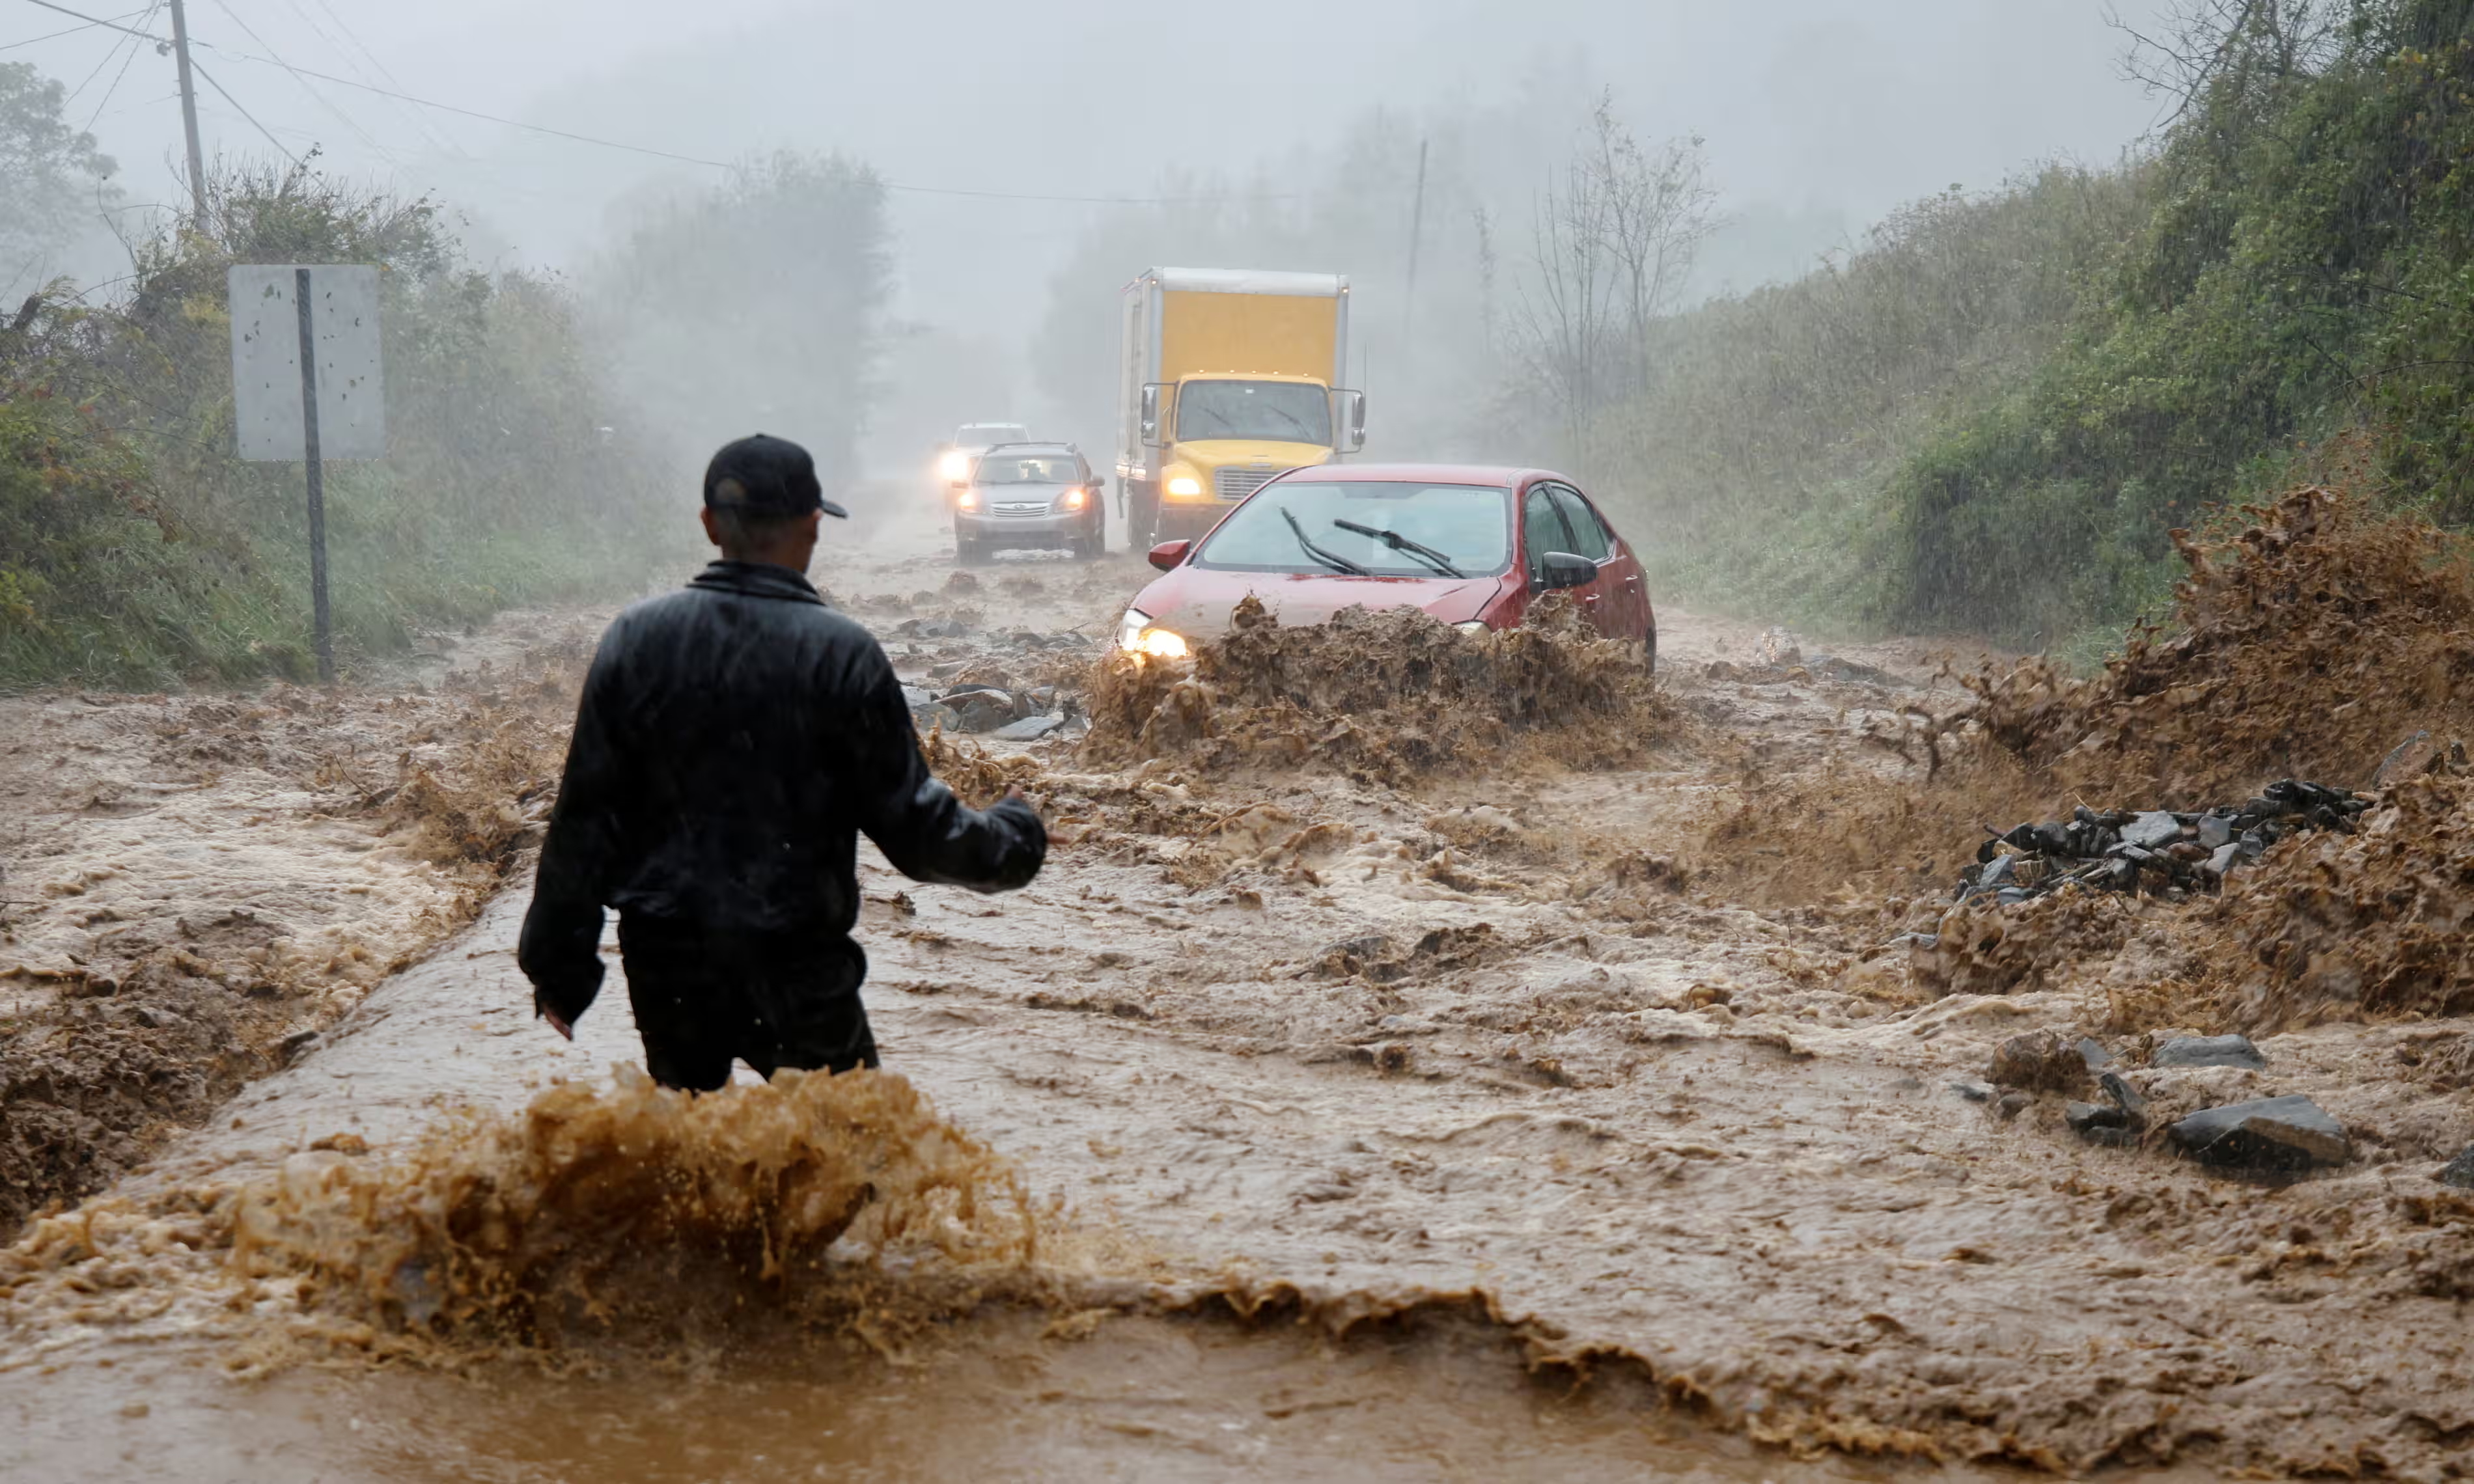
A resident helps free a stranded car as Hurricane Helene strikes Boone, North Carolina. Photo: Jonathan Drake / Reuters

I wasn’t prepared to be a climate refugee – A climate advocate learns firsthand the price of climate change in our lives and calls for voters to head off future disasters – “My daughter is still having nightmares”

By Melissa Hanson 4 October 2024 (Scientific American) – I wasn’t prepared to be a climate refugee. Not after relocating my family from drought and wildfire-prone California to the “climate haven” of Asheville, N.C. But less than two months after we moved into our delightfully wooded, mild-weather community, we were forced to leave. Even before […]
Social media & sharing icons powered by UltimatelySocial