By Risa Palm and Toby W. Bolsen 25 March 2022 (The Conversation) – Apollo Beach, Florida, is a maze of canals lined with hundreds of houses perched right near the water’s edge. The whole community, just south of Tampa, is only about 3 feet above sea level, meaning it’s at risk from storm surge as […]
9 March 2022 (National Phenology Network) – Spring leaf out continues to progress across the country. Our spring leaf anomaly compares the arrival of spring leaf out this year to a long-term average of 1991-2020. After a slow start to spring across much of the Southeast, spring is progressing more rapidly, arriving a few days […]
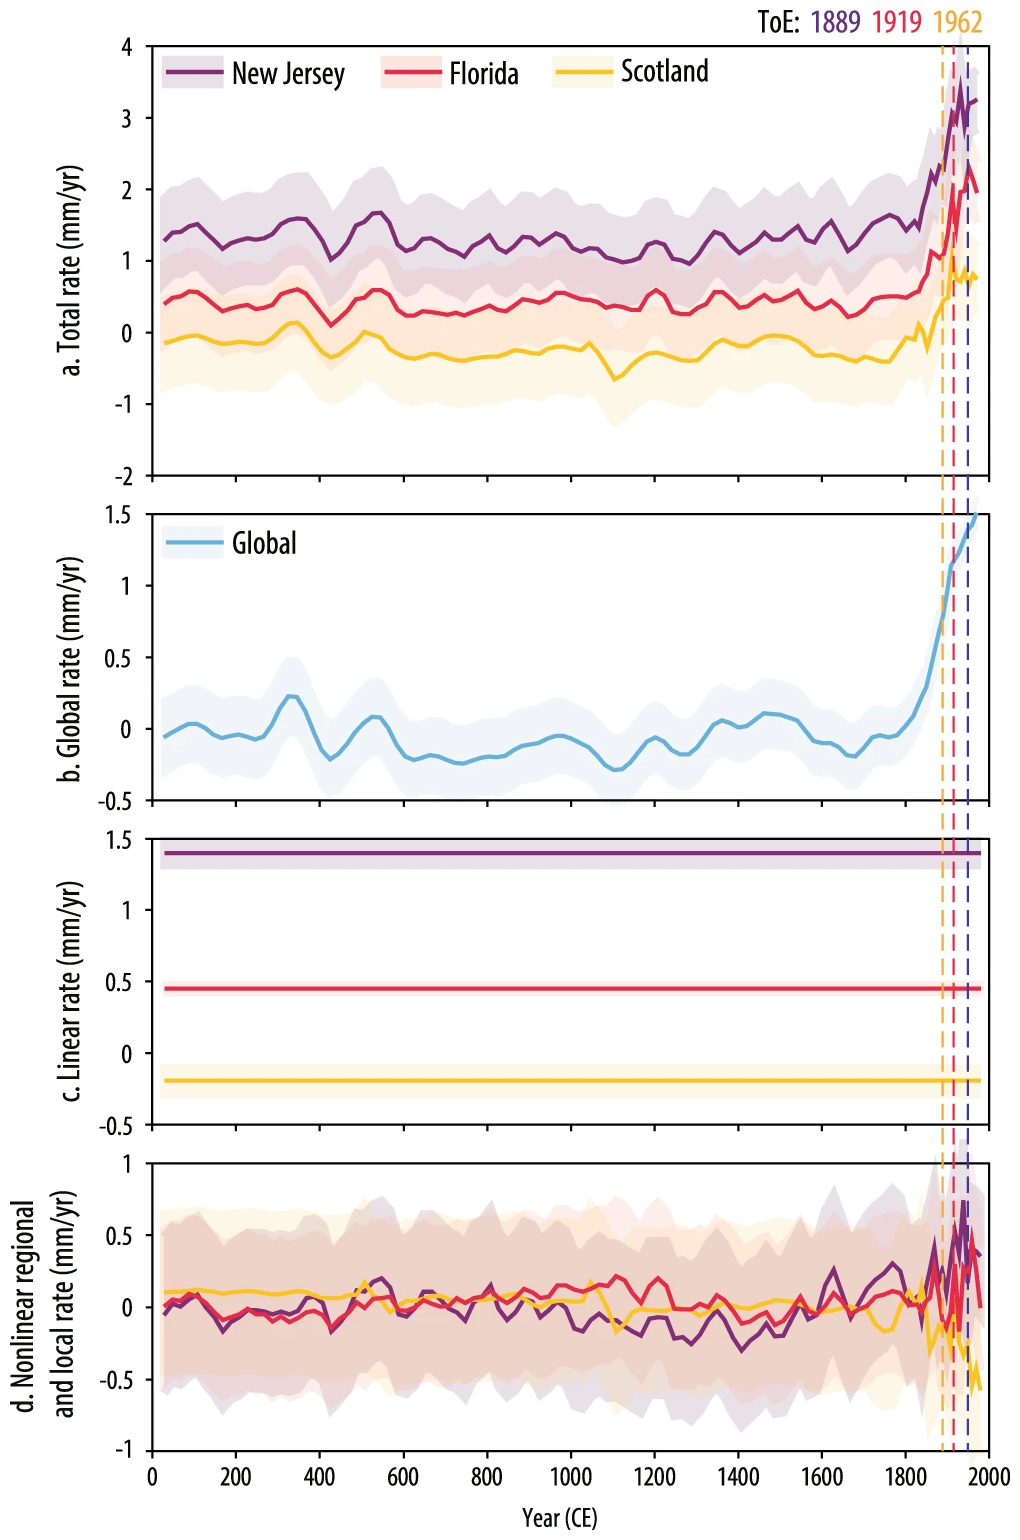
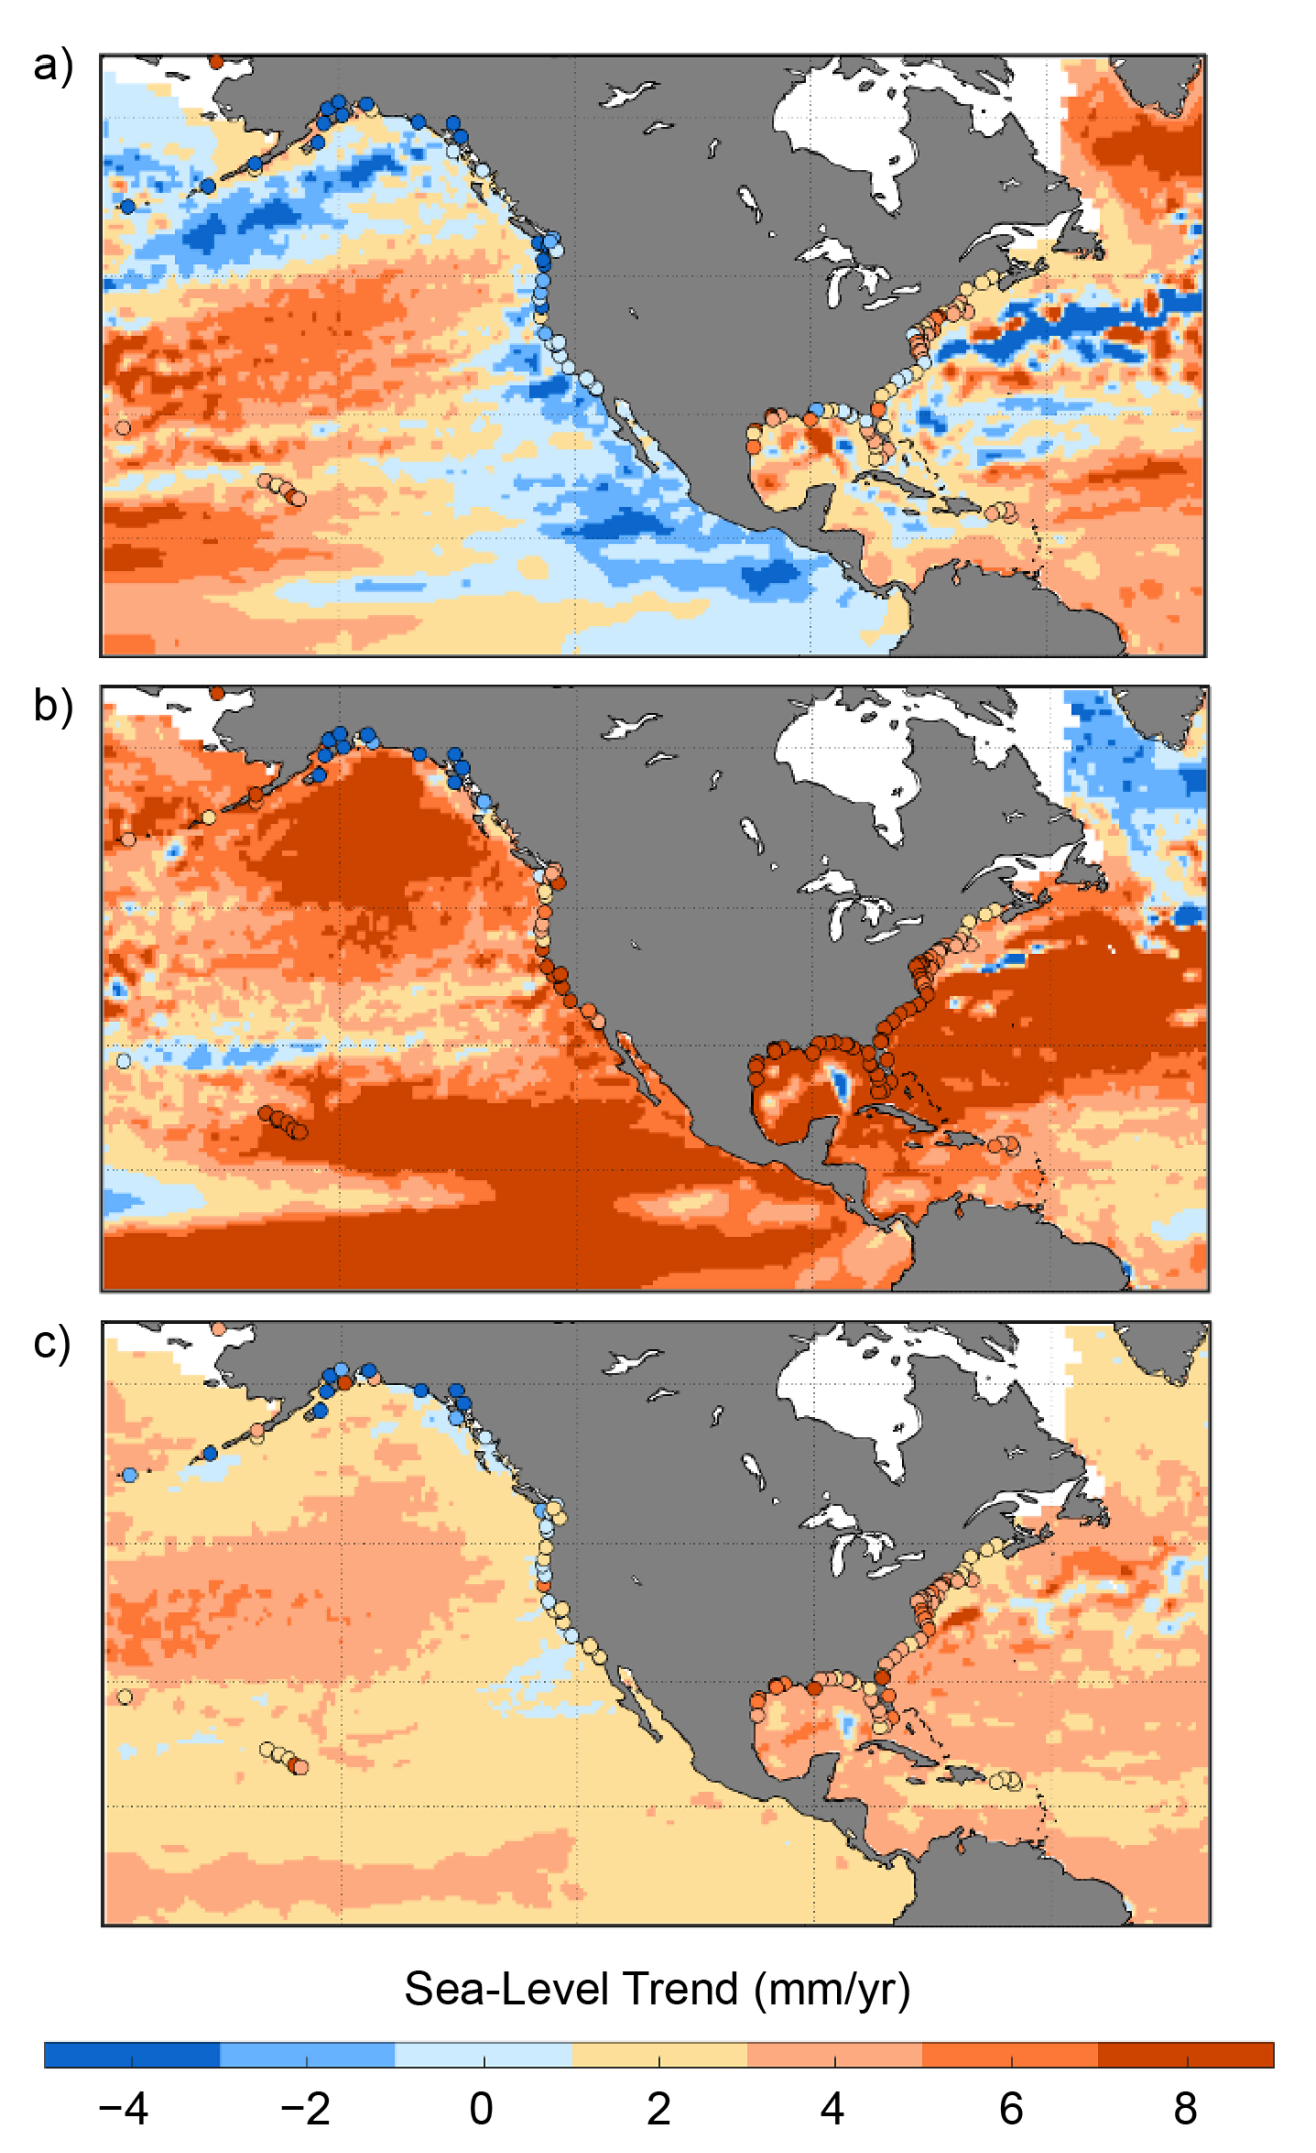
18 February 2022 (Rutgers University) – An international team of scientists including Rutgers researchers has found that modern rates of sea level rise began emerging in 1863 as the Industrial Age intensified, coinciding with evidence for early ocean warming and glacier melt. The study, which used a global database of sea-level records spanning the last […]
15 February 2022 (NOAA) – The United States is expected to experience as much sea level rise by the year 2050 as it witnessed in the previous hundred years. That’s according to a NOAA-led report updating sea level rise decision-support information for the U.S. released today in partnership with half a dozen other federal agencies. […]
By Frank Gluck 19 January 2022 (Fort Myers News-Press) – Gov. Ron DeSantis’ administration, already facing criticism for downplaying the efficacy of COVID-19 vaccinations, has put on leave Orange County Health Director Dr. Raul Pino for encouraging his staff to get vaccinated. Pino had written in a 4 January 2022 email to his staff: “I […]
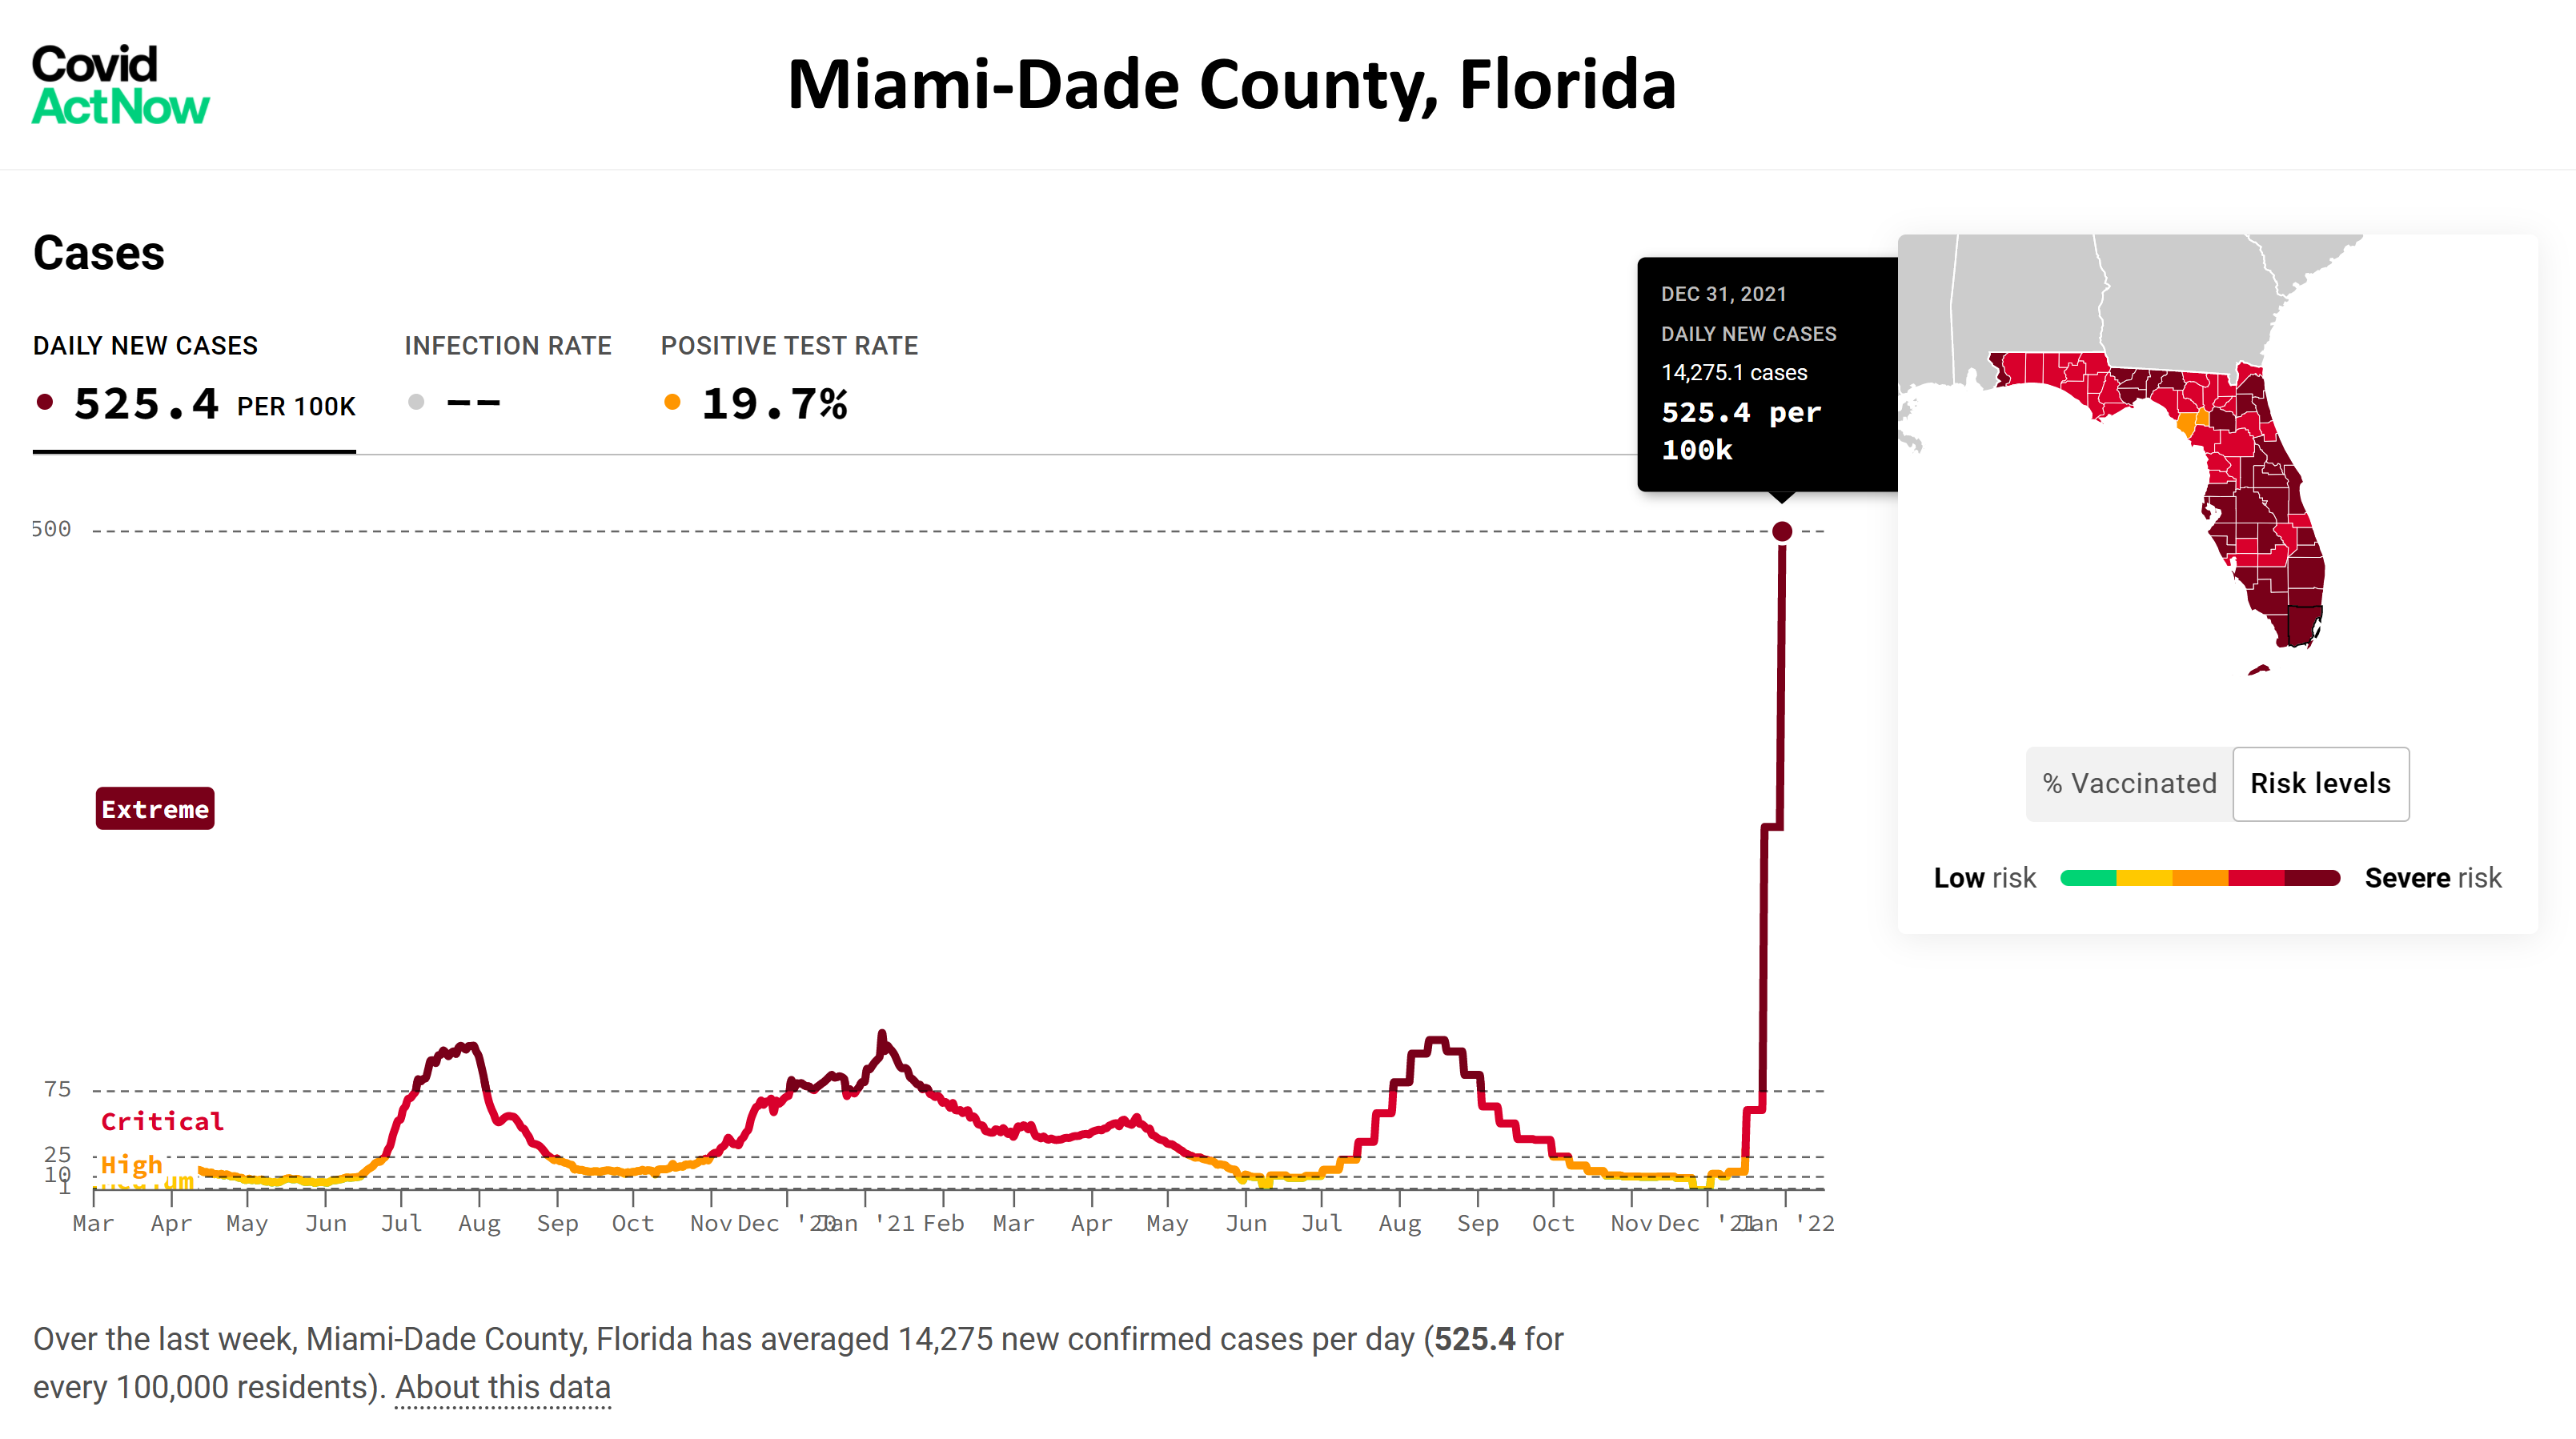
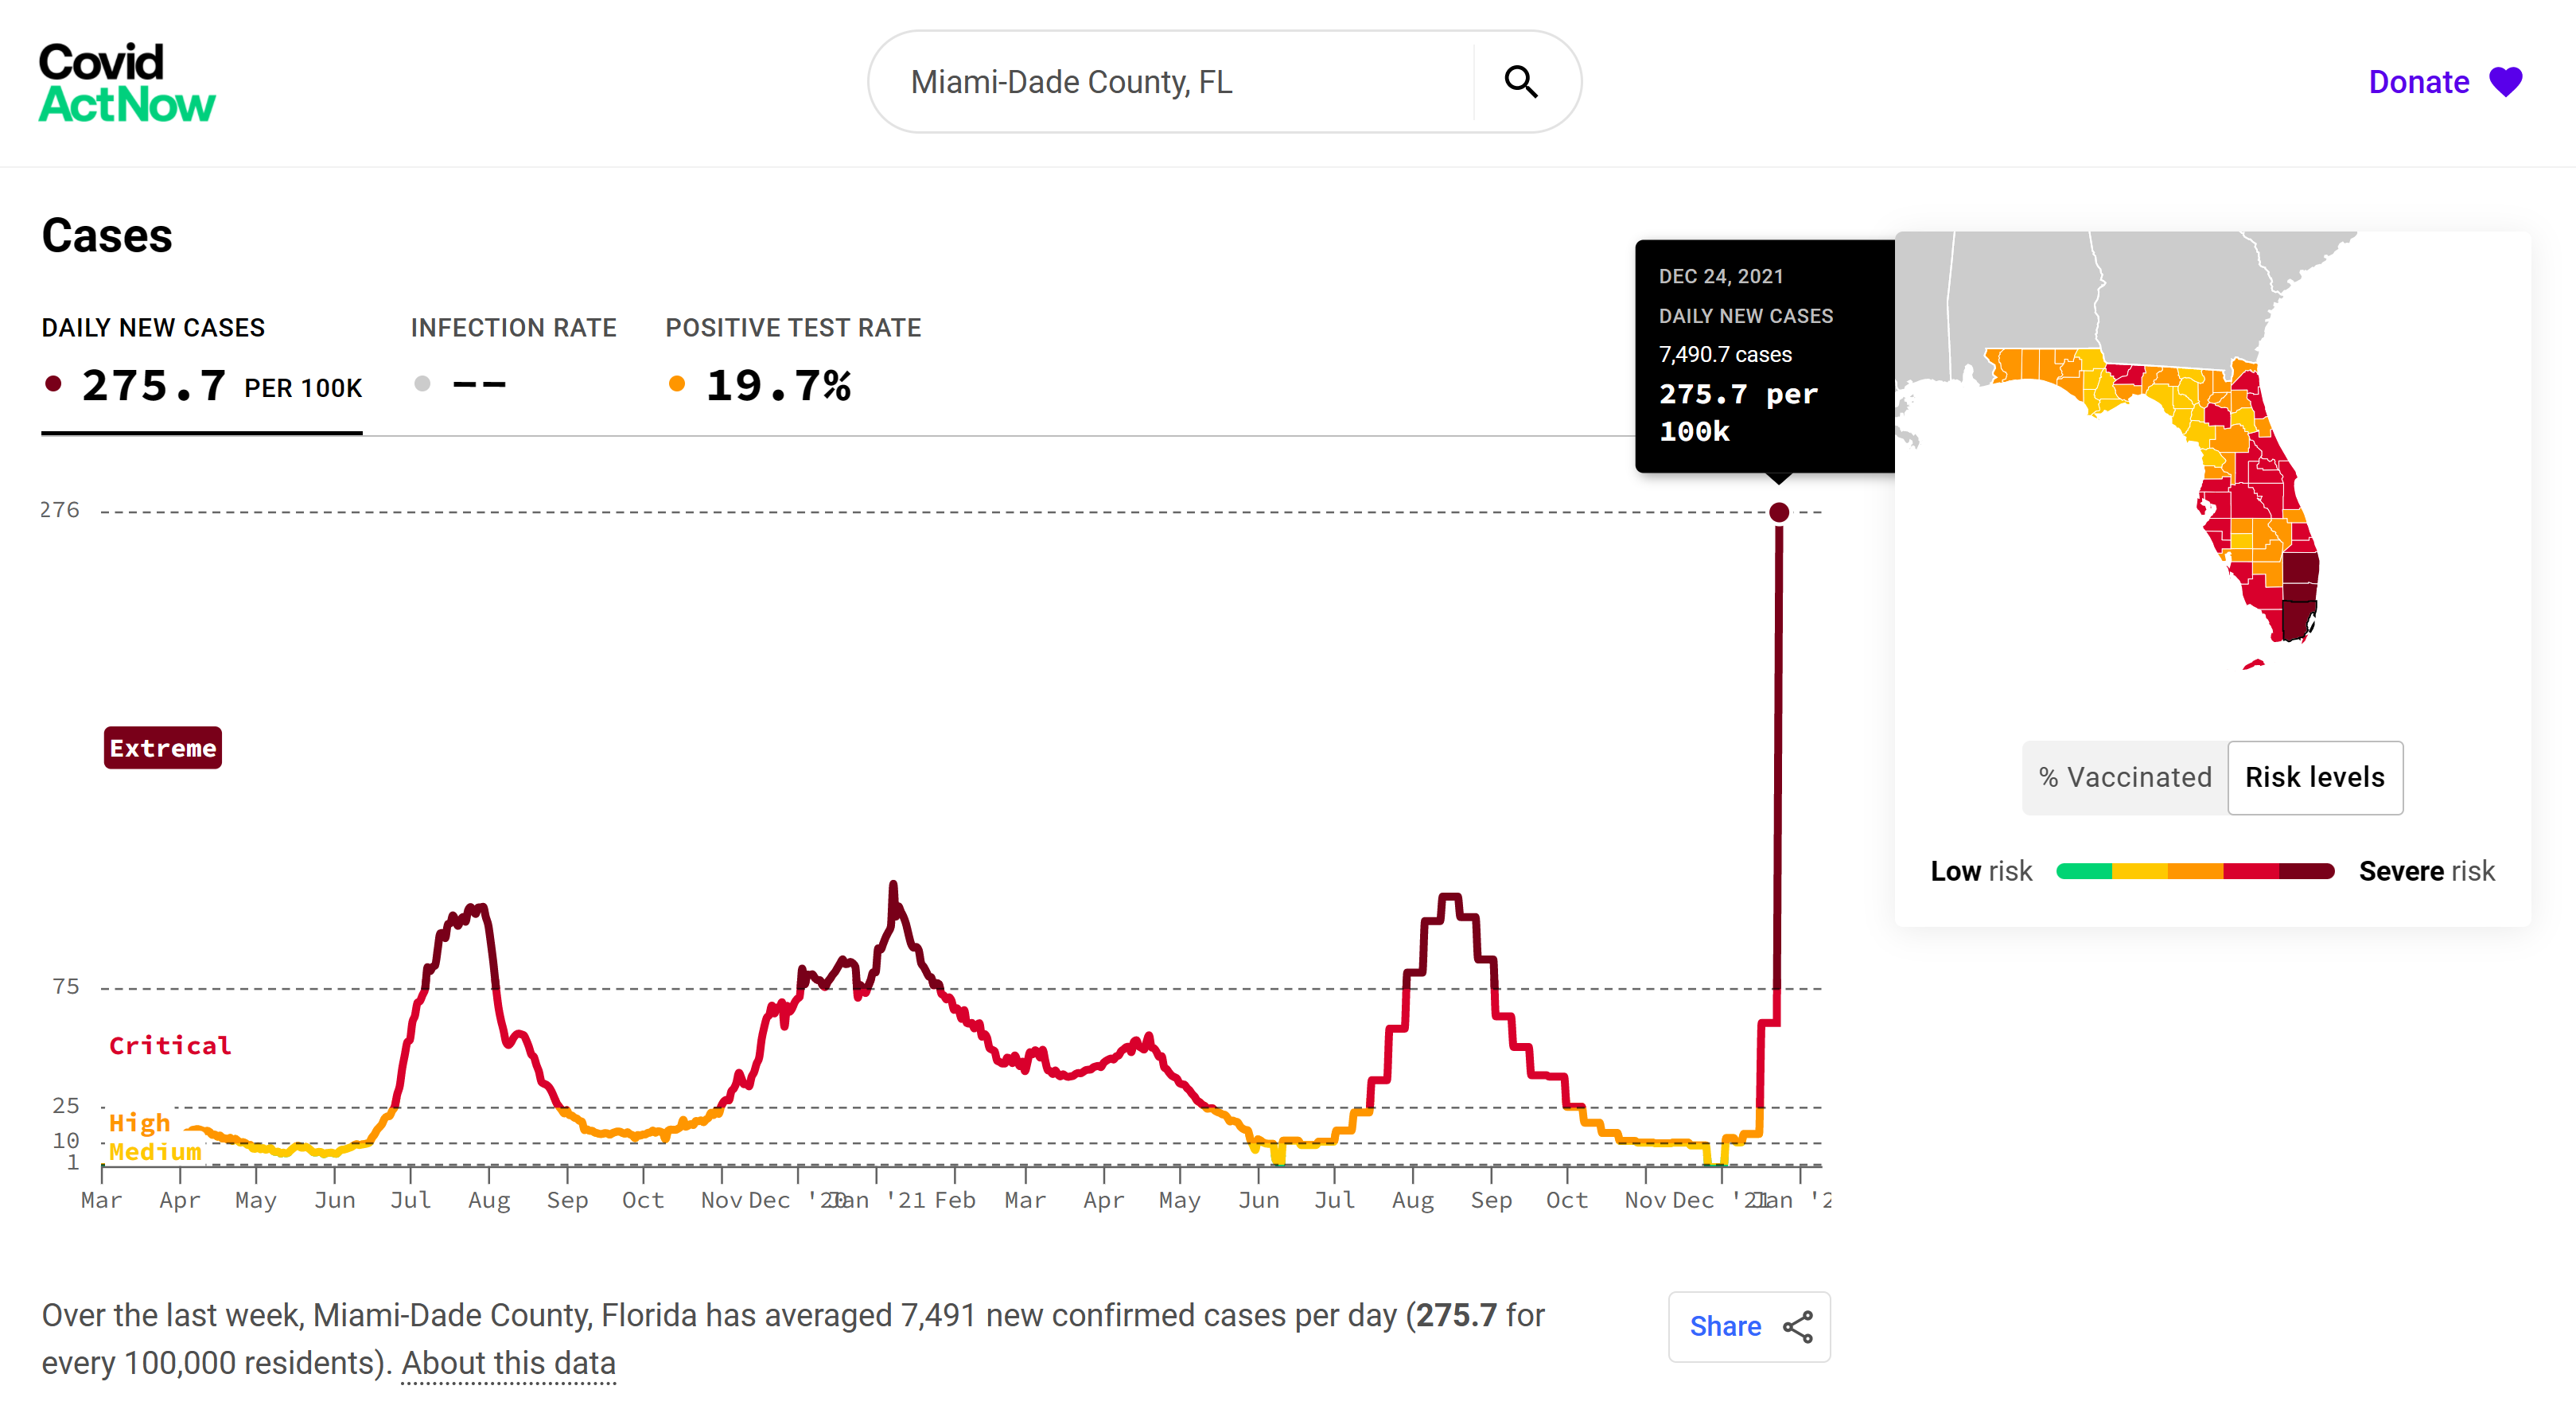
By Alexandra Villarreal 3 January 2022 (The Guardian) – Covid-19 cases in Florida have risen by 948% in just two weeks, as the highly transmissible Omicron variant drives a huge wave of infections and hospitalizations across the US. Even as Dr Anthony Fauci – Joe Biden’s top medical adviser – cautioned the public to look at hospitalizations and […]
28 December 2021 (Desdemona Despair) – Bill Gates tweeted, “Just when it seemed like life would return to normal, we could be entering the worst part of the pandemic.” In a seven-tweet thread, he went on to say that the Omicron variant “is spreading faster than any virus in history” and it “will be the […]
7 August 2021 (Desdemona Despair) – The SARS-CoV-2 (COVID-19) virus is widely understood to be the most recent virus to have jumped the species barrier to humans[1]. In this post, I propose the idea that COVID-19 is the first virus to jump the platform barrier also, from natural biology to human technology. COVID-19 exists now […]
4 August 2021 (Desdemona Despair) – Republican election strategy became clearer today, as Florida Governor Ron DeSantis blamed exponential increases in Covid infection rates on immigrants at the Southern border, deflecting blame from the unvaccinated populations in Florida and other Republican-controlled states. This ridiculous idea is easily tested by examining the spatial distribution of case […]
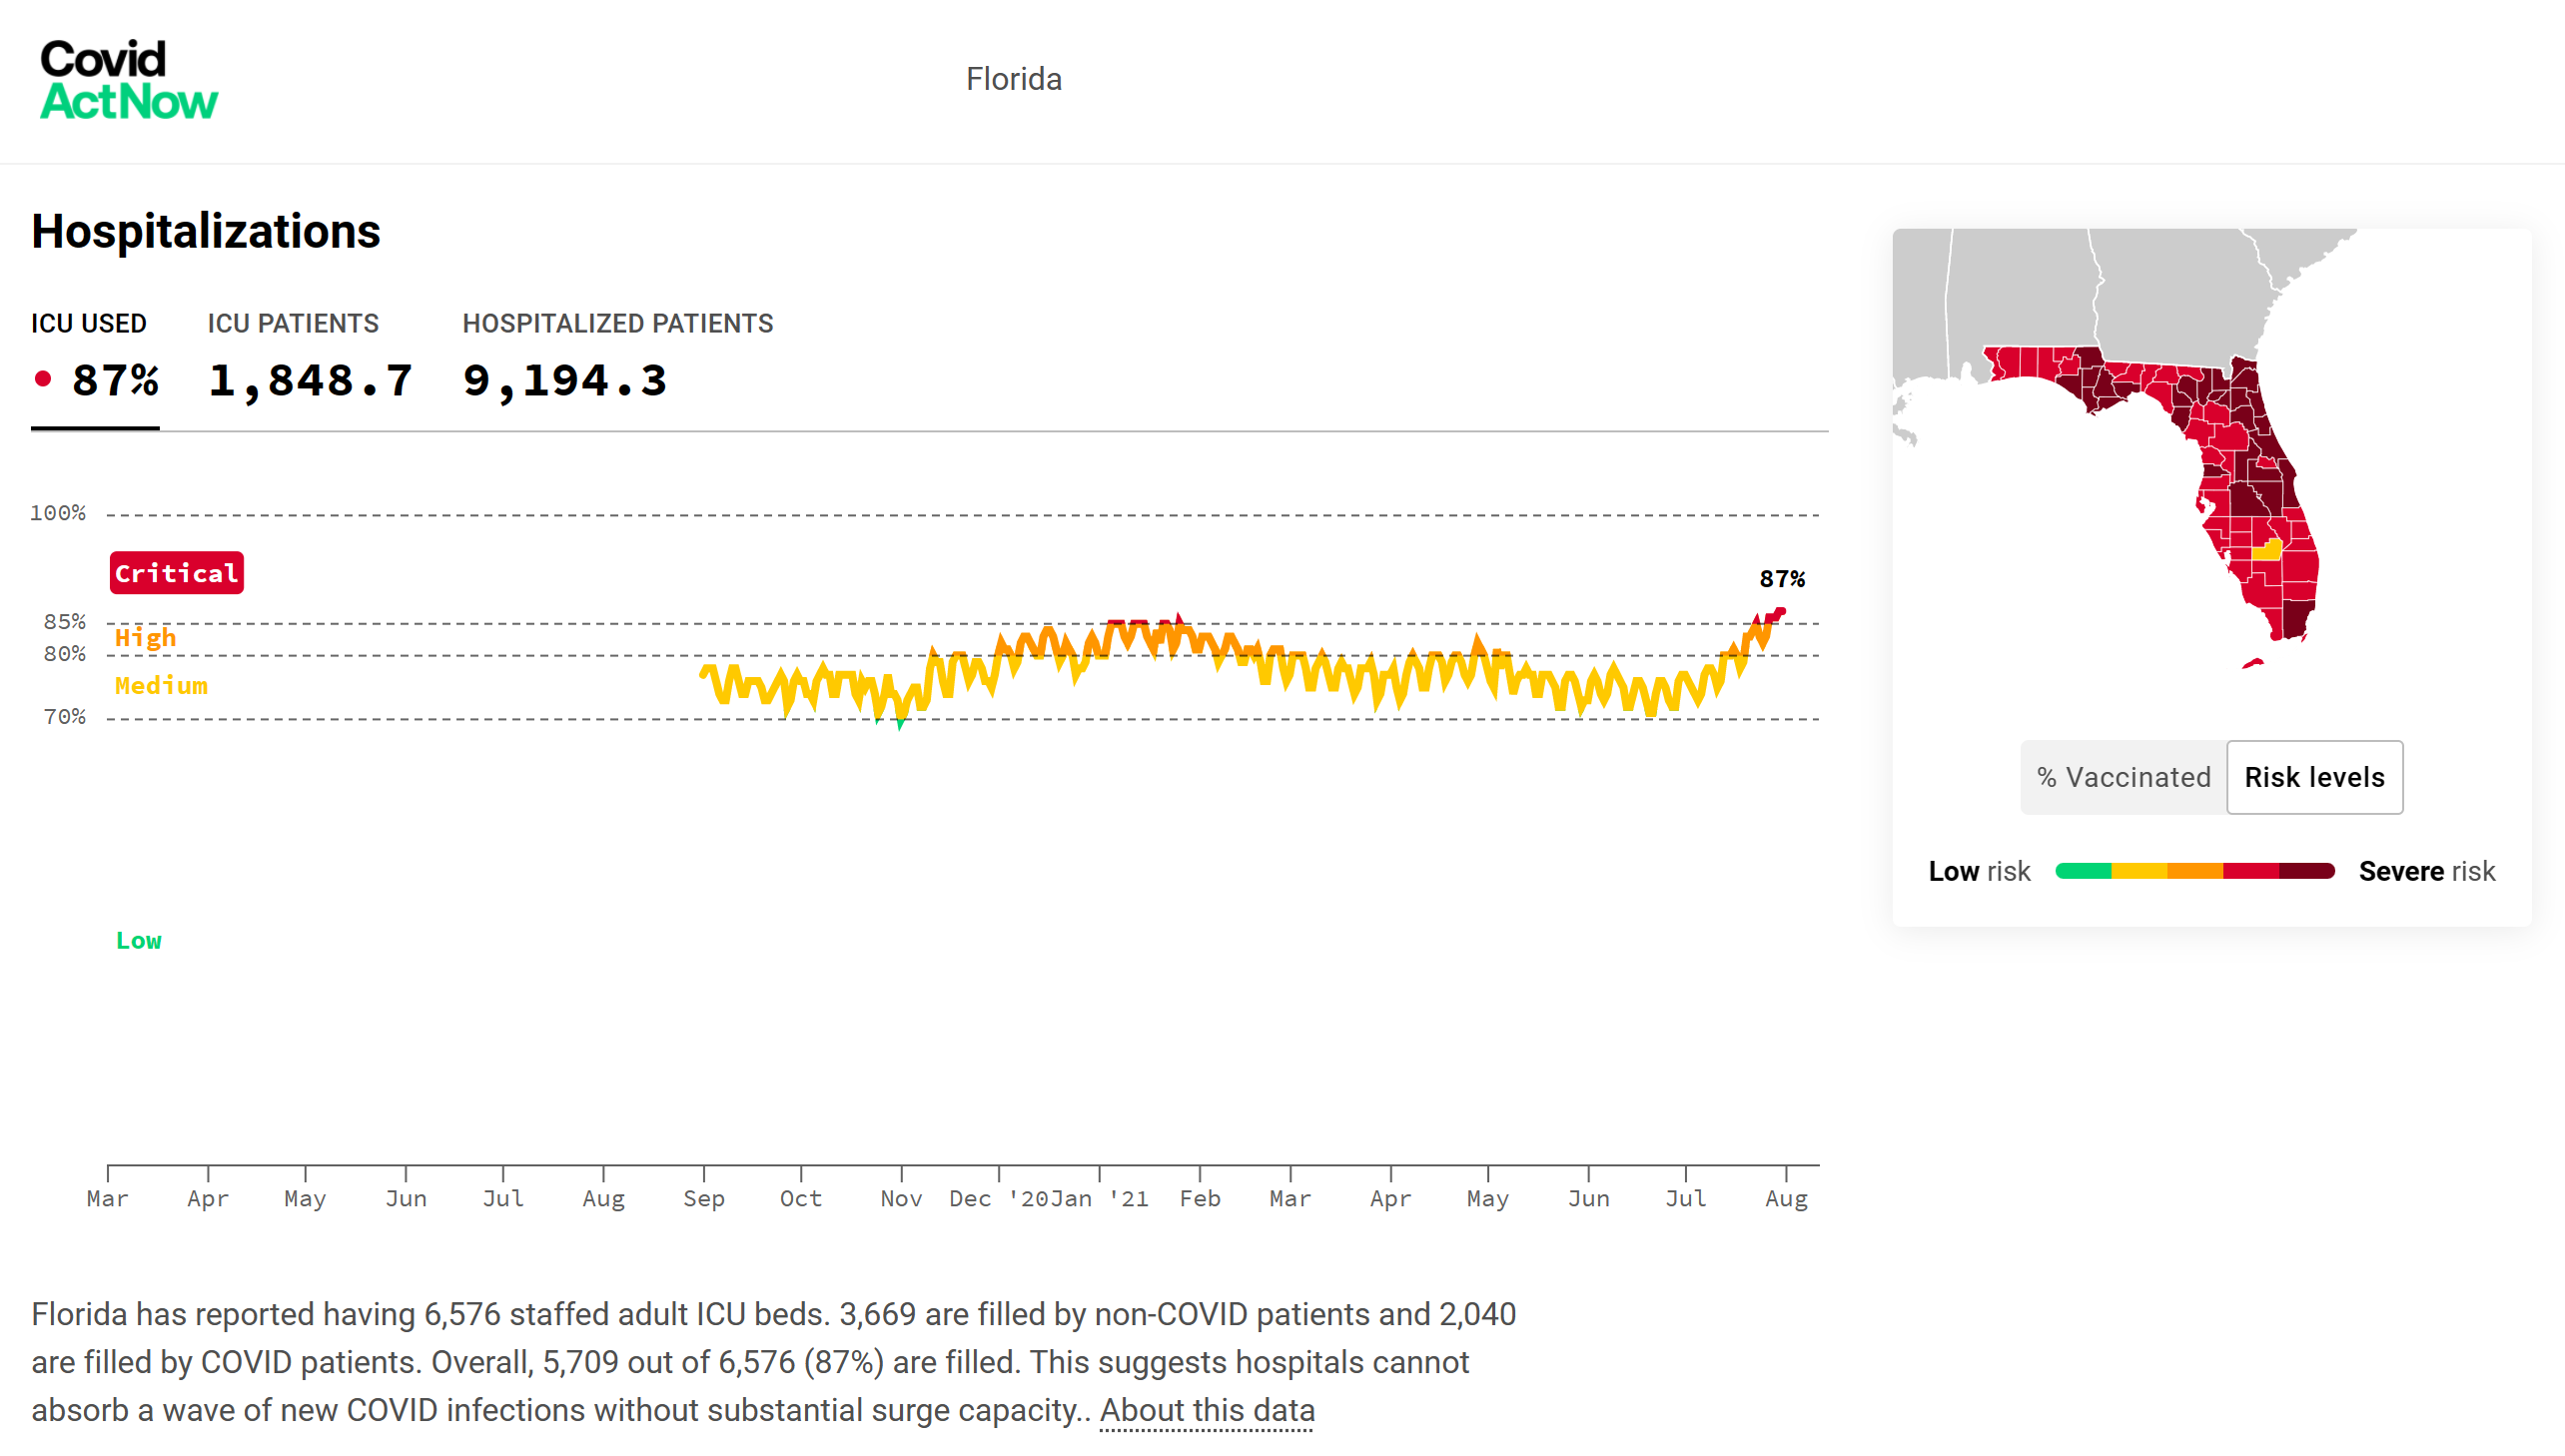
By Natalie Colarossi 1 August 2021 (Newsweek) – Florida on Sunday broke a previous record for the most COVID-19 hospitalizations in the U.S., just one day after the state registered its highest single-day COVID-19 case number. Florida now has 10,207 people hospitalized with confirmed coronavirus cases, a number that surpasses a previous record the state […]