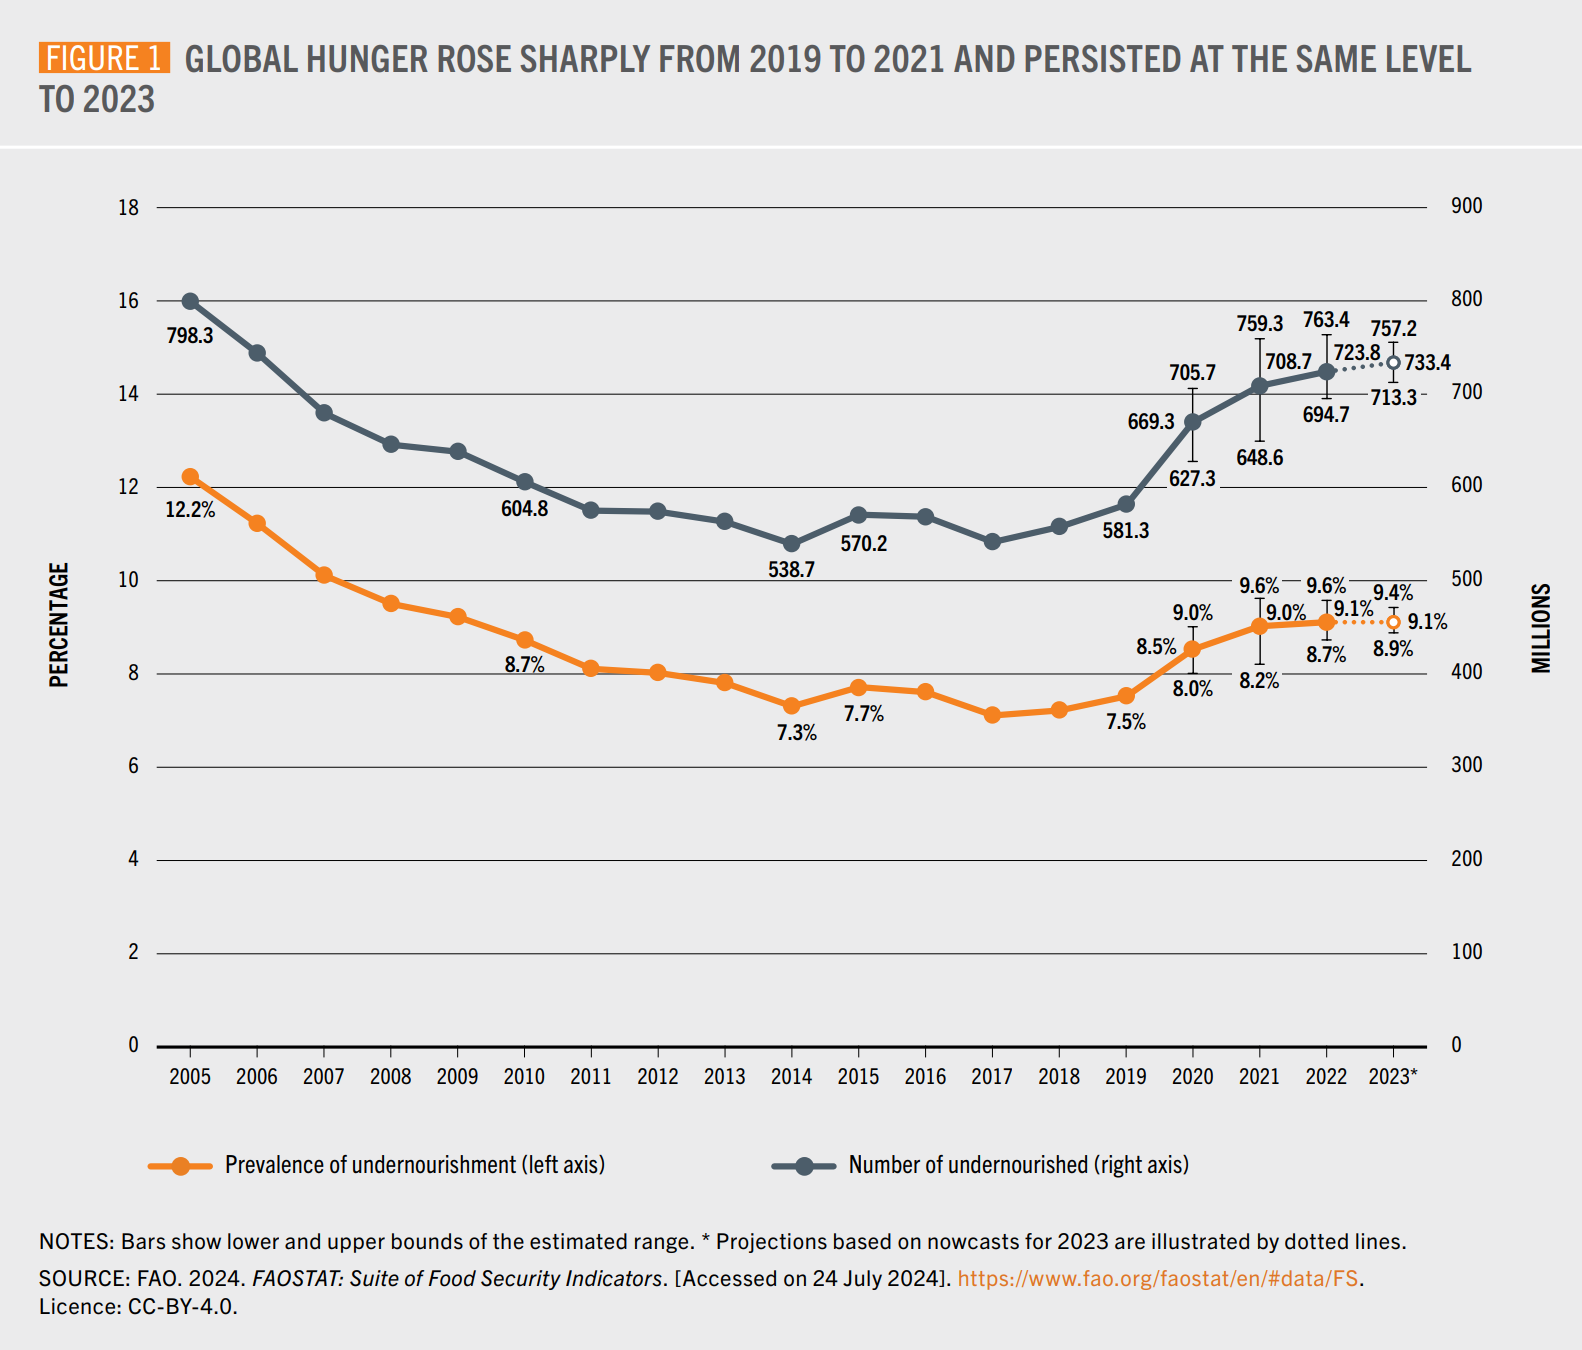
30 September 2024 (World Bank) – Domestic food price inflation remains high in many low- and middle-income countries. Inflation higher than 5 percent is experienced in 77.3 percent of low-income countries (18.2 percentage points higher since the last Update on June 27, 2024), 54.3 percent of lower-middle-income countries (8.7 percentage points lower), 44% of upper-middle-income […]
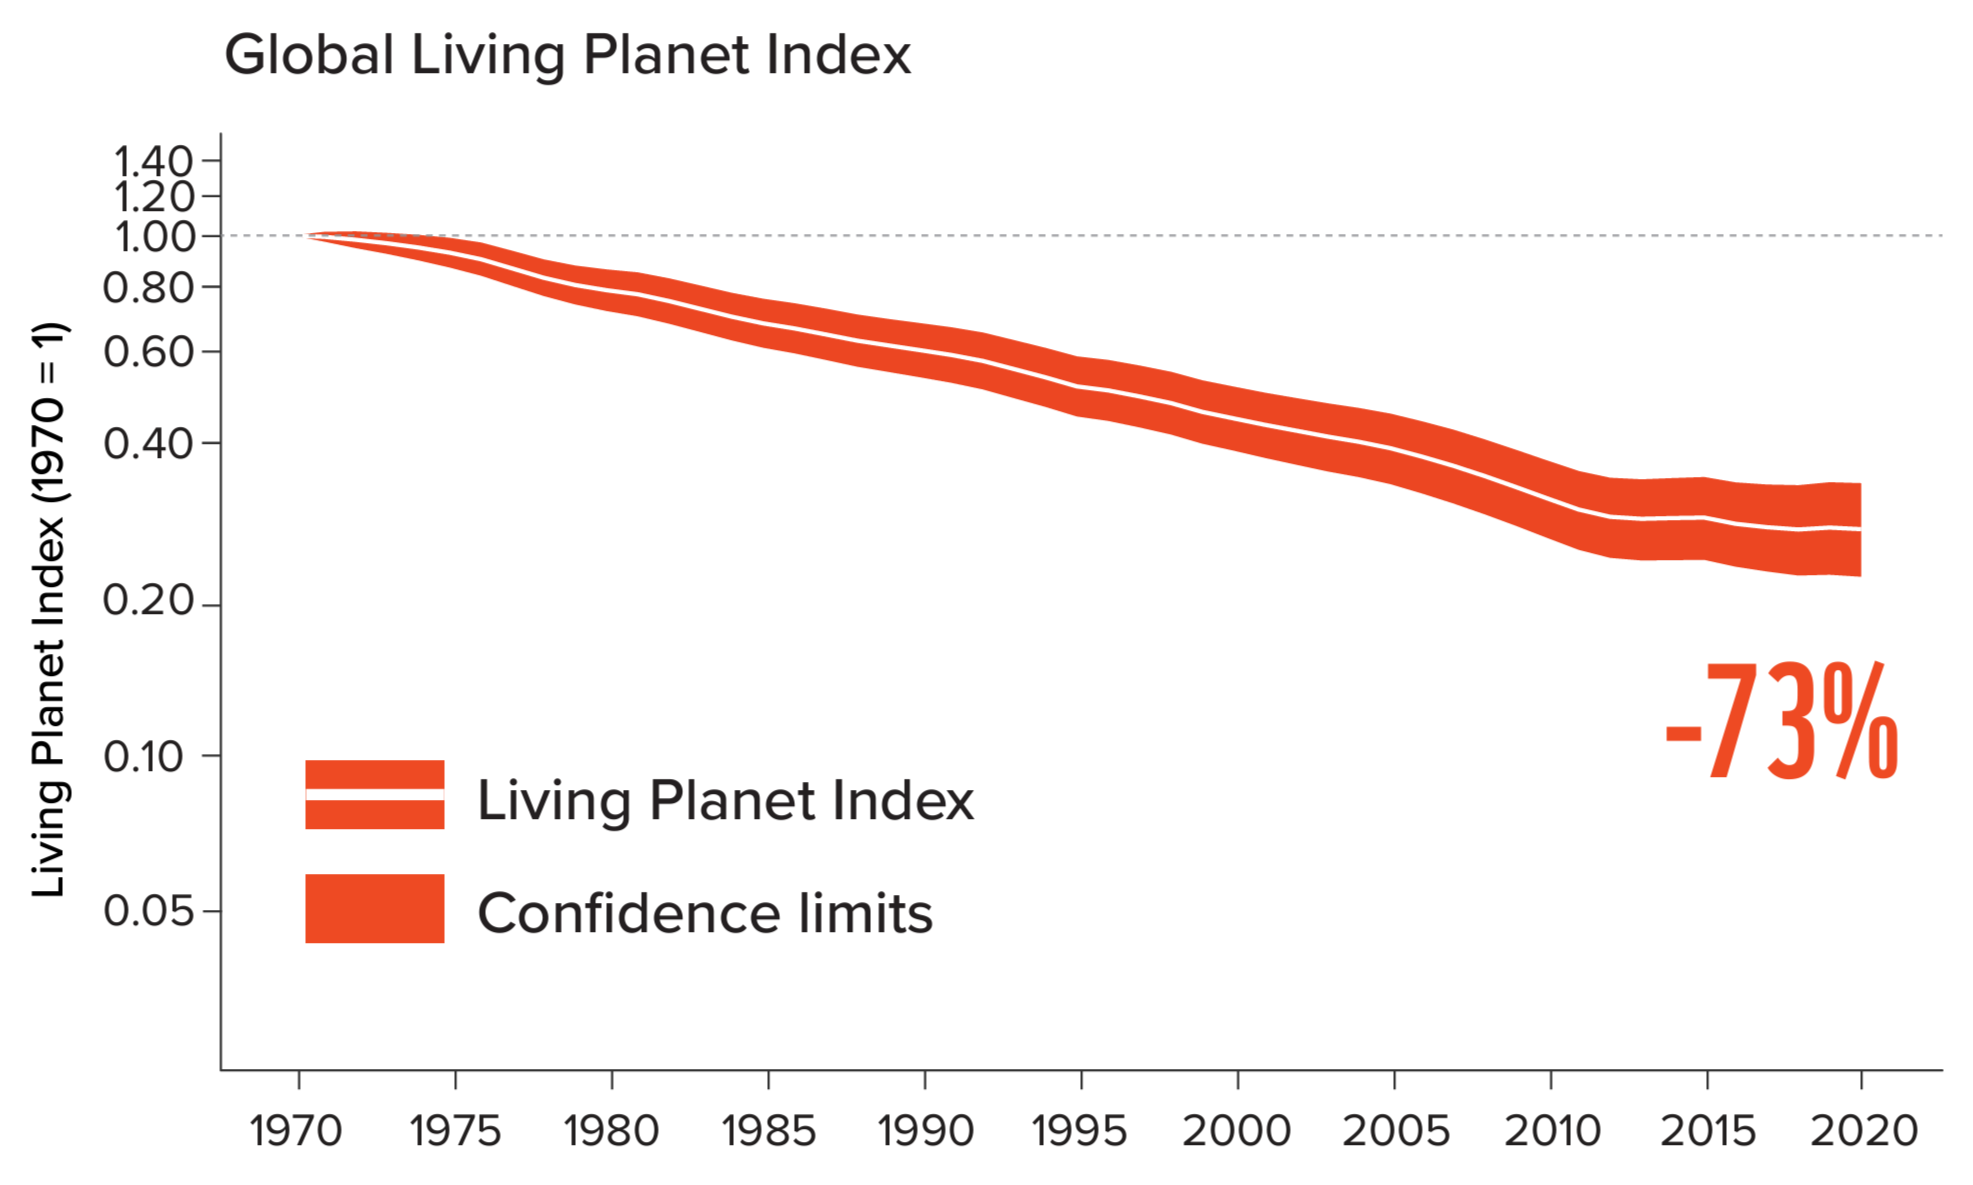
By Molly McCrea 18 October 2024 (CBS News) – A shocking new report on global biodiversity is detailing what it calls “a catastrophic decline” in wildlife populations ahead of a major international conference on biodiversity. On Monday, 21 October 2024, the United Nations will convene a two-week conference in Cali, Colombia called COP16. On the agenda […]
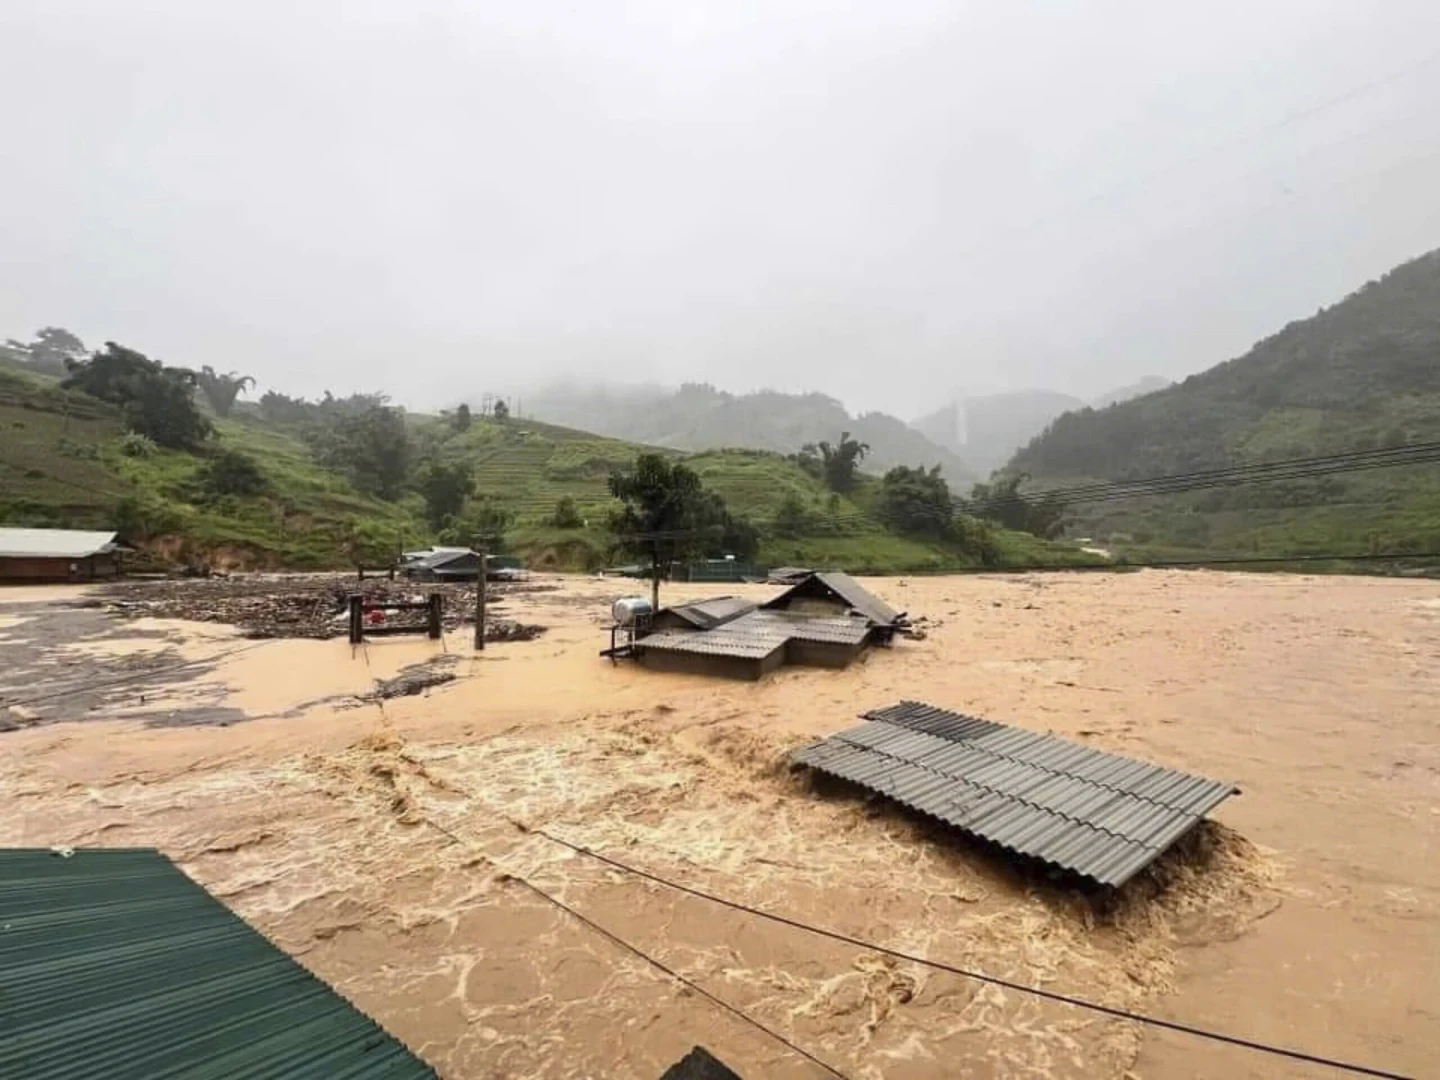
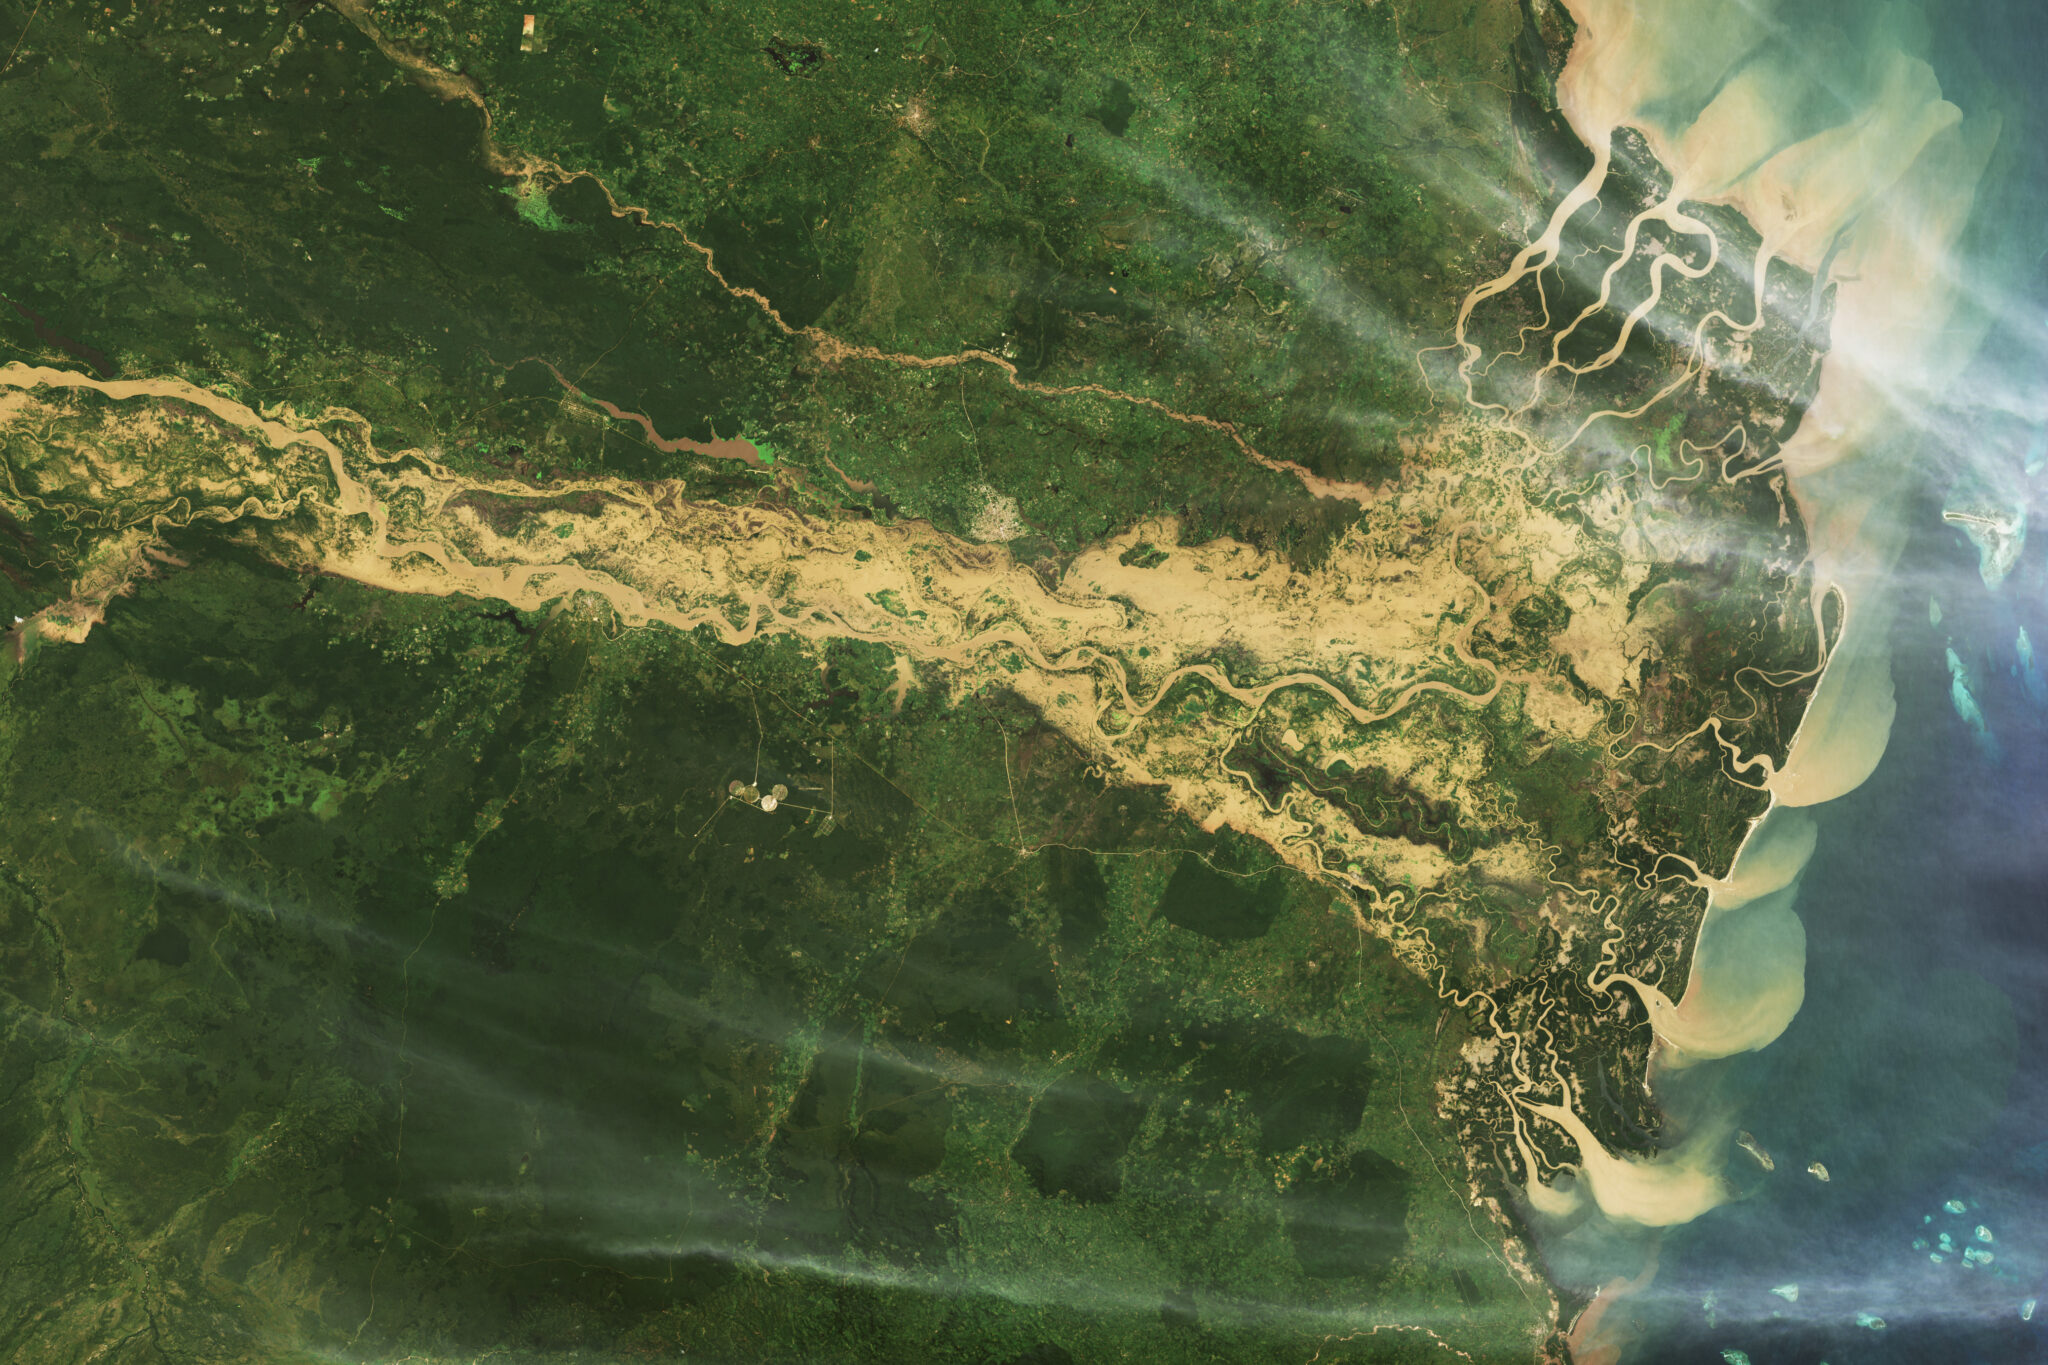
By Aniruddha Ghosal 8 September 2024 HANOI, Vietnam (AP) – At least 14 people have died and 176 others injured in Vietnam after Typhoon Yagi slammed the country’s north, state media said Sunday, as officials warned of heavy downpours despite its waning power. Described by Vietnamese officials as one of the most powerful typhoons to […]
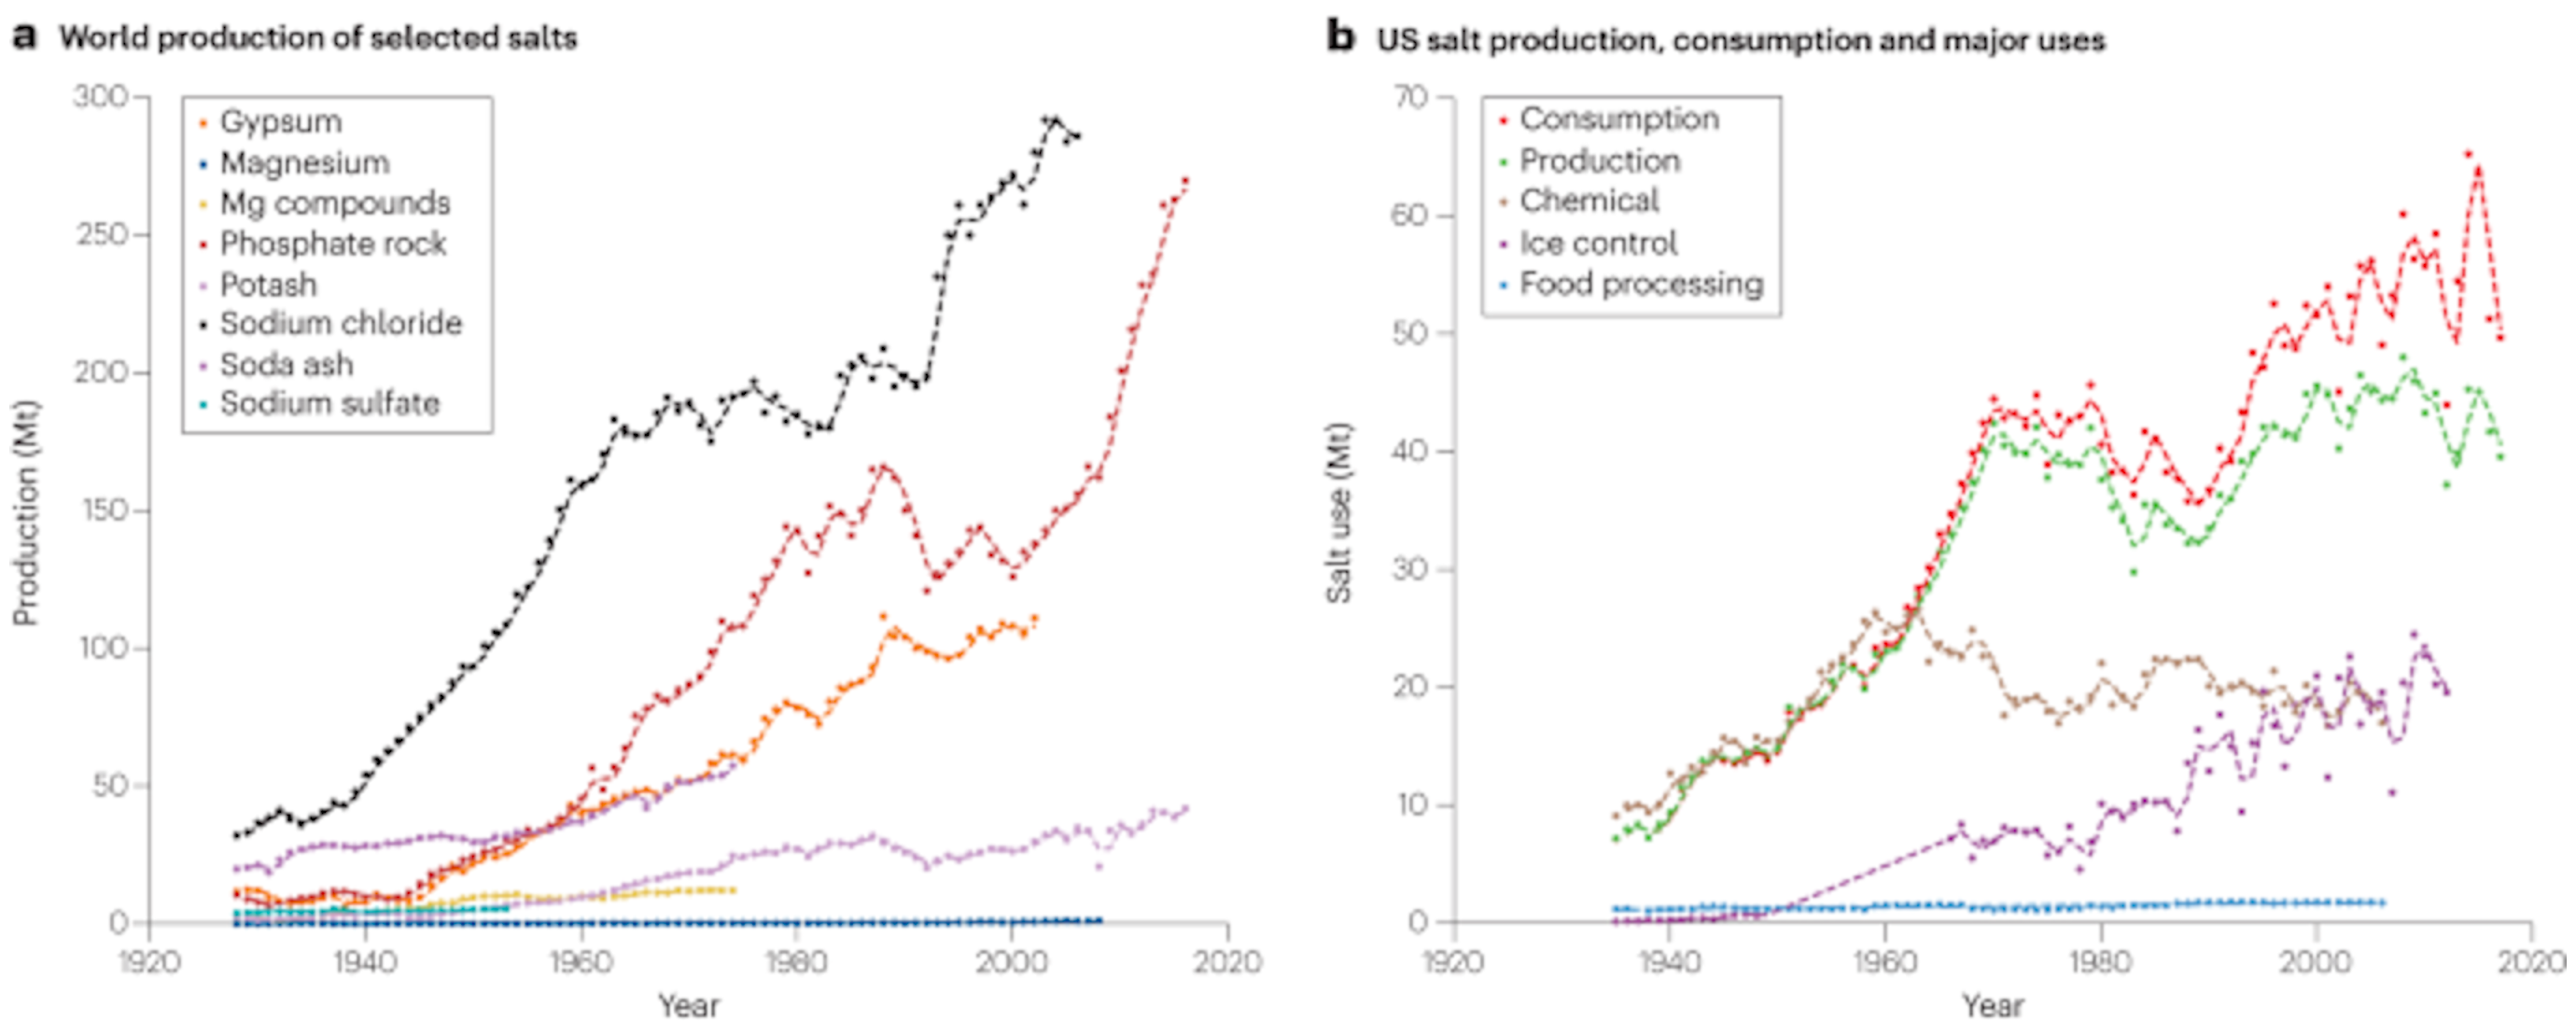
31 October 2023 (University of Maryland) – The influx of salt in streams and rivers is an ‘existential threat,’ according to a research team led by a UMD geologist. The planet’s demand for salt comes at a cost to the environment and human health, according to a new scientific review led by University of Maryland Geology Professor Sujay Kaushal. Published […]
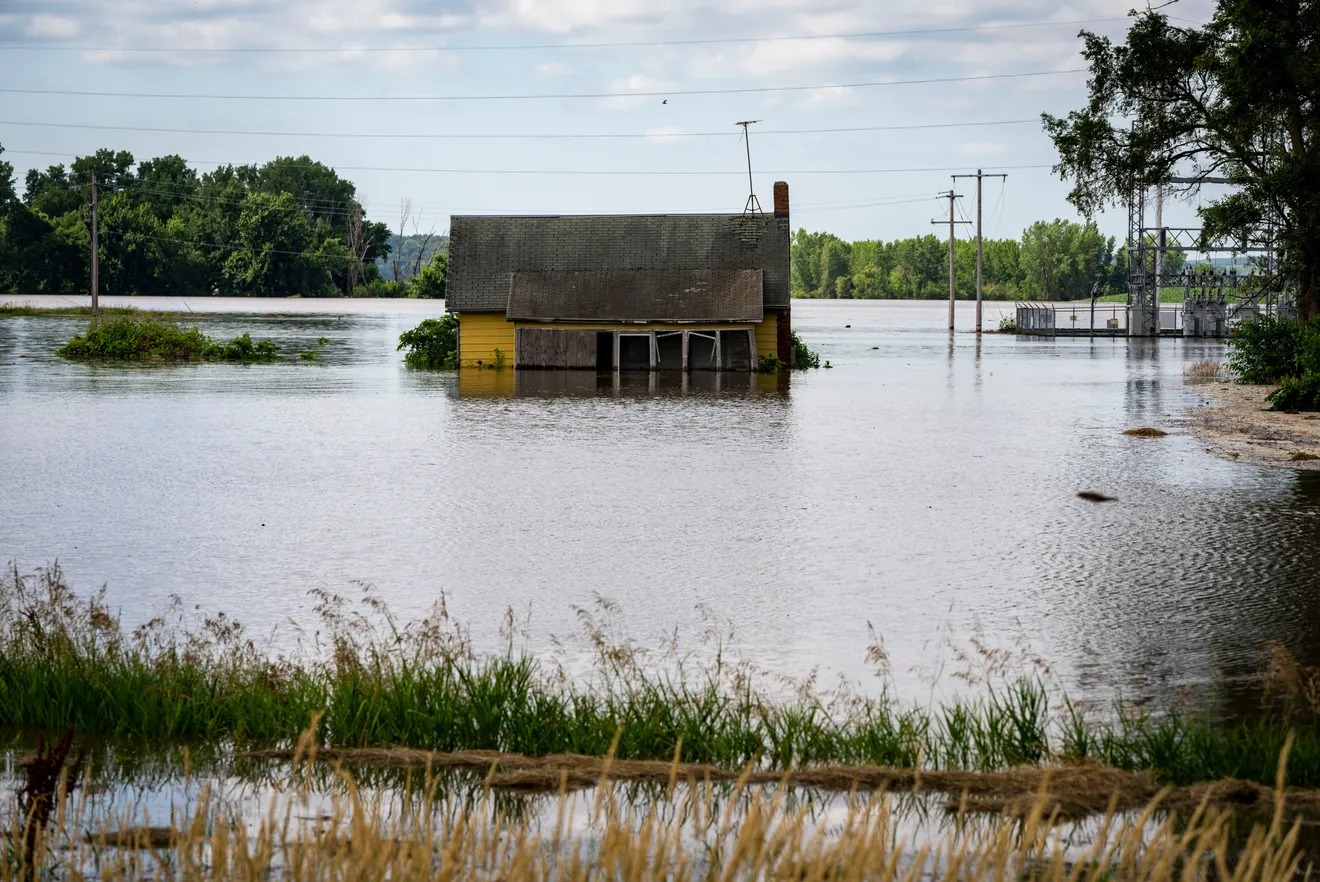
By Tyne Morgan 3 July 2024 (Farm Journal) – Portions of Iowa, South Dakota, and Nebraska are grappling with the aftermath of flooding, while continuing to fight a swollen river. The Mississippi River is facing flood threats, too. The high waters and flooding are suffocating fields, causing crop damage to key growing areas across the […]
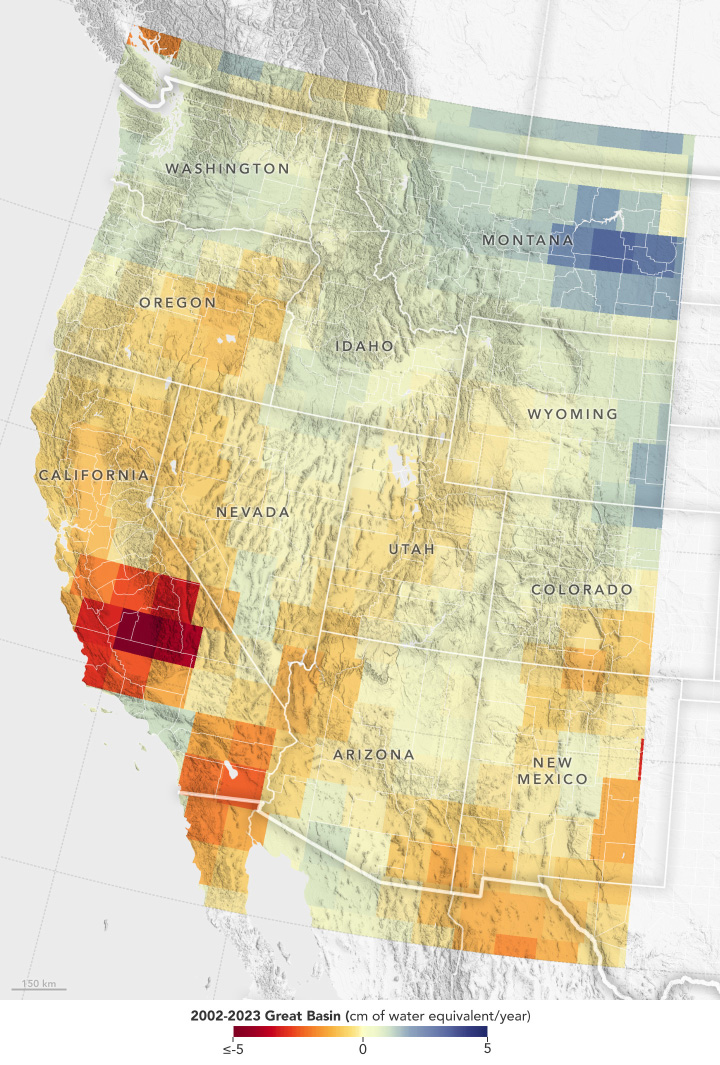
By James R. Riordon 17 June 2024 (NASA GSFC) – Record snowfall in recent years has not been enough to offset long-term drying conditions and increasing groundwater demands in the U.S. Southwest, according to a new analysis of NASA satellite data [Snowfall Replenishes Groundwater Loss in the Great Basin of the Western United States, but […]
By Carlos Mureithi 23 May 2024 NAIROBI, Kenya (AP) – The impact of the calamitous rains that struck East Africa from March to May was intensified by a mix of climate change and rapid growth of urban areas, an international team of climate scientists said in a study published Friday. The findings come from World Weather Attribution, […]
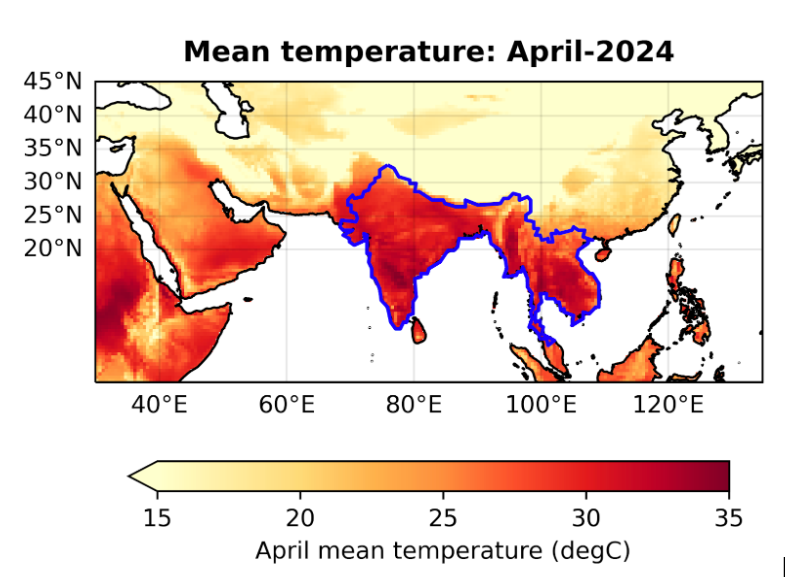
By Sibi Arasu 14 May 2024 BENGALURU, India (AP) – Sizzling heat across Asia and the Middle East in late April that echoed last year’s destructive swelter was made 45 times more likely in some parts of the continent because of human-caused climate change, a study Tuesday found. Scorching temperatures were felt across large swaths of Asia, […]
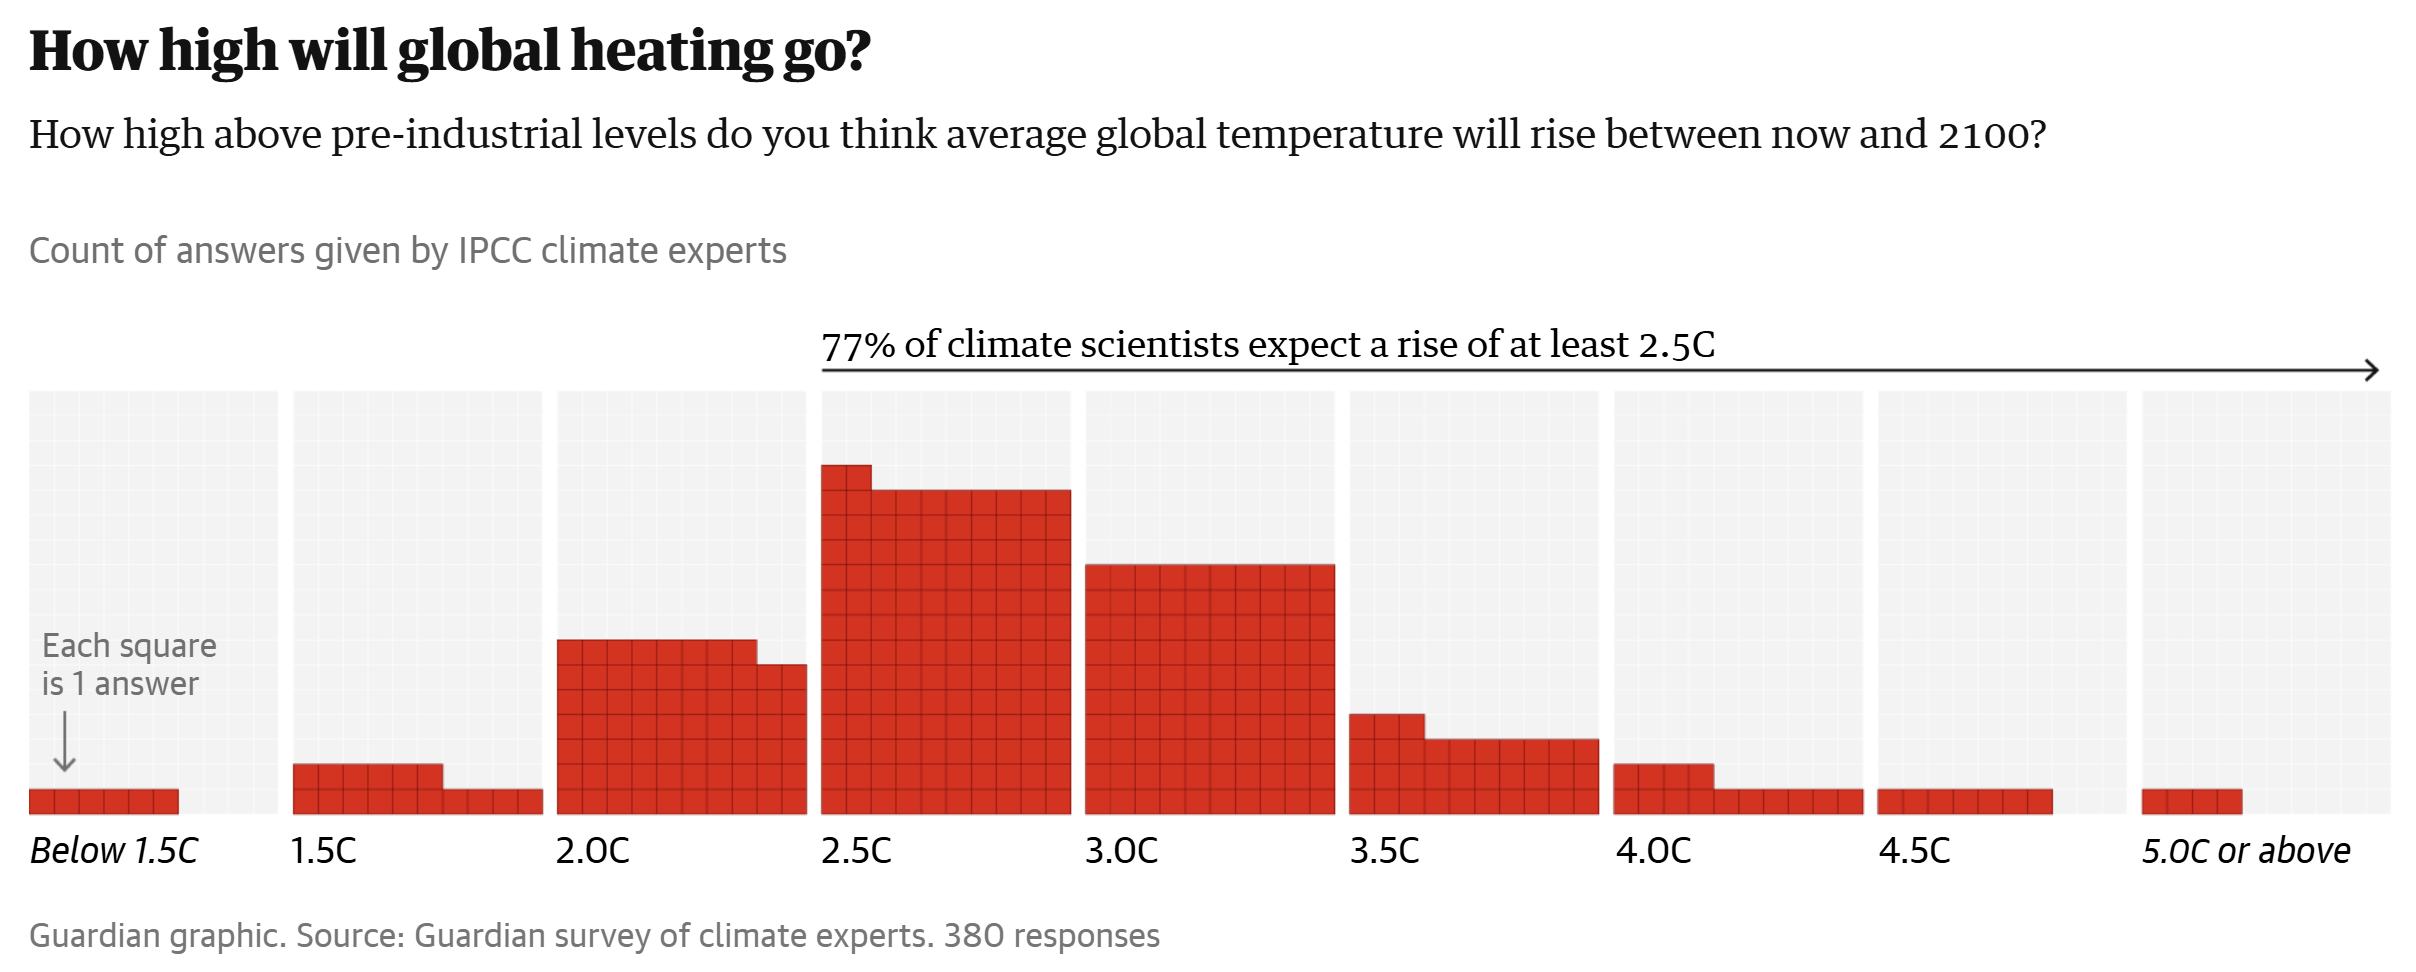
By Damian Carrington 8 May 2024 (The Guardian) – Hundreds of the world’s leading climate scientists expect global temperatures to rise to at least 2.5C (4.5F) above preindustrial levels this century, blasting past internationally agreed targets and causing catastrophic consequences for humanity and the planet, an exclusive Guardian survey has revealed. Almost 80% of the […]
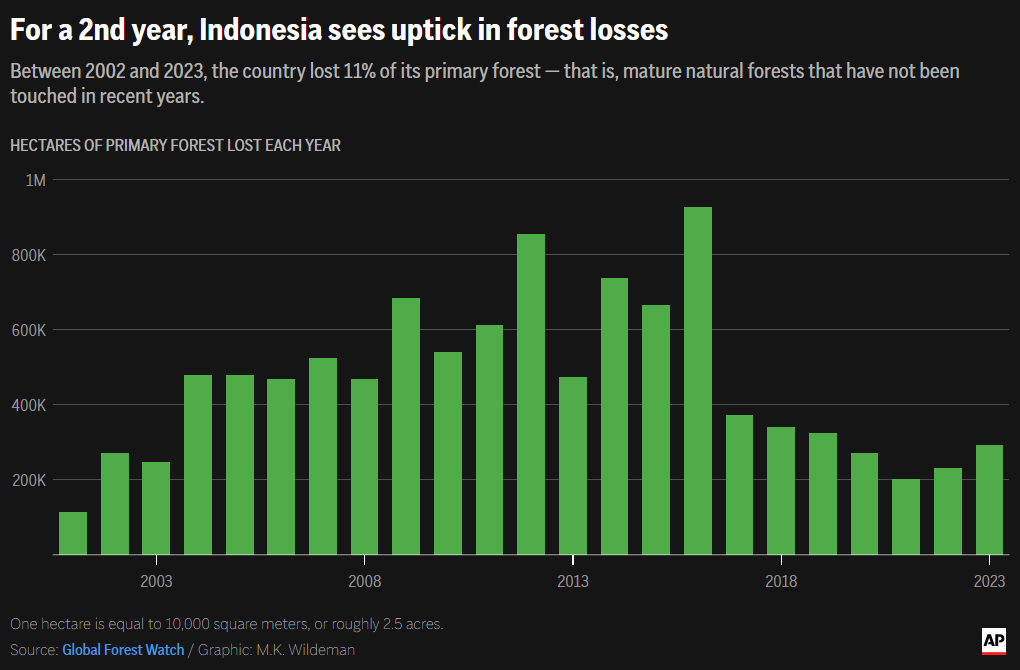
By Victoria Milko 28 April 2024 JAKARTA, Indonesia (AP) – From trees felled in protected national parks to massive swaths of jungle razed for palm oil and paper plantations, Indonesia had a 27% uptick in primary forest loss in 2023 from the previous year, according to a World Resources Institute analysis of deforestation data. But […]