7 November 2024 (Desdemona Despair) – My work here is done. After more than 13,000 posts warning of the end of the Phanerozoic eon and the imminent extinction of the human species, I’m calling it quits. The first Desdemona blog post was on 14 November 2008 and was titled, Rising CO2 accelerates coral bleaching: study. […]
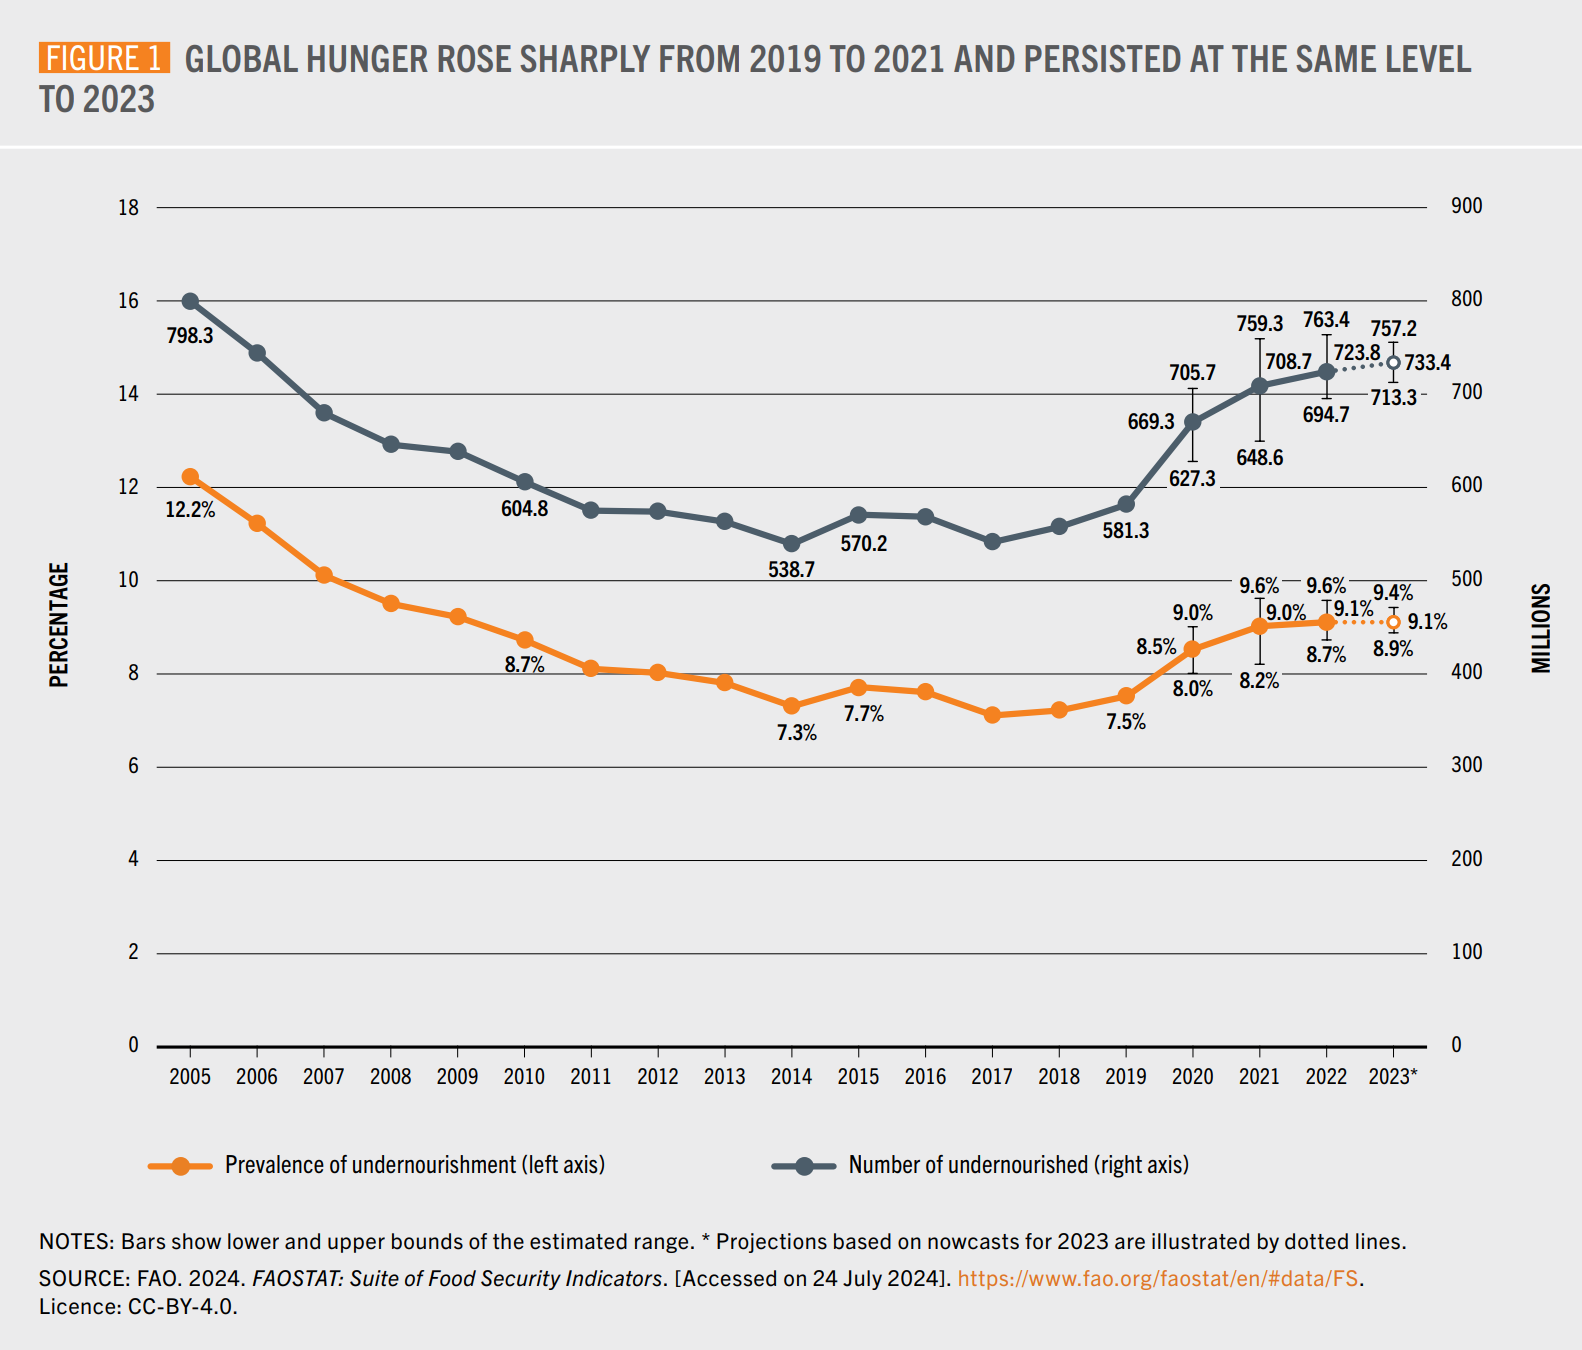
30 September 2024 (World Bank) – Domestic food price inflation remains high in many low- and middle-income countries. Inflation higher than 5 percent is experienced in 77.3 percent of low-income countries (18.2 percentage points higher since the last Update on June 27, 2024), 54.3 percent of lower-middle-income countries (8.7 percentage points lower), 44% of upper-middle-income […]
By Molly McCrea 18 October 2024 (CBS News) – A shocking new report on global biodiversity is detailing what it calls “a catastrophic decline” in wildlife populations ahead of a major international conference on biodiversity. On Monday, 21 October 2024, the United Nations will convene a two-week conference in Cali, Colombia called COP16. On the agenda […]
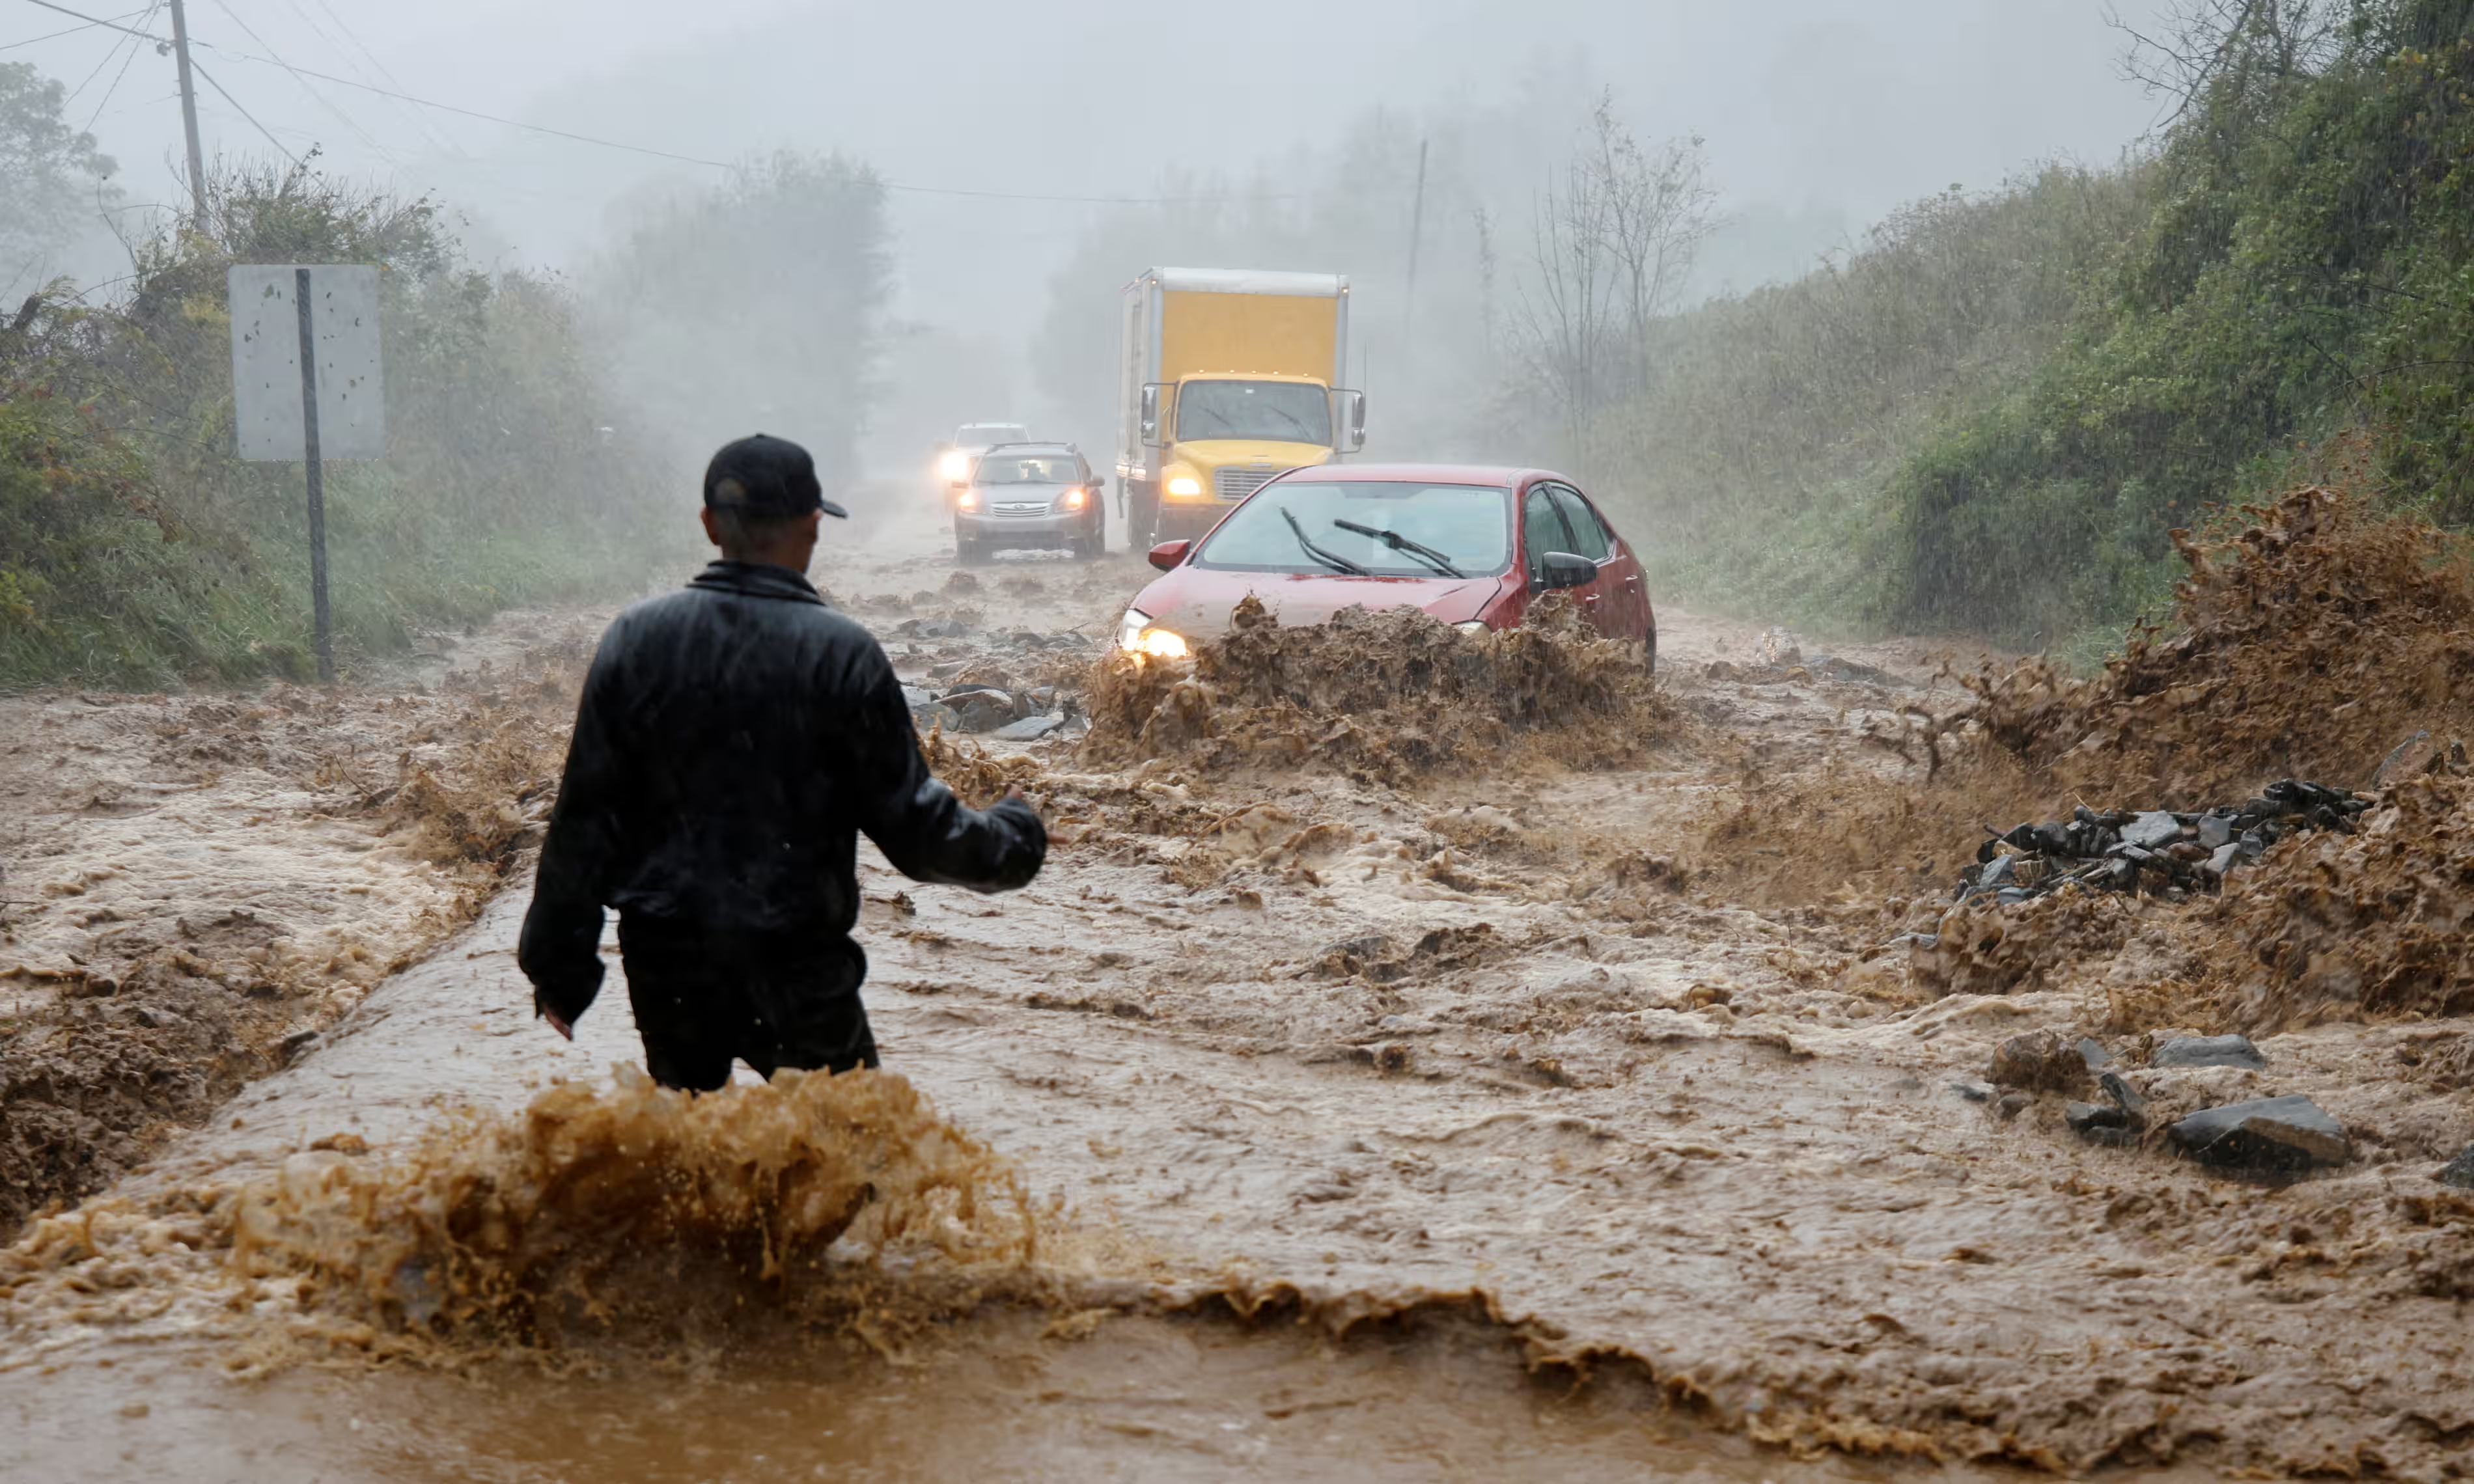
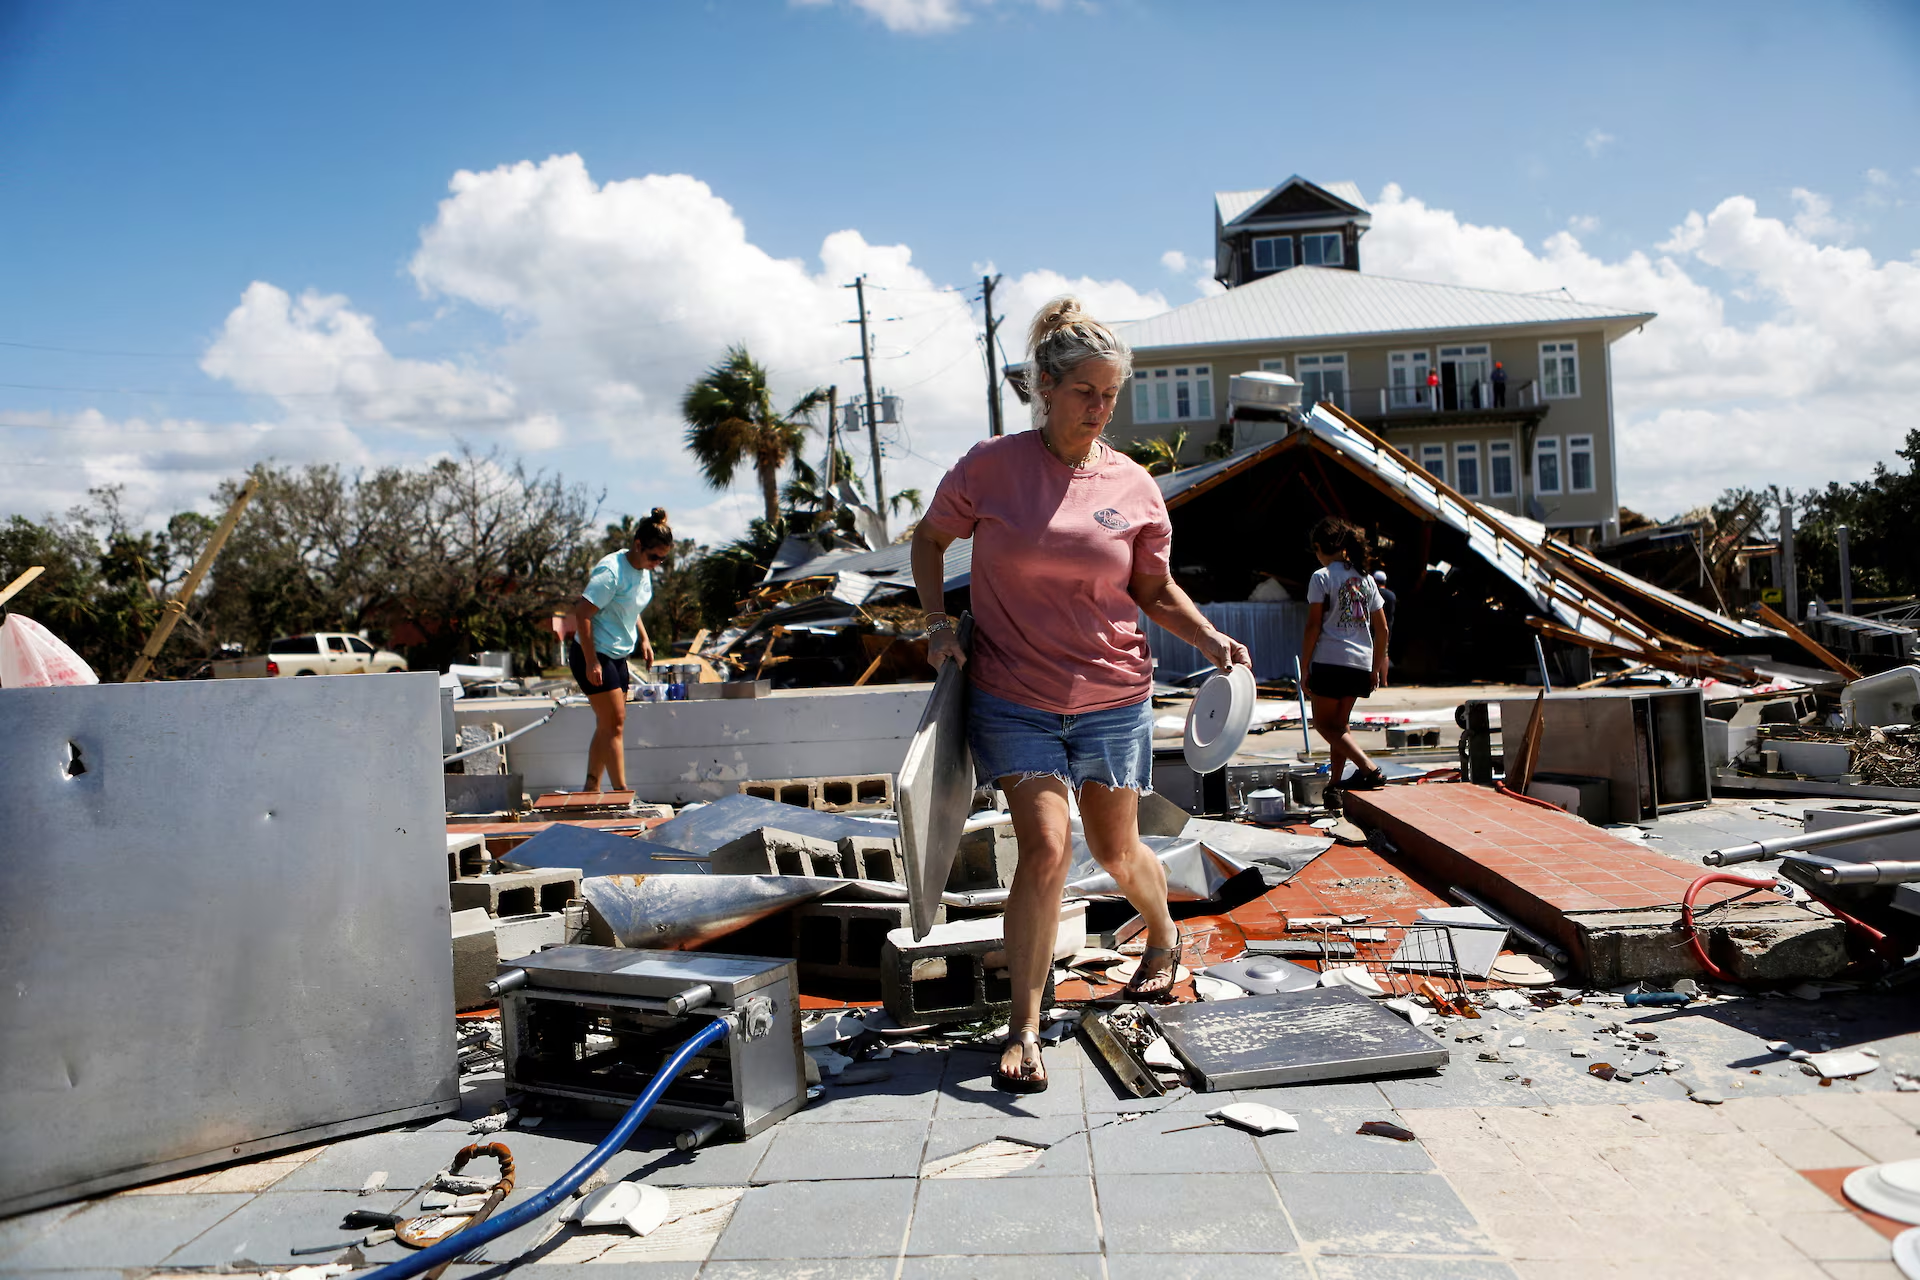
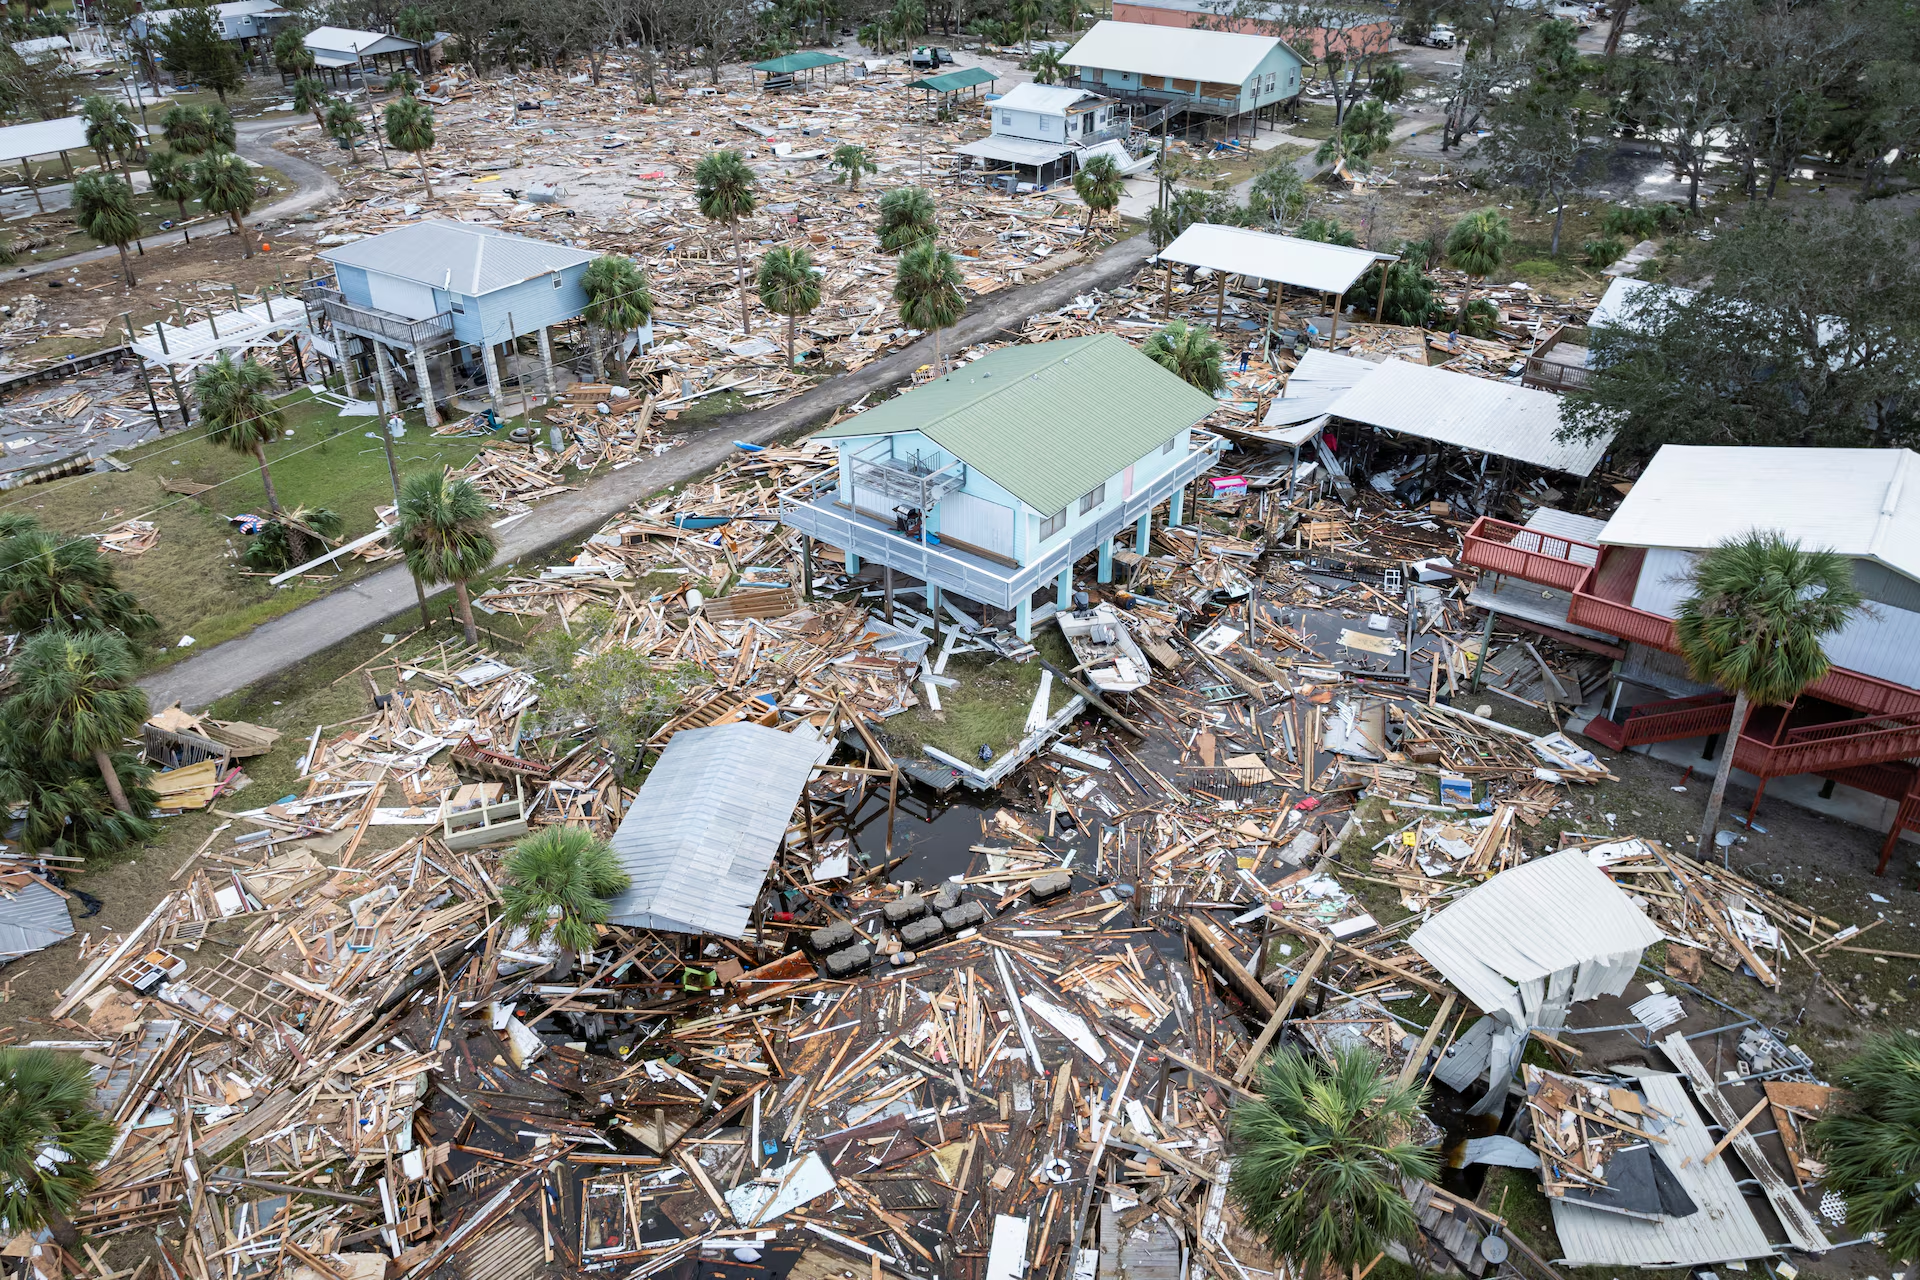
By Bill McKibben 9 October 2024 (The Guardian) – Even as the good people of Florida’s west coast pulled the soggy mattresses from Helene out to the curb, Milton appeared on the horizon this week – a double blast of destruction from the Gulf of Mexico that’s a reminder that physics takes no time off, not even in the […]
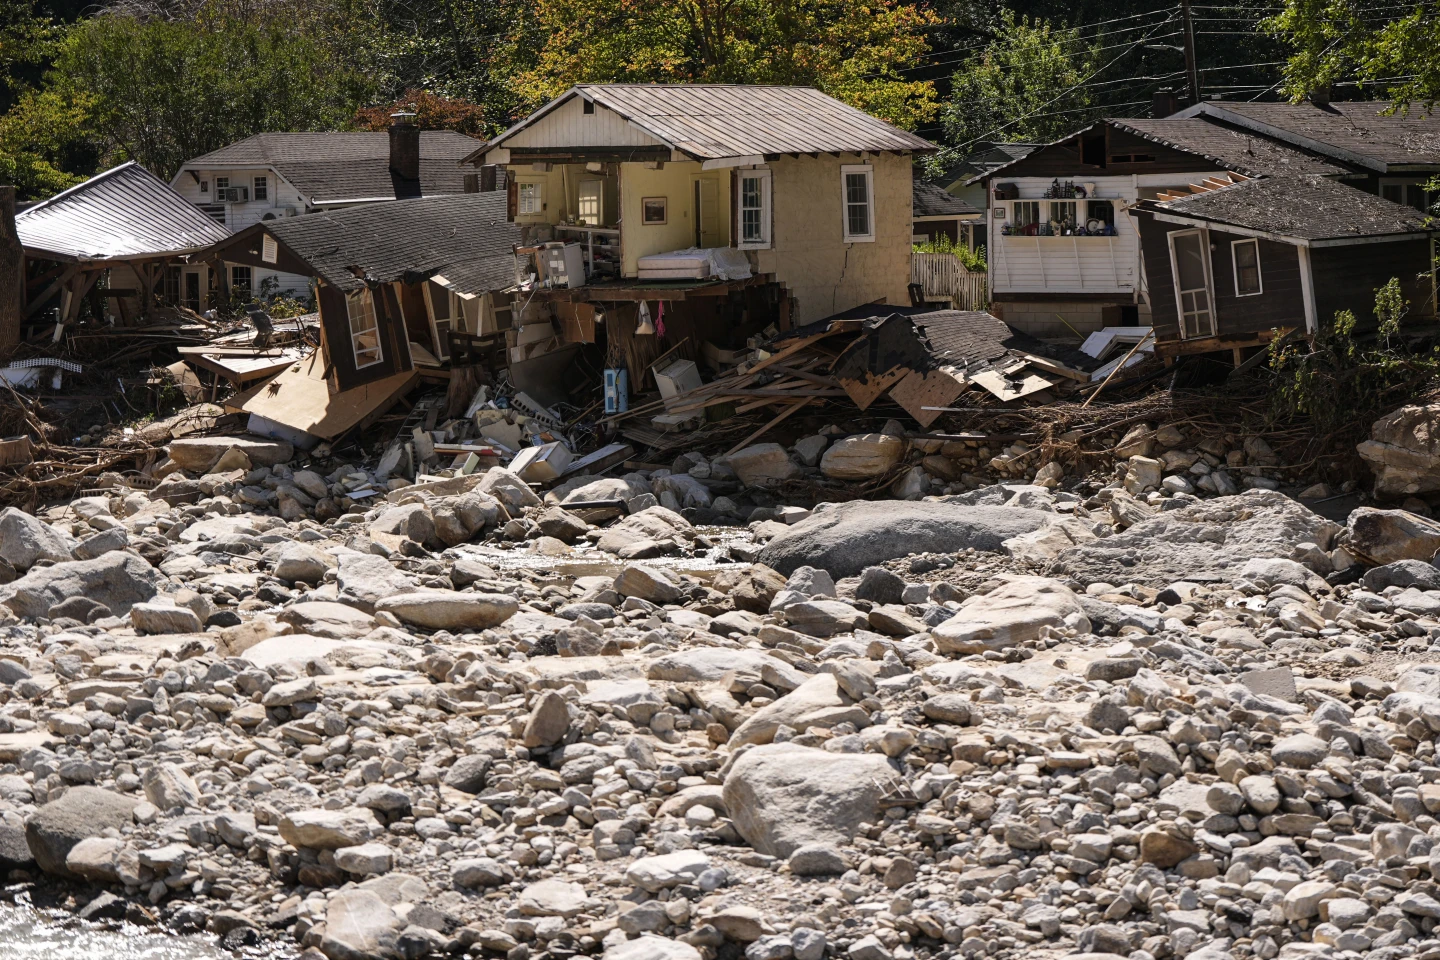
By Melissa Hanson 4 October 2024 (Scientific American) – I wasn’t prepared to be a climate refugee. Not after relocating my family from drought and wildfire-prone California to the “climate haven” of Asheville, N.C. But less than two months after we moved into our delightfully wooded, mild-weather community, we were forced to leave. Even before […]
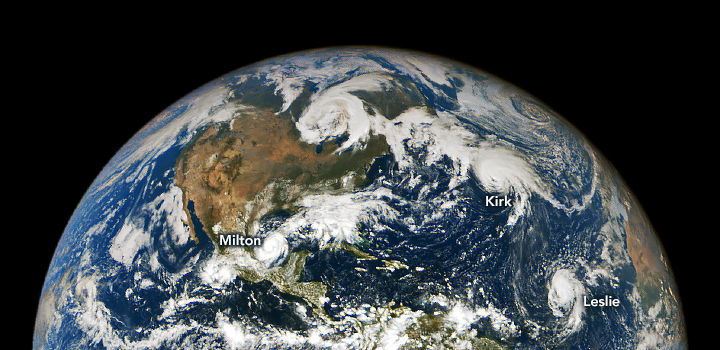
By Emily Cassidy 8 October 2024 (NASA Earth Observatory) – From the stable Lagrange point 1, located one million miles above Earth, NASA’s EPIC (Earth Polychromatic Imaging Camera) imager on the DSCOVR (Deep Space Climate Observatory) satellite observed an unusually active Atlantic Basin. In early October, three hurricanes simultaneously spun over the North Atlantic Ocean. This image shows the three […]
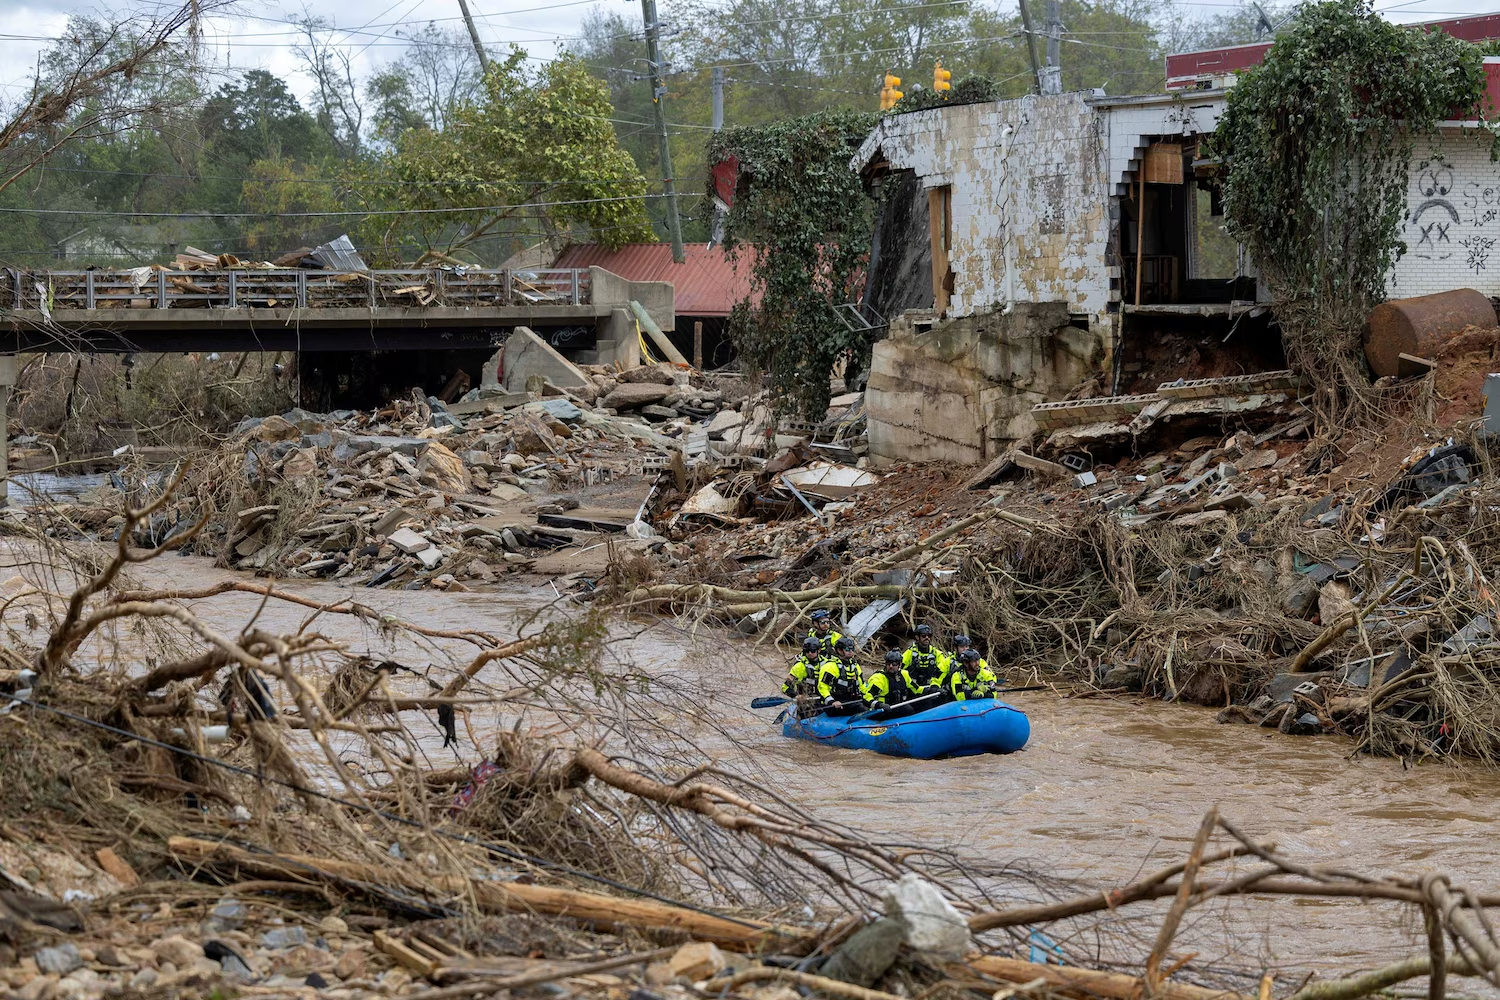
By Sally Ho 5 October 2024 (AP) – A week after Hurricane Helene overwhelmed the Southeastern U.S., homeowners hit the hardest are grappling with how they could possibly pay for the flood damage from one of the deadliest storms to hit the mainland in recent history. The Category 4 storm that first struck Florida’s Gulf […]
By Kiara Alfonseca 30 September 2024 (ABC News) – Asheville, North Carolina, has been called a potential safe haven for climate refugees by real estate researchers, praised for its temperate mountain weather, distance far from the coast, experiencing less extreme heat and fewer wildfires. The city of around 95,000 people was believed markings of a place where those escaping […]
8 August 2024 (Center for American Progress) – In the devastating aftermath of Hurricane Debby, the Southeast is tasked with the difficult work of rebuilding homes, businesses, and lives. Initial reports indicate at least six people have died from the storm. Federal agencies play a critical role in providing swift and efficient support to these families and […]
By Abrahm Lustgarten 2 October 2024 (The New York Times) – When Hurricane Helene, the 420-mile-wide, slow-spinning conveyor belt of wind and water drowned part of Florida’s coastline and then barged its path northward through North Carolina last week, it destroyed more than homes and bridges. It shook people’s faith in the safety of living […]