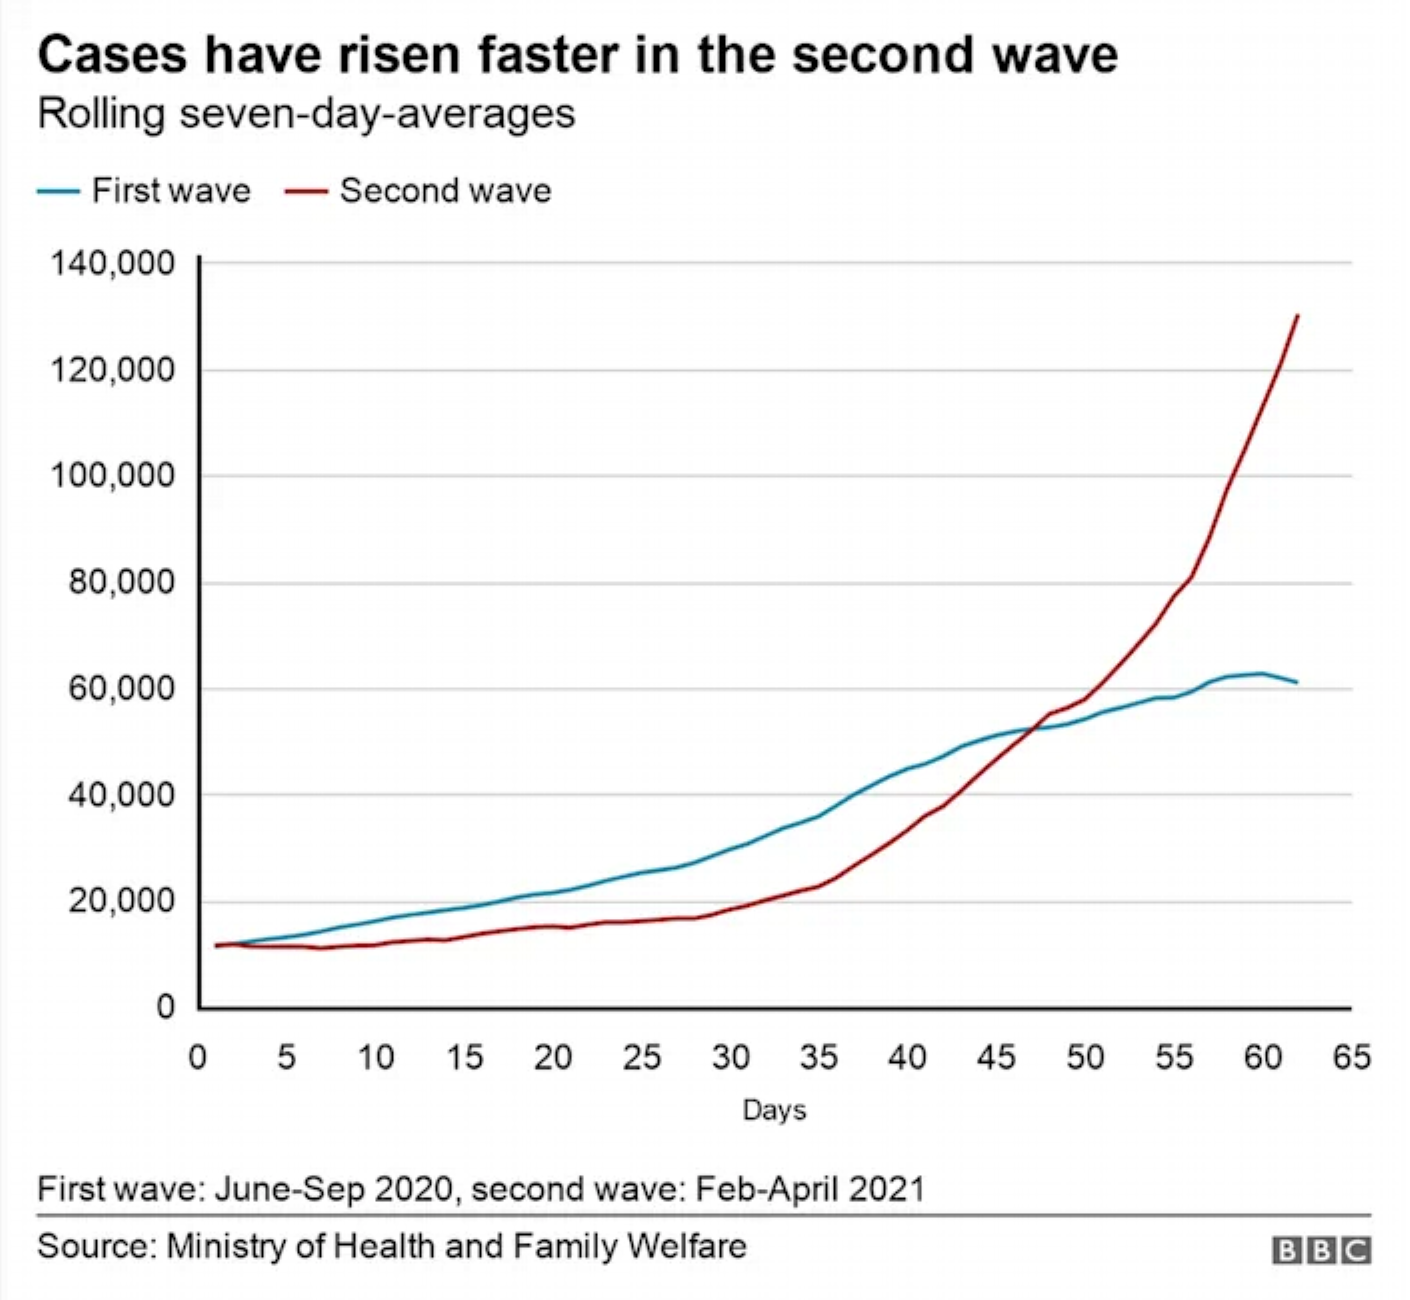
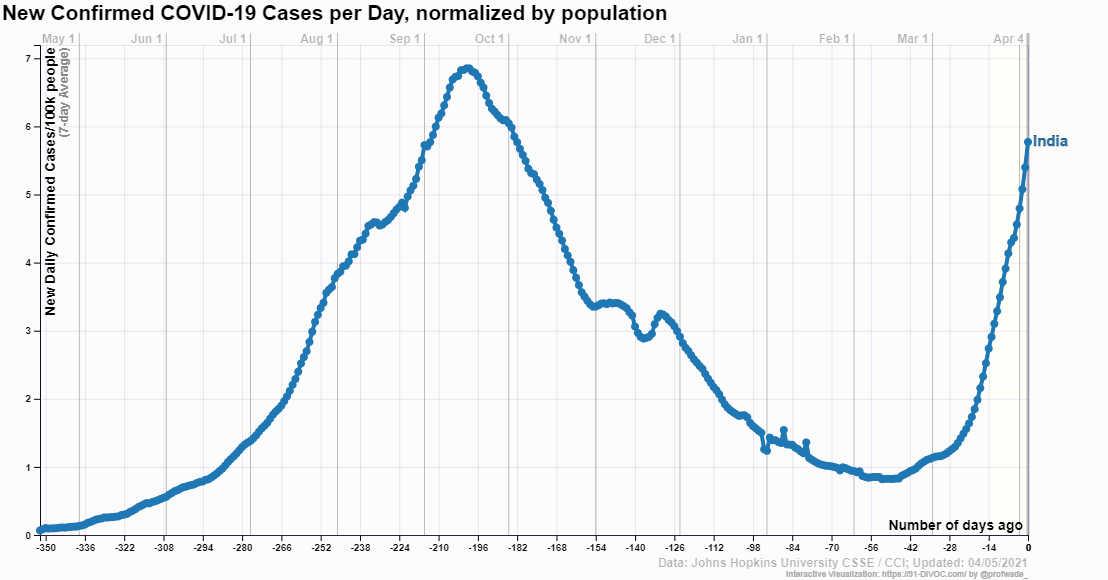
By Jeffrey Gettleman, Suhasini Raj, and Hari Kumar 21 April 2021 NEW DELHI (The New York Times) – India’s health care system shows signs of buckling under the strain of a second wave of coronavirus infections, as the authorities reported nearly 300,000 new cases on Wednesday and an accident at a Covid-19 hospital killed more […]
By Morgan Winsor 5 April 2021 LONDON (ABC News) – India has seen “an alarming rate of growth of COVID-19 cases and deaths” in recent weeks, the prime minister’s office said Sunday. More than 12.3 million people in India have been diagnosed with COVID-19 so far and at least 165,101 of them have died, making India one […]
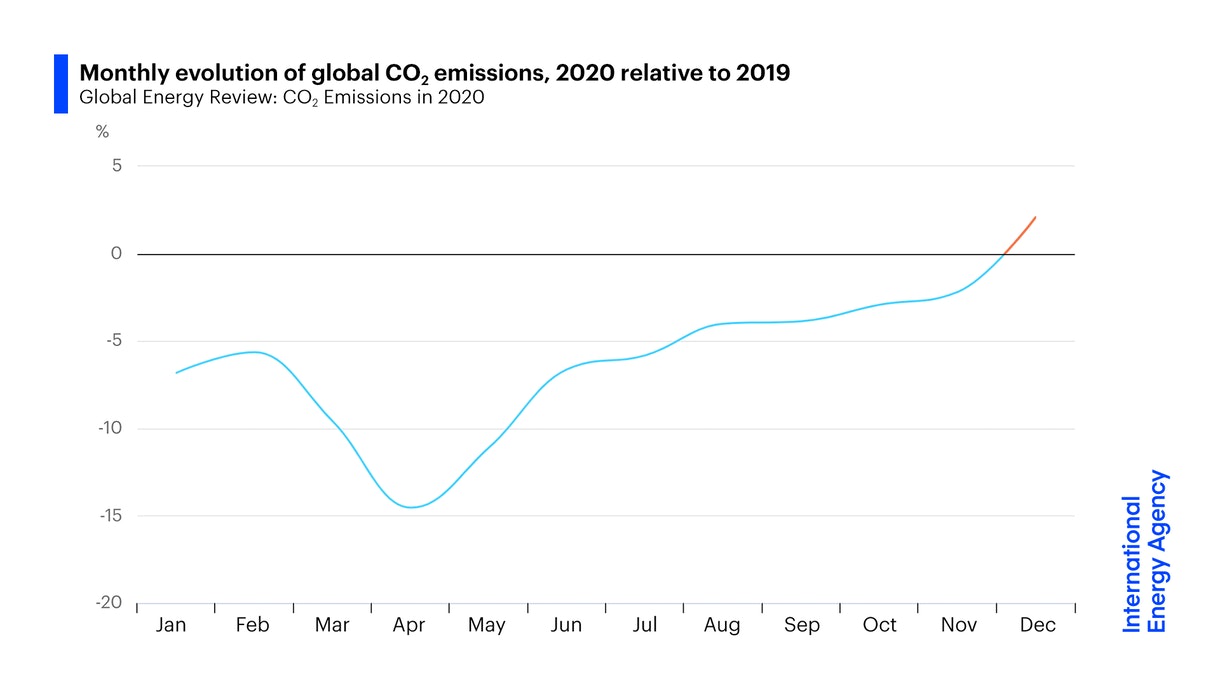
2 March 2021 (IEA) – The Covid-19 crisis in 2020 triggered the largest annual drop in global energy-related carbon dioxide emissions since the Second World War, according to IEA data released today, but the overall decline of about 6% masks wide variations depending on the region and the time of year. After hitting a low in […]
By Hannah Ellis-Petersen 8 February 2021 DELHI, India (The Guardian) – Twenty six bodies have been recovered in the Indian Himalayas and scores more people are still missing after a second day of rescue efforts after a glacier break that caused an avalanche of water and debris to engulf a river valley and demolish two […]
CHICAGO, 25 January 2021 (Aon) – Aon plc (NYSE: AON), a leading global professional services firm providing a broad range of risk, retirement, and health solutions, today launches its global Weather, Climate & Catastrophe Insight: 2020 Annual Report. The report evaluates the impact of global natural disaster events to identify trends, manage volatility and enhance resilience. The report reveals […]
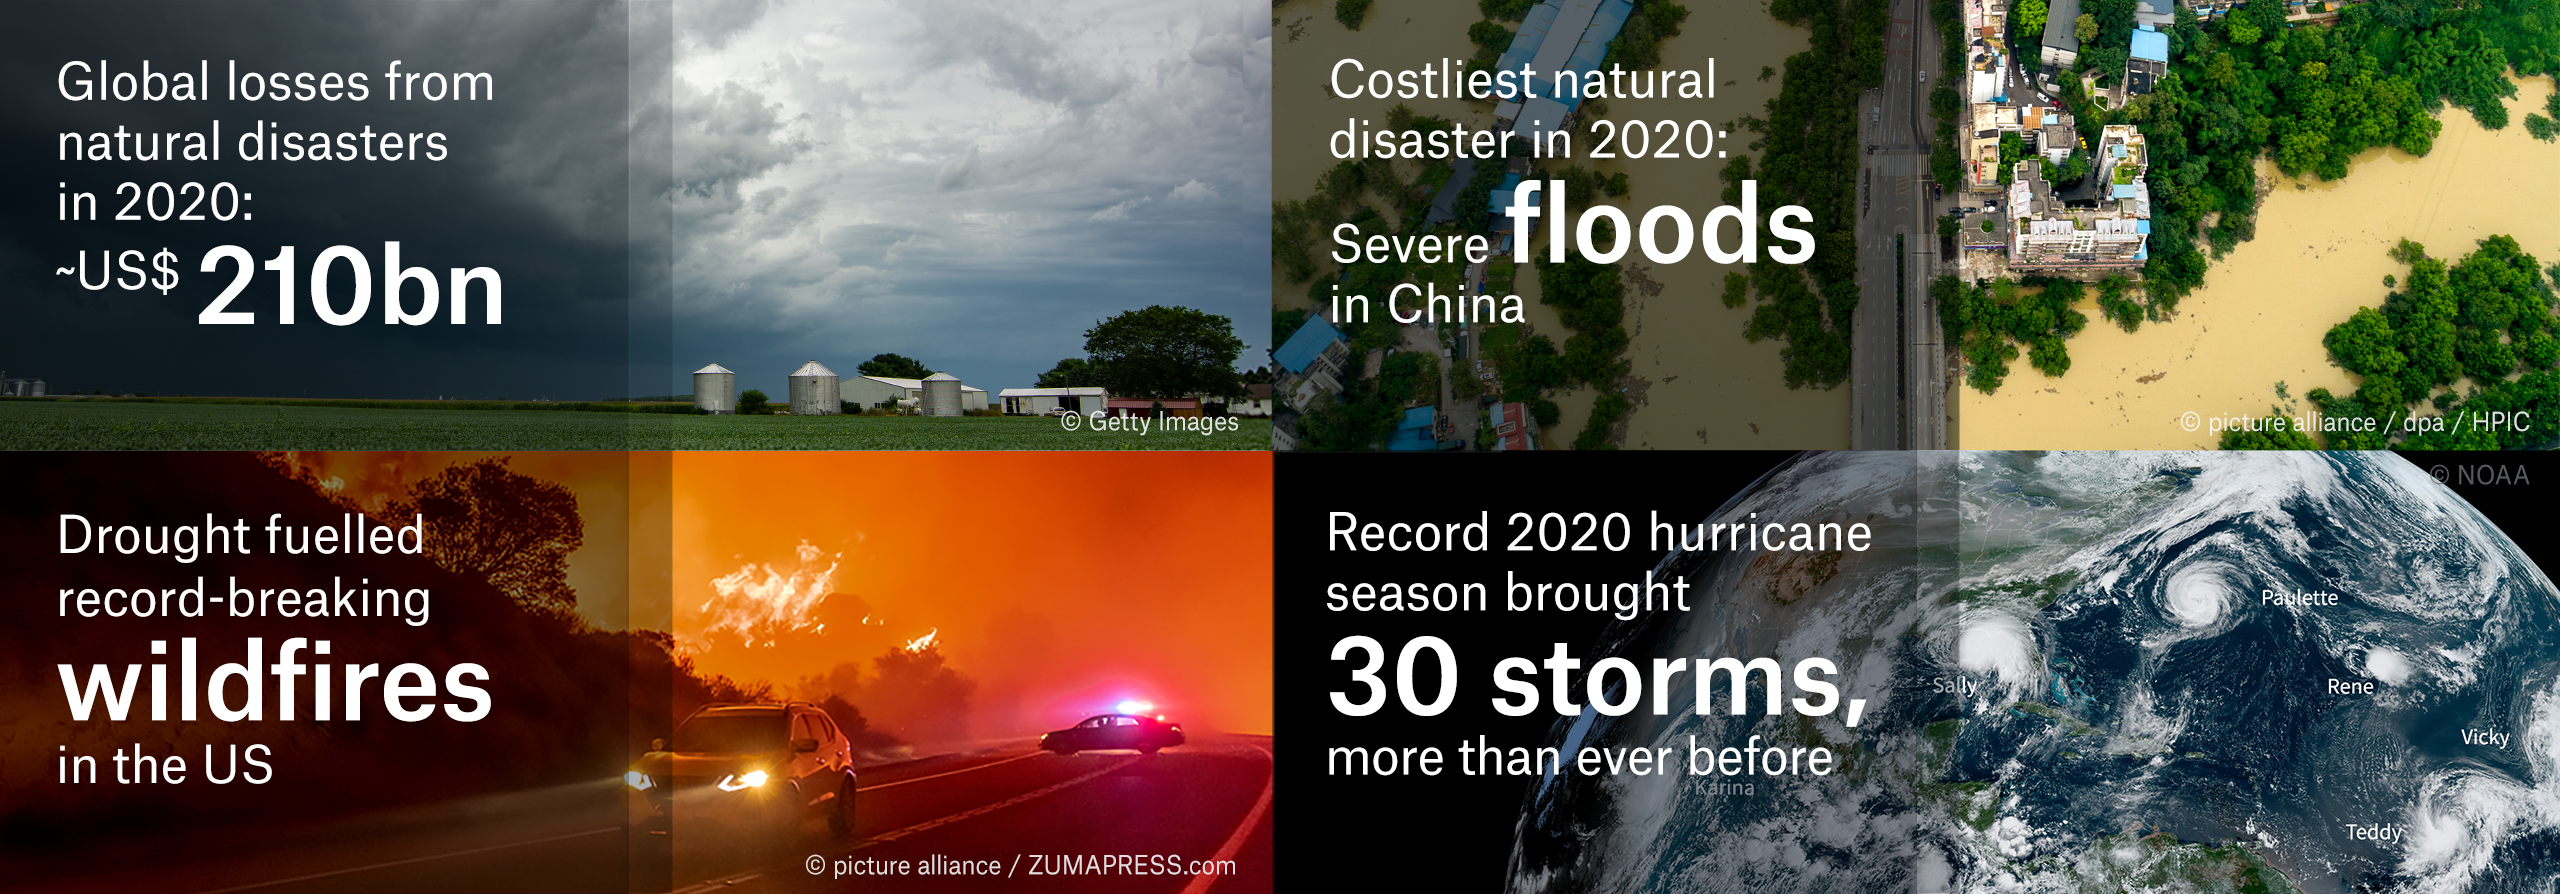
7 January 2021 (Munich Re) – Global losses from natural disasters in 2020 came to US$ 210bn, of which some US$ 82bn was insured. Both overall losses and insured losses were significantly higher than in the previous year (2019: US$ 166bn and US$ 57bn respectively). The US share of losses was rather high: Natural disasters in the […]
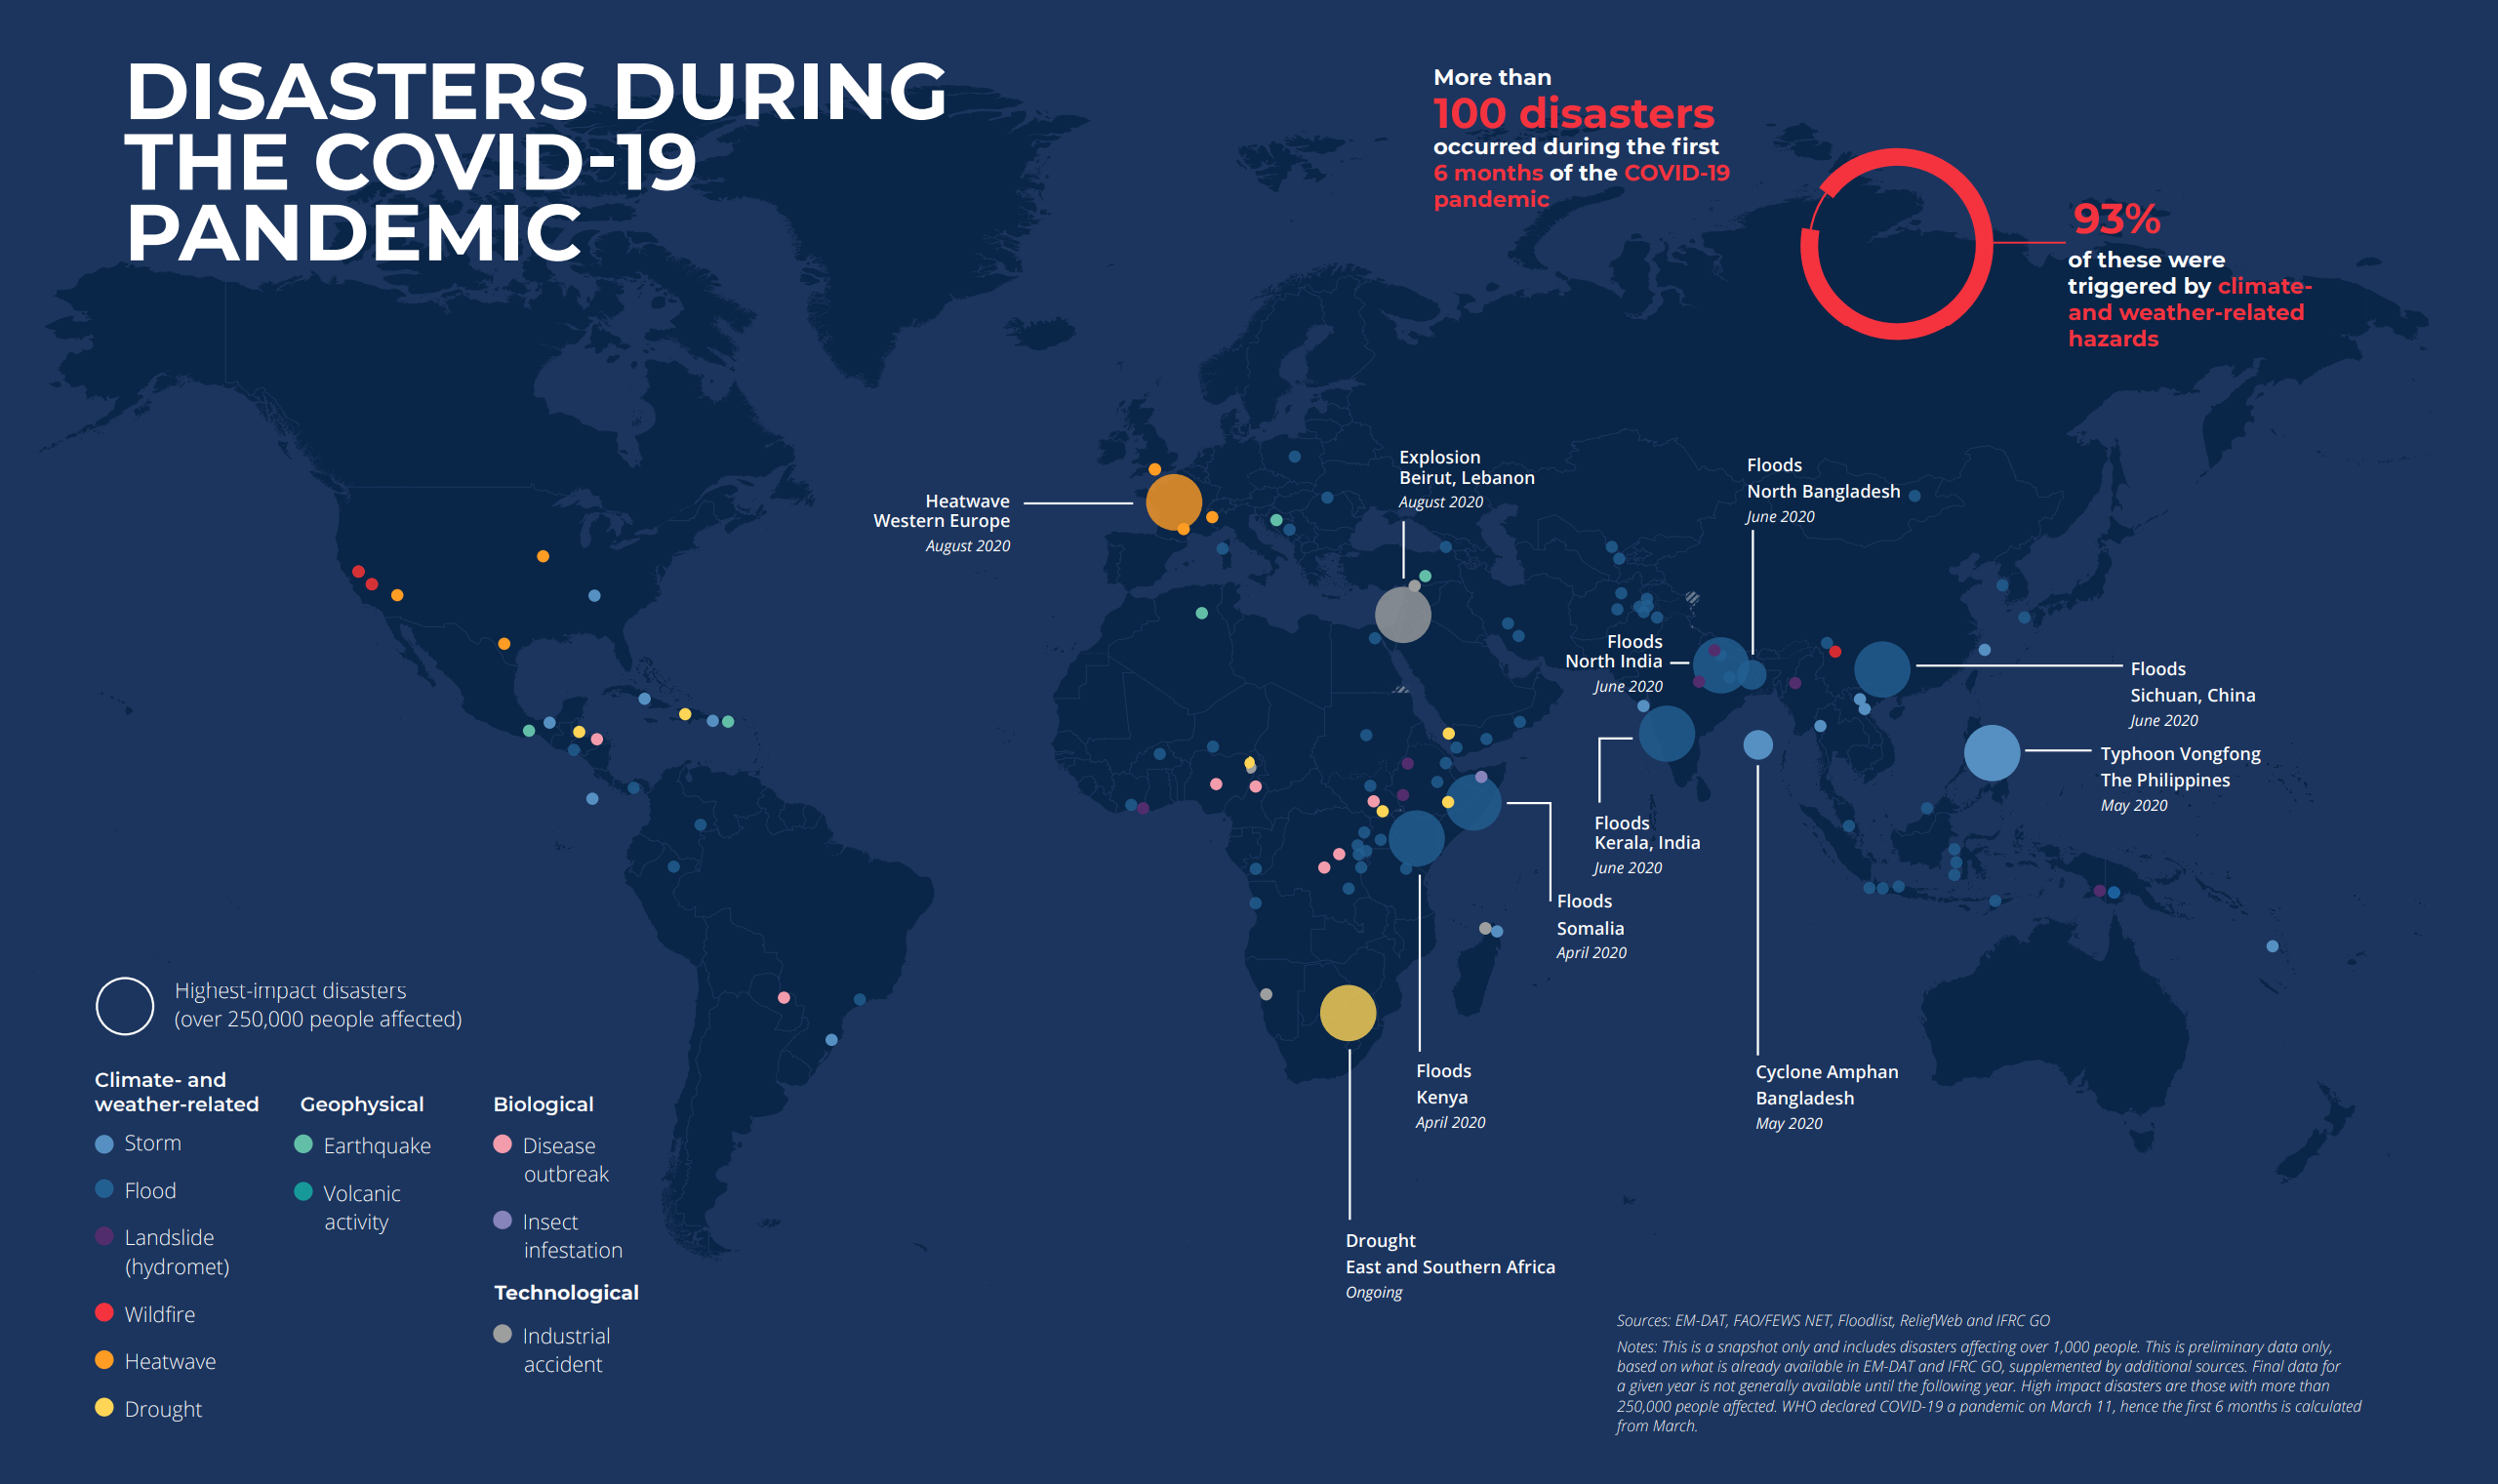
KUALA LUMPUR, 16 December 2020 (IFRC) – In a record-breaking year, the International Federation of Red Cross and Red Crescent Societies (IFRC) has responded to more climate-related disasters across Asia Pacific than any other time this century so far. The IFRC has already responded to 25 climate-related disasters in the Asia Pacific, including floods, typhoons, […]
11 December 2020 (UEA) – The global COVID-19 lockdowns caused fossil carbon dioxide emissions to decline by an estimated 2.4 billion tonnes in 2020 – a record drop according to researchers at the University of East Anglia (UEA), University of Exeter, and the Global Carbon Project. The fall is considerably larger than previous significant decreases […]
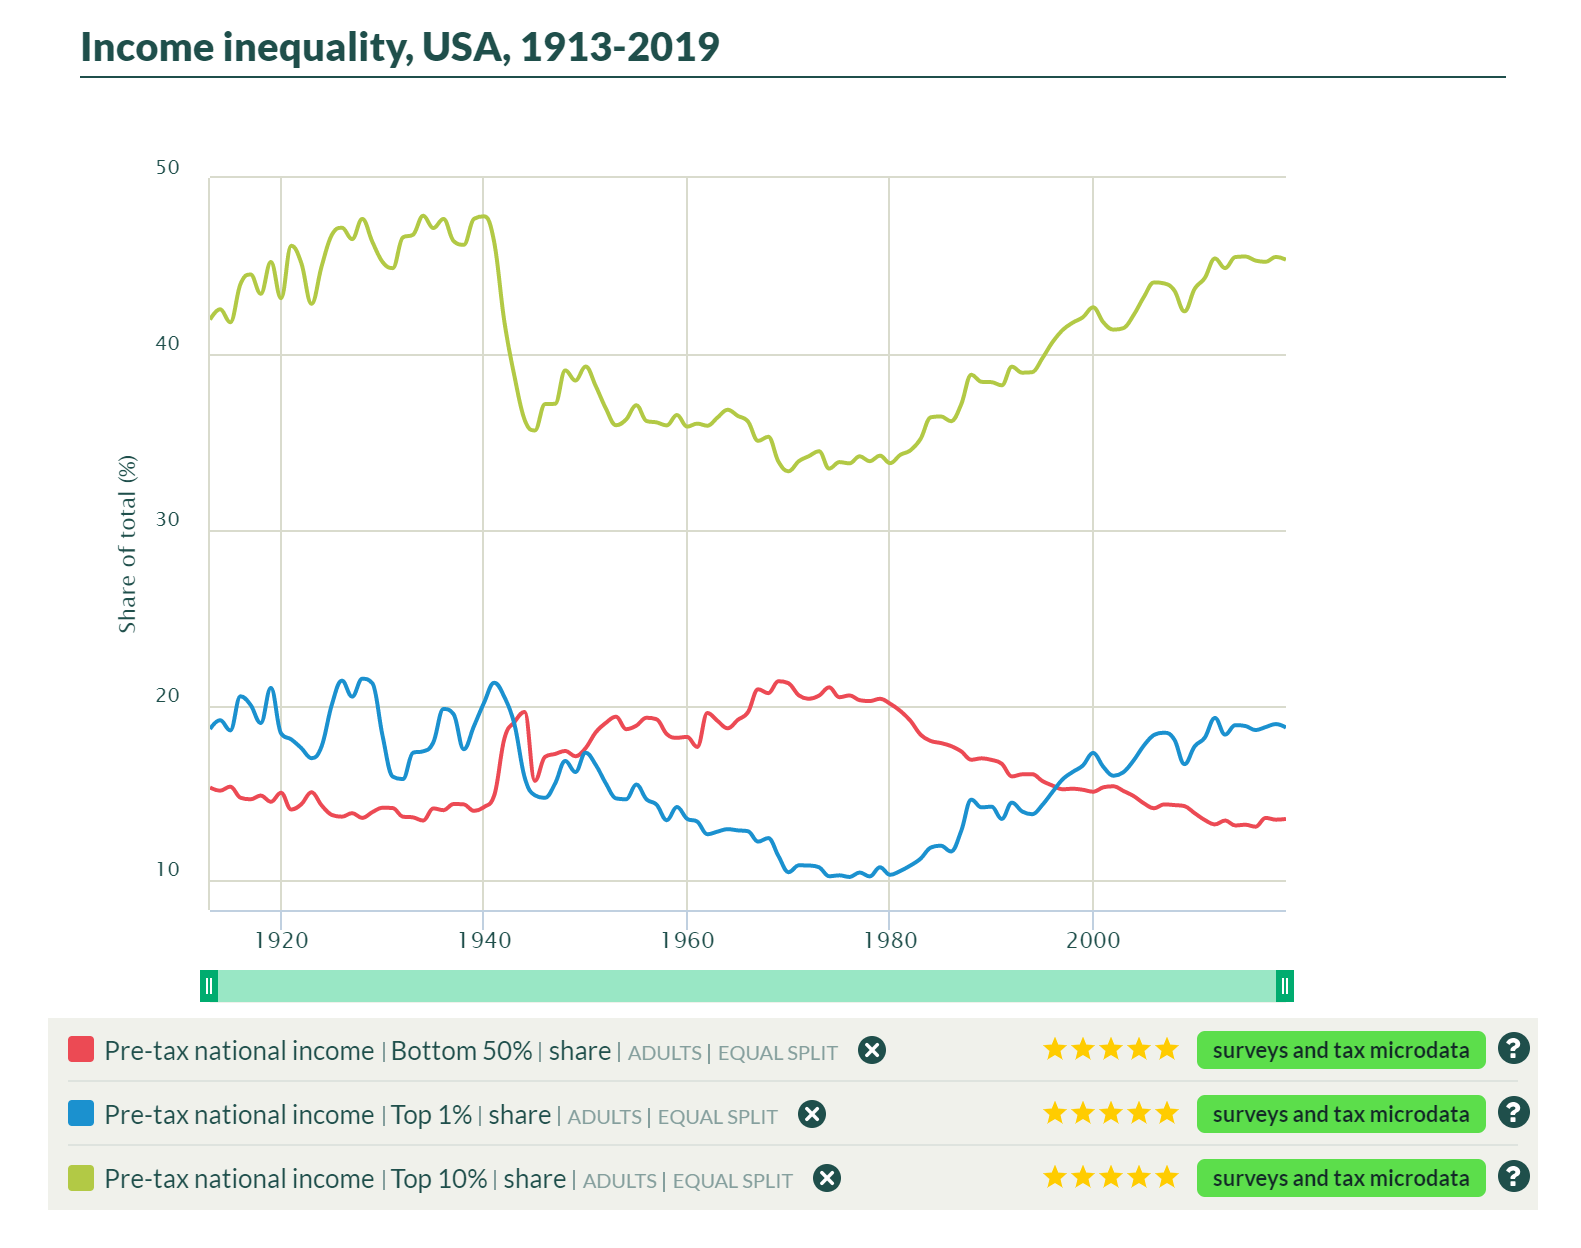
10 November 2020 (WIL) – The World Inequality Lab releases today a major update of global inequality data for 173 countries, making up 97% of the world population and 7.5 billion people. The data published distributes economic growth within each country making it possible to track inequality and poverty over time, countries and regions. These […]
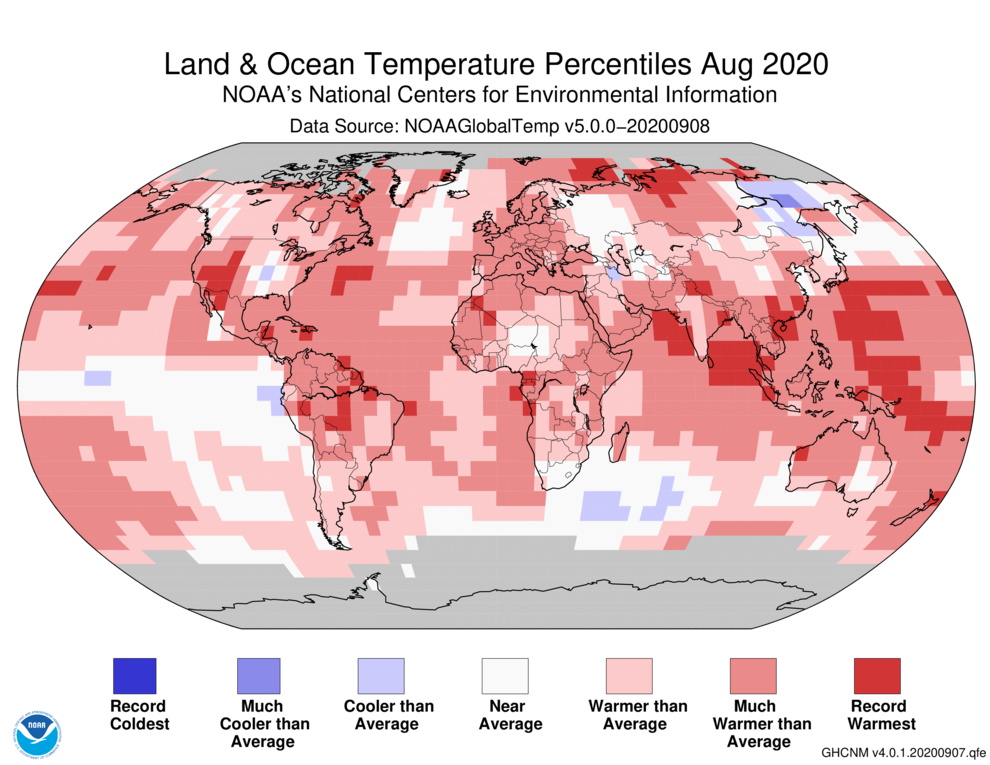
By Jeff Masters, Ph.D. 15 September 2020 (Yale Climate Connections) – August 2020 was the second-warmest August since global record keeping began in 1880, NOAA’s National Centers for Environmental Information, or NCEI, reported September 14. The month was just 0.04 degrees Celsius behind the record set in August 2016. NASA rated the month as the third-warmest August on […]