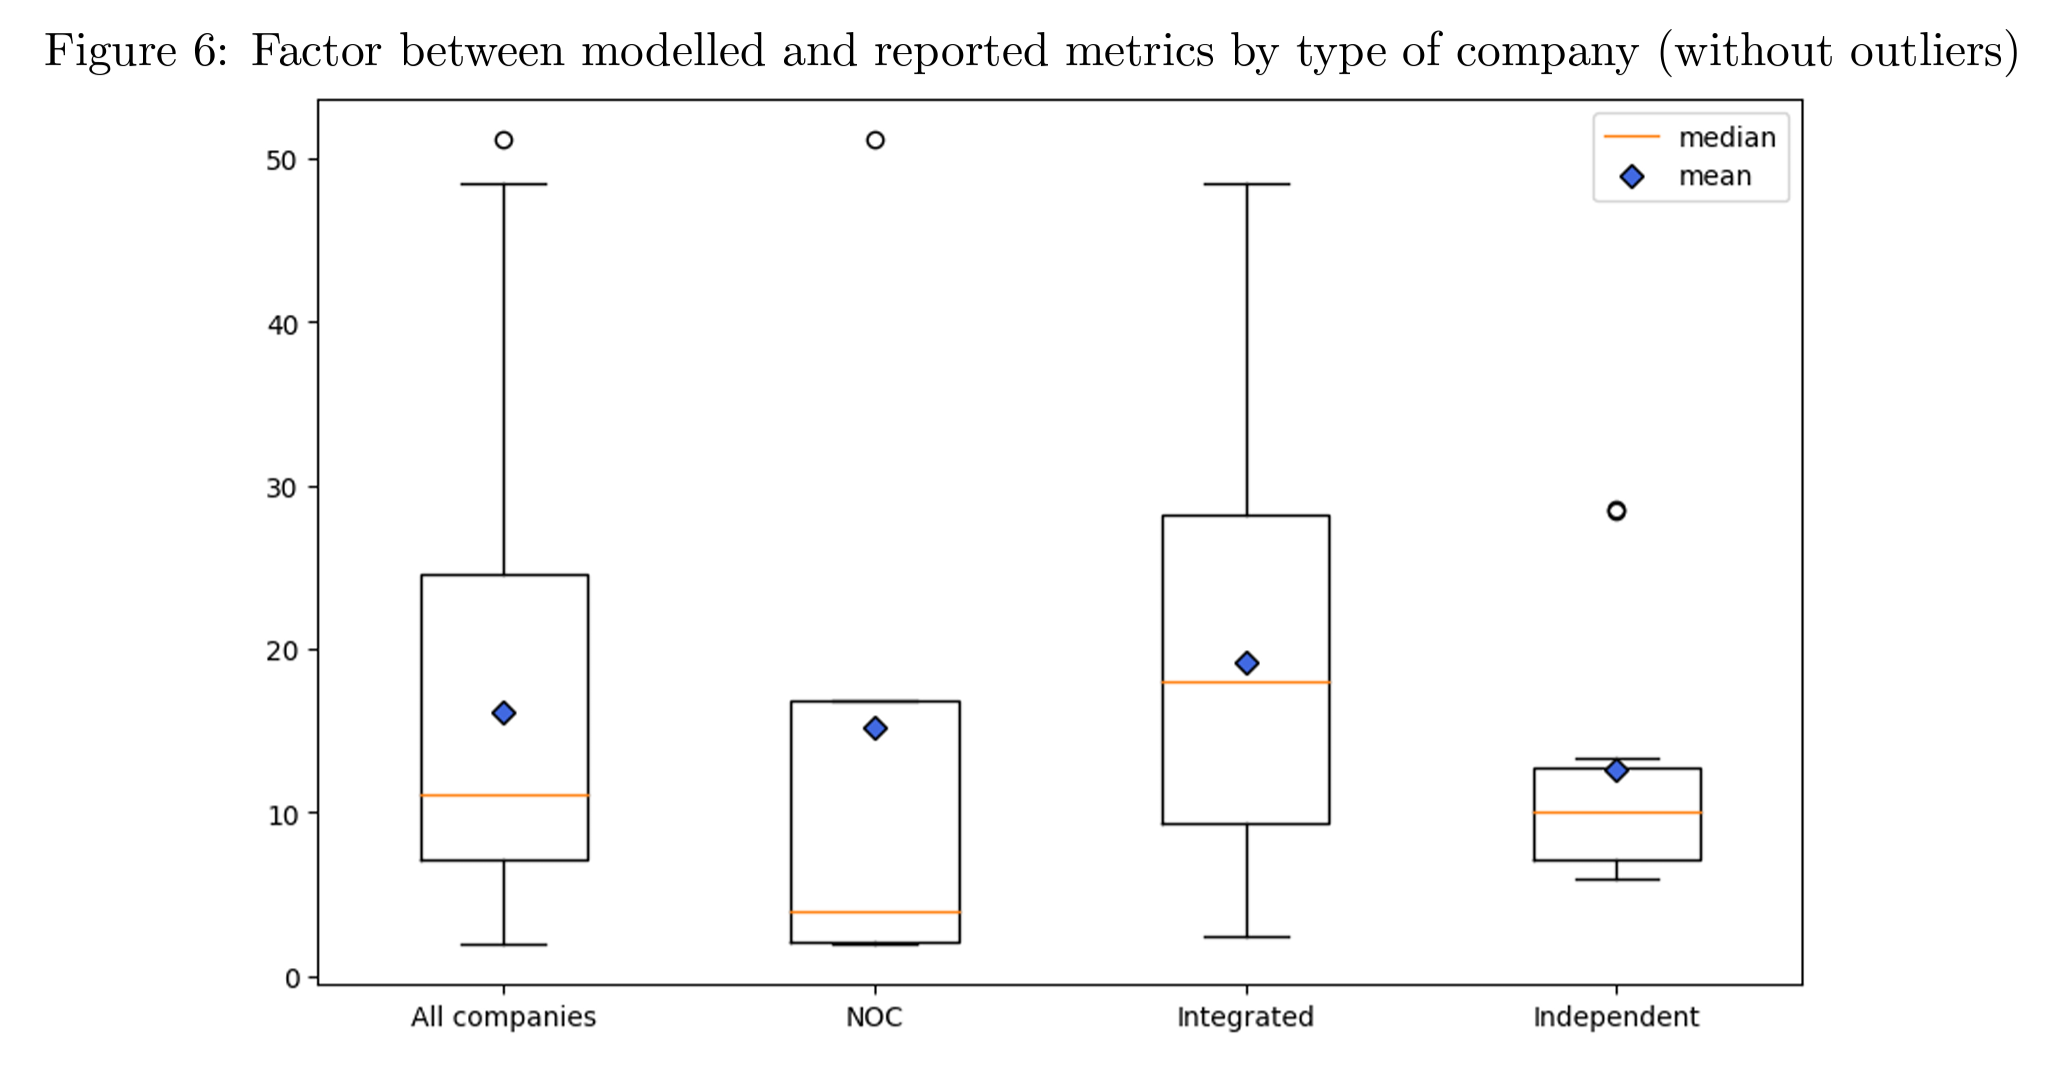
Difference between modelled and reported methane intensities by type of company. Modelled emissions are compared with the methane emissions reported by each company in its sustainability reporting or its public communication. The global average ratio on this set of companies is 16.1, with a relative standard deviation of 79.3 percent. Each type of company within this set does not contribute similarly to these global metrics. Integrated companies have the highest average ratio between model and reporting out of all the types of companies, at 19.2 and a relative standard deviation of 64.7 percent, which means that some Integrated companies reporting are much closer to the values for their corresponding model than others. National oil companies (NOCs) have the lowest median ratio with 4.0 but their average is the second highest at 15.2, strongly influenced by one of the companies in the category that has a factor of 51.2, while the remaining 4 have an average of 6.2. Independent companies have the lowest average with 12.6 and a relative standard deviation of 65.2 percent, which shows the importance of the regions of operation in the results of different models. Graphic: Peyle, et al., 2024

We used satellite imagery and AI to see who’s keeping their climate pledges – Almost none of the signatories of the Global Methane Pledge are following through on their commitment – On average, companies emit methane intensities 16 times larger than reported

By Antoine Rostand 17 July 2024 (Fortune) – Committing countries or companies to climate pledges doesn’t guarantee that those pledges will be honored. After all, the planet is getting a great deal hotter every year, with the record-breaking temperature in India in May just the latest example. If companies and countries were fully honoring their […]

NASA’s ECOSTRESS instrument on 19 June 2024 recorded scorching roads and sidewalks across Phoenix, where contact with skin could cause serious burns in minutes to seconds, as indicated in the legend. Graphic: NASA / JPL-Caltech

NASA captures 160°F (71°C) roads and sidewalks across Phoenix – “It looks like we’re at a record pace, which is a record we really don’t want to set”

By Jessica Boehm 10 July 2024 (Axios) – Many Phoenix streets and sidewalks can reach 160° during the hottest parts of the day, according to a new NASA analysis. Why it matters: Surfaces that hot can cause contact burns in seconds, and Valley hospitals are seeing an uptick in patients with serious burn injuries. The big picture: Human-caused climate […]

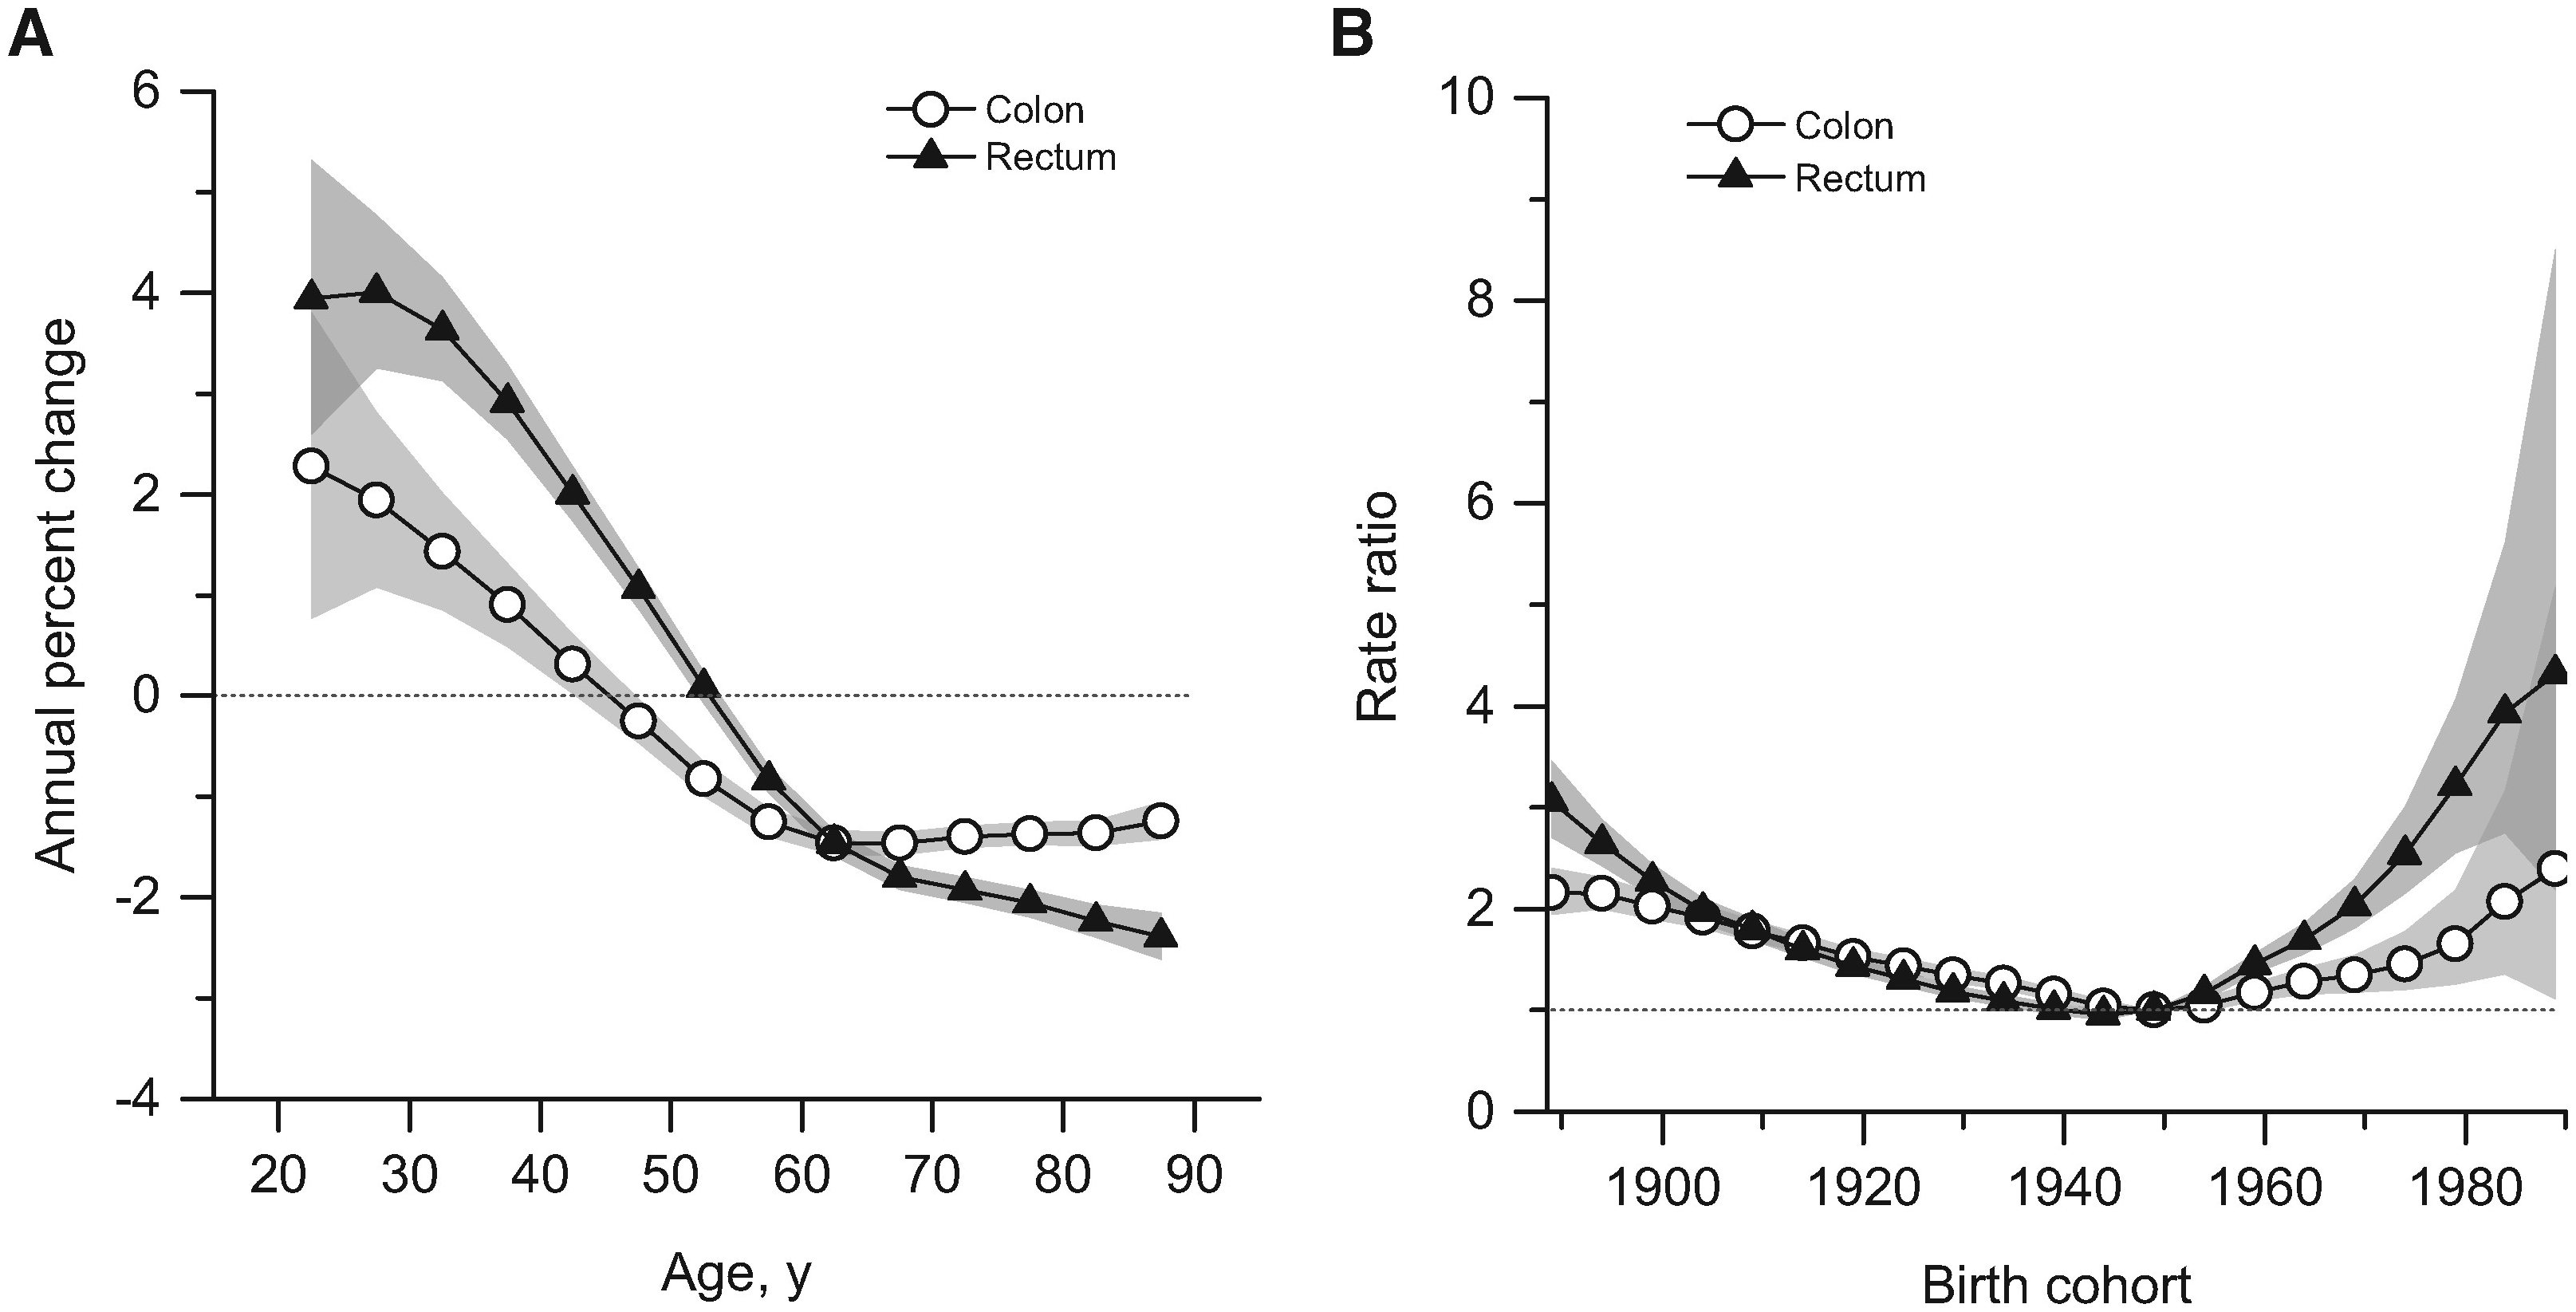
Summary age-specific annual percent change (i.e., local drift) and birth cohort rate ratios of colorectal cancer incidence rates in the United States. A) Local drift: summary age-specific annual percent change for colon and rectal cancer. B) Incidence rate ratios by birth cohort for colon and rectal cancer (referent cohort = 1949). Shaded bands indicate 95 percent confidence interval. Graphic: Siegel, et al., 2017 / Journal of the National Cancer Institute

Cancer is striking more young people, and doctors are alarmed and baffled – “We have to find out why. Otherwise, the progress we have made in the last 50 years may stall or reverse.”

By Brianna Abbott 11 January 2024 (The Wall Street Journal) – Meilin Keen was studying for the bar exam and preparing to move to New York City last June when she started throwing up blood. Keen, 27 years old, learned days later that she has gastric cancer. She postponed the bar exam. Brain fog from […]

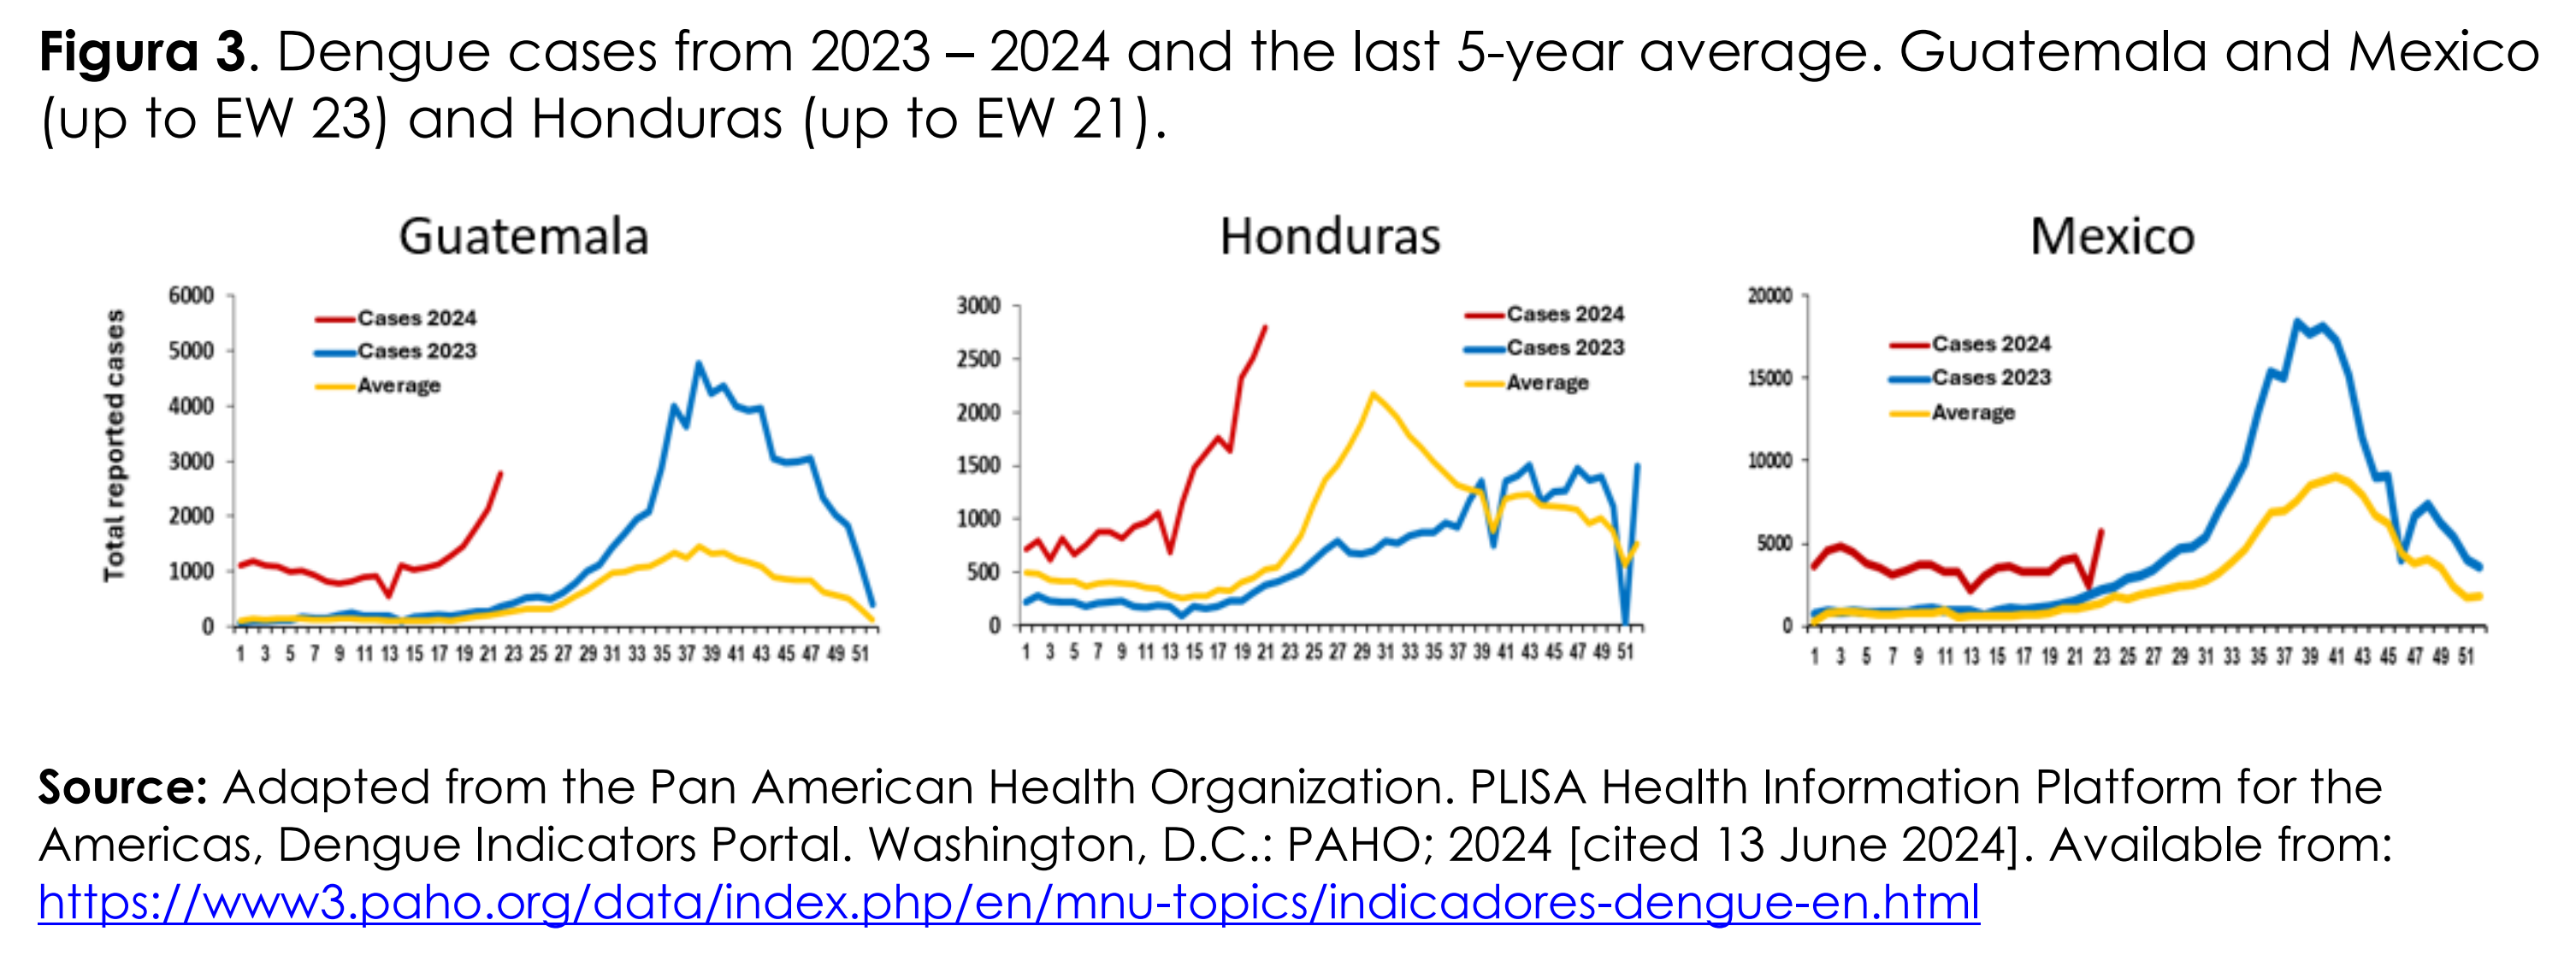
Dengue cases in Guatemala, Mexico, and Honduras, 2023-2024 and 5-year average. In the Region of the Americas, the number of dengue cases recorded during the first half of 2024 exceeded the maximum number of cases historically reported in a year, as compared to all previously recorded years. As of epidemiological week (EW) 23 of 2024, 43 countries and territories in the Region of the Americas have reported 9,386,082 cases of dengue; this number is twice as high as the number of cases recorded throughout 2023, 4,617,108 cases. Data: Adapted from the Pan American Health Organization / PLISA Health Information Platform for the Americas, Dengue Indicators Portal, Washington, D.C. PAHO; 2024 cited 13 June 2024. Graphic: PAHO / WHO

Dengue fever: CDC issues alert amid U.S. and global spike in cases – In 2024, cases of dengue fever in the Americas have reached record-breaking levels, with more than 9.7 million reported cases, twice the number for the entire year in 2023

By Finn Cohen 27 June 2024 (Healthline) – As cases of dengue fever rise worldwide, the Centers for Disease Control and Prevention (CDC) issued an advisory for physicians, public health authorities, and the public in the United States to be alert to the trend. So far in 2024, cases of dengue fever in countries in the Americas have reached record-breaking […]

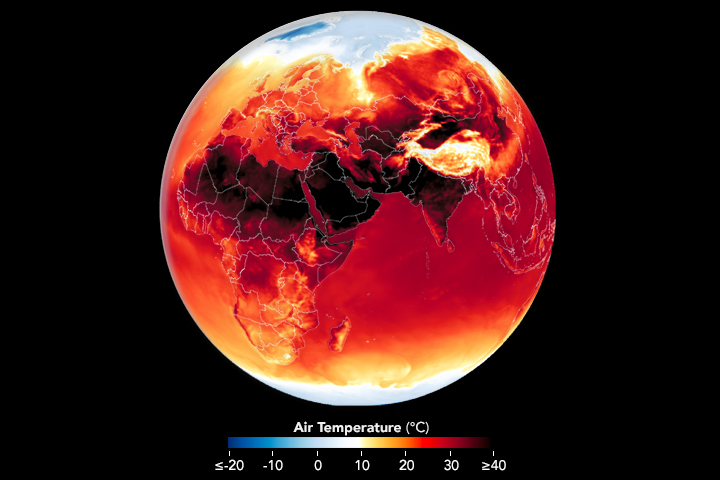
Map showing surface air temperature in Africa, Europe, Southwest Asia, and India on 25 June 2024. Heat waves rolled through parts of Europe, the Middle East, and South Asia, leaving vulnerable populations at risk. Data: GEOS data from the Global Modeling and Assimilation Office at NASA GSFC. Graphic: Lauren Dauphin / NASA Earth Observatory

In the grip of global heat – Early Summer 2024 heatwaves in the Northern Hemisphere have been fierce

By Adam Voiland 28 June 2024 (NASA) – It’s only the beginning of the summer season in the Northern Hemisphere, but Earth is already roasting. Scientists from NASA’s Goddard Institute for Space Studies recently reported that May 2024, the hottest May in NASA’s global surface temperature analysis, marked a full year of record-high monthly temperatures. Likewise, NOAA recently reported that January through […]

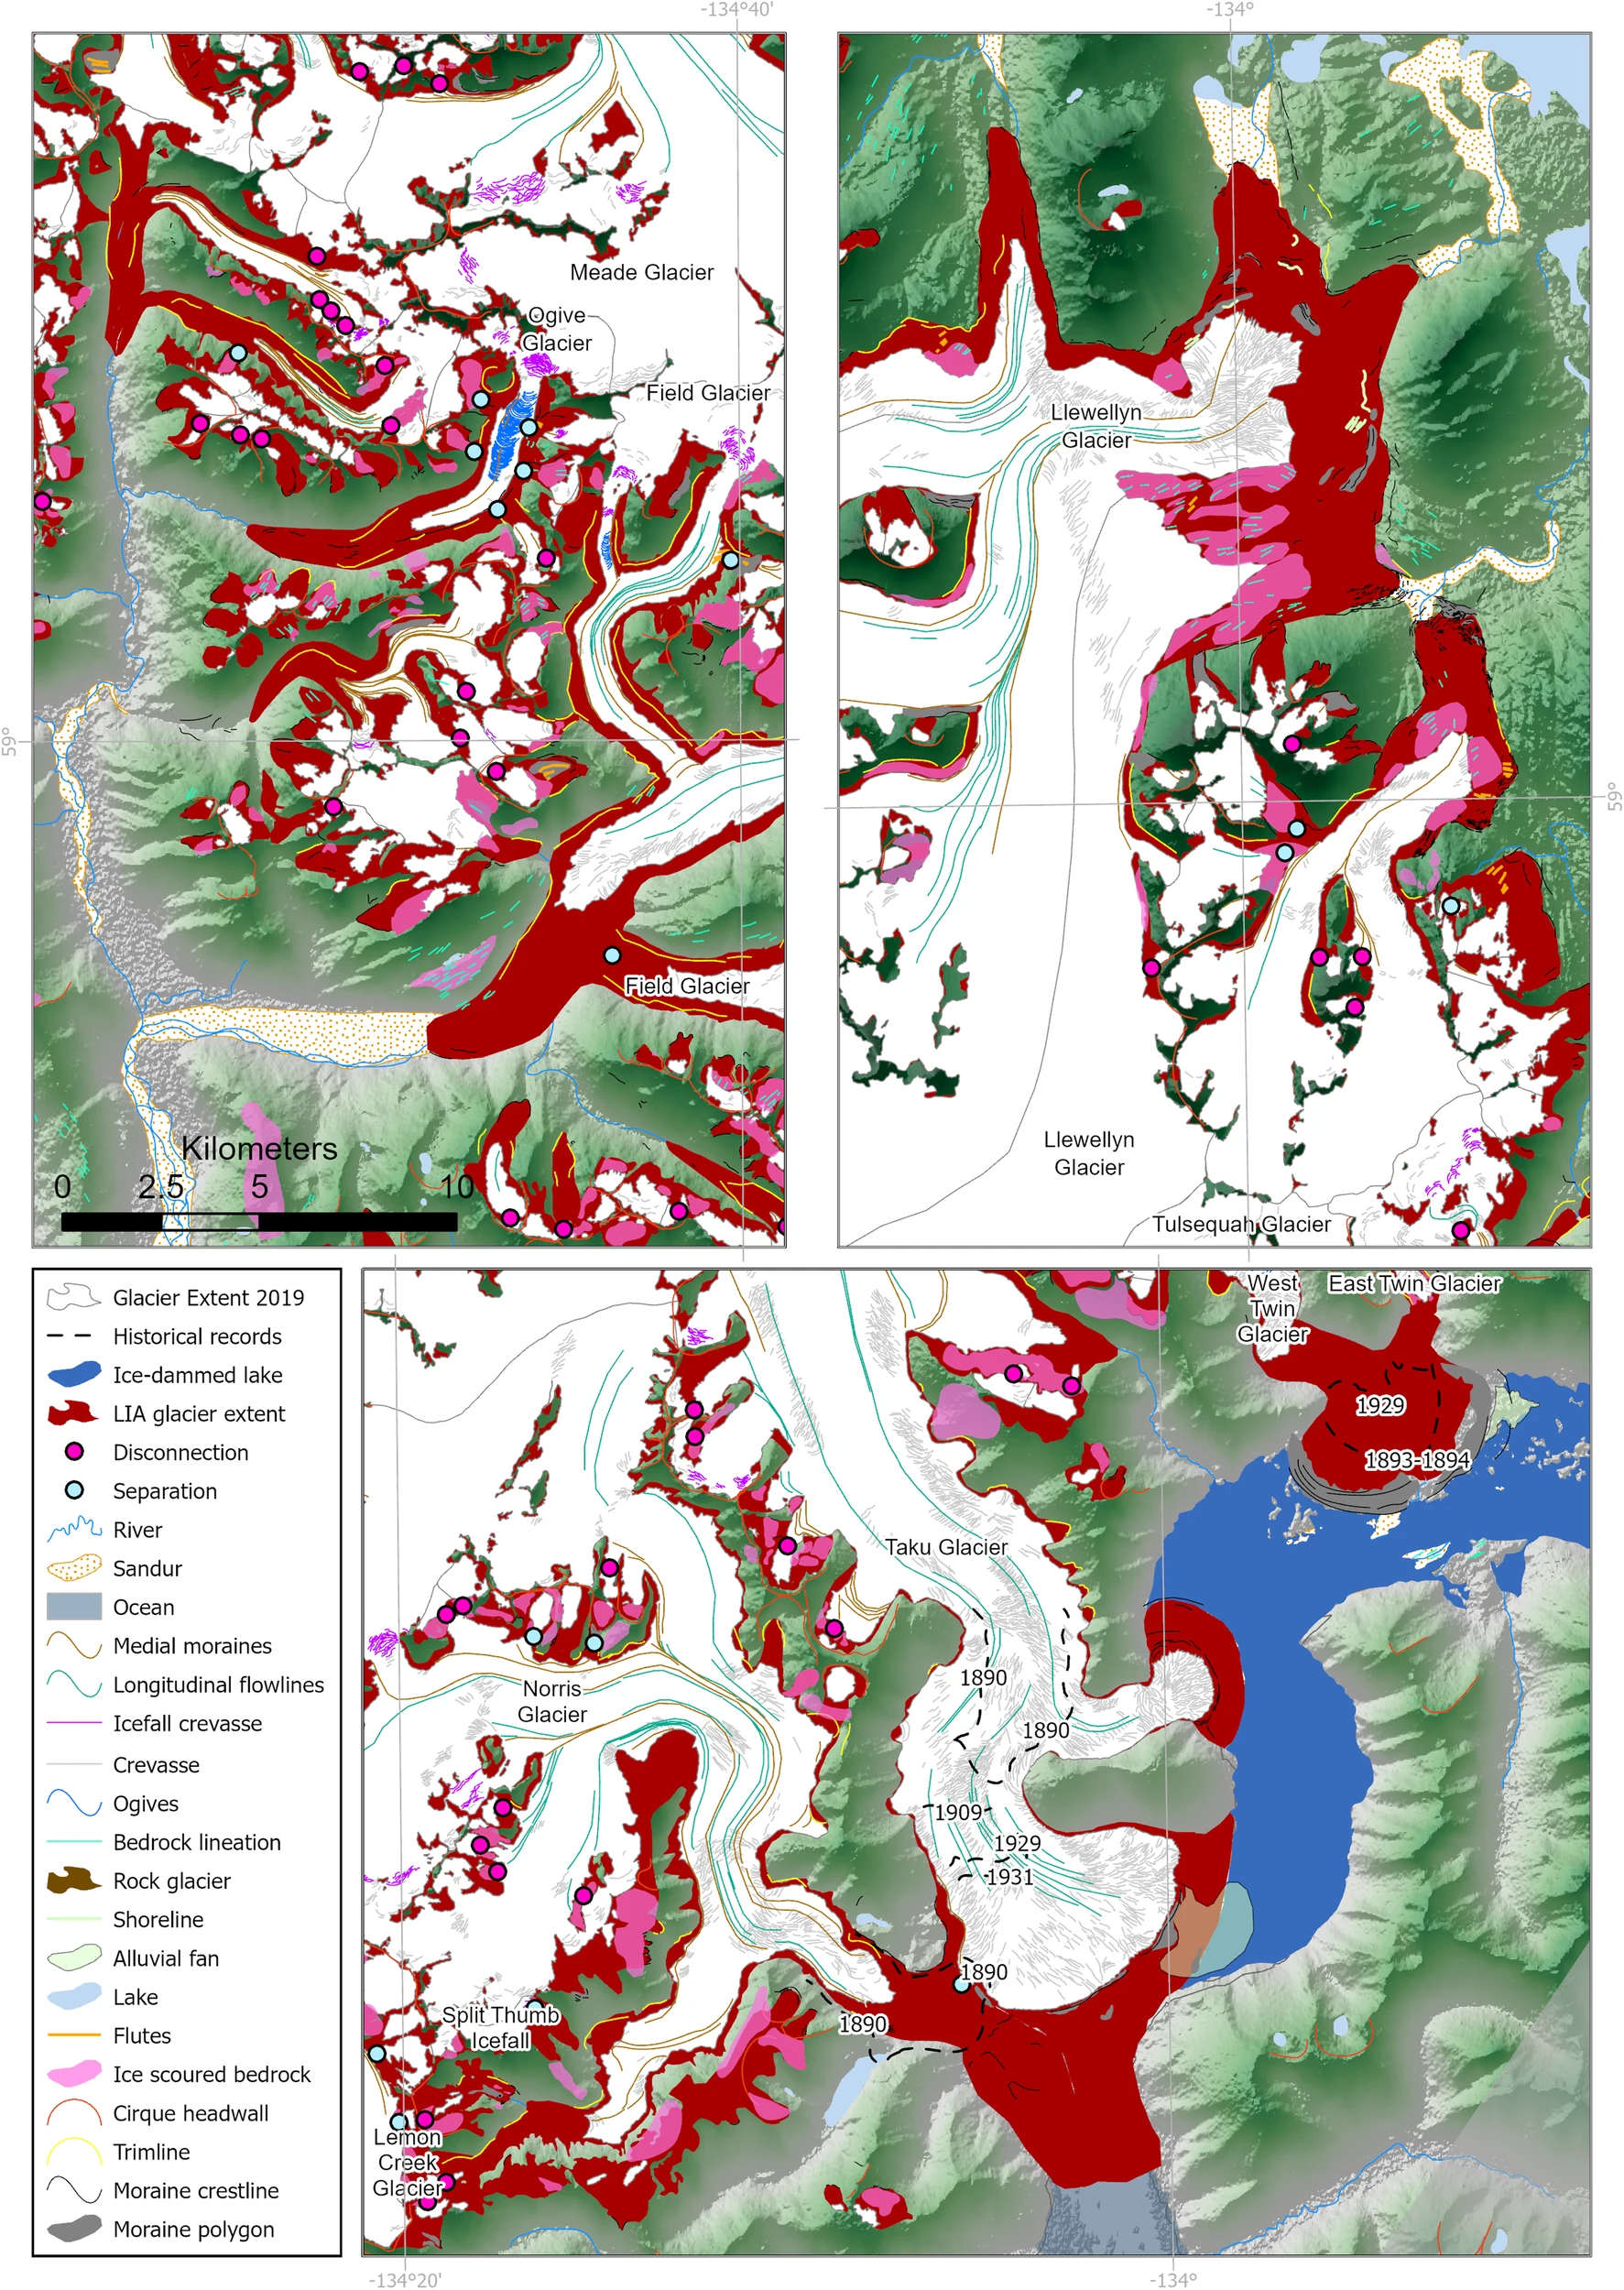
Map showing geomorphological data and icefield reconstruction of the Juneau Icefield for the “Little Ice Age” (LIA) maximum. Graphic: Davies, et al., 2024 / Nature Communications

Melting of Alaska’s Juneau Icefield accelerates, losing snow nearly 5 times faster than in the 1980s – “When you go there the changes from year-to-year are so dramatic that it just hits you over the head”

By Seth Borenstein 2 July 2024 (AP) – The melting of Alaska’s Juneau icefield, home to more than 1,000 glaciers, is accelerating. The snow covered area is now shrinking 4.6 times faster than it was in the 1980s, according to a new study. Researchers meticulously tracked snow levels in the nearly 1,500-square mile icy expanse going back […]

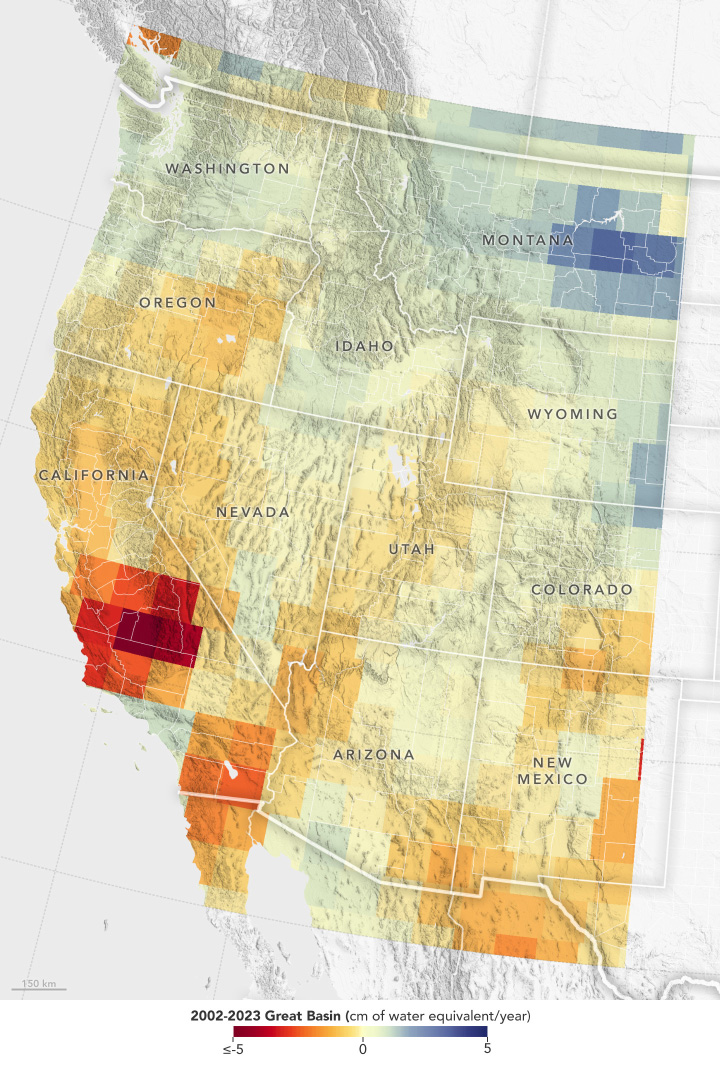
Map showing reduction of stored groundwater in the U.S. Southwest, April 2002 - September 2023. Gravity measurements from the GRACE series of satellites show that the decline in water levels in the Great Basin region from April 2002 to September 2023 has most severely affected portions of southern California (indicated in red). Record snowfall in recent years has not been enough to offset long-term drying conditions and increasing groundwater demands in the U.S. Southwest. Graphic: Hall, et al., 2024 / Geophysical Research Letters

NASA satellites find record snow didn’t offset Southwest U.S. groundwater loss – “In years like the 2022-23 winter, I expected that the record amount of snowfall would really help to replenish the groundwater supply. But overall, the decline continued.”

By James R. Riordon 17 June 2024 (NASA GSFC) – Record snowfall in recent years has not been enough to offset long-term drying conditions and increasing groundwater demands in the U.S. Southwest, according to a new analysis of NASA satellite data [Snowfall Replenishes Groundwater Loss in the Great Basin of the Western United States, but […]

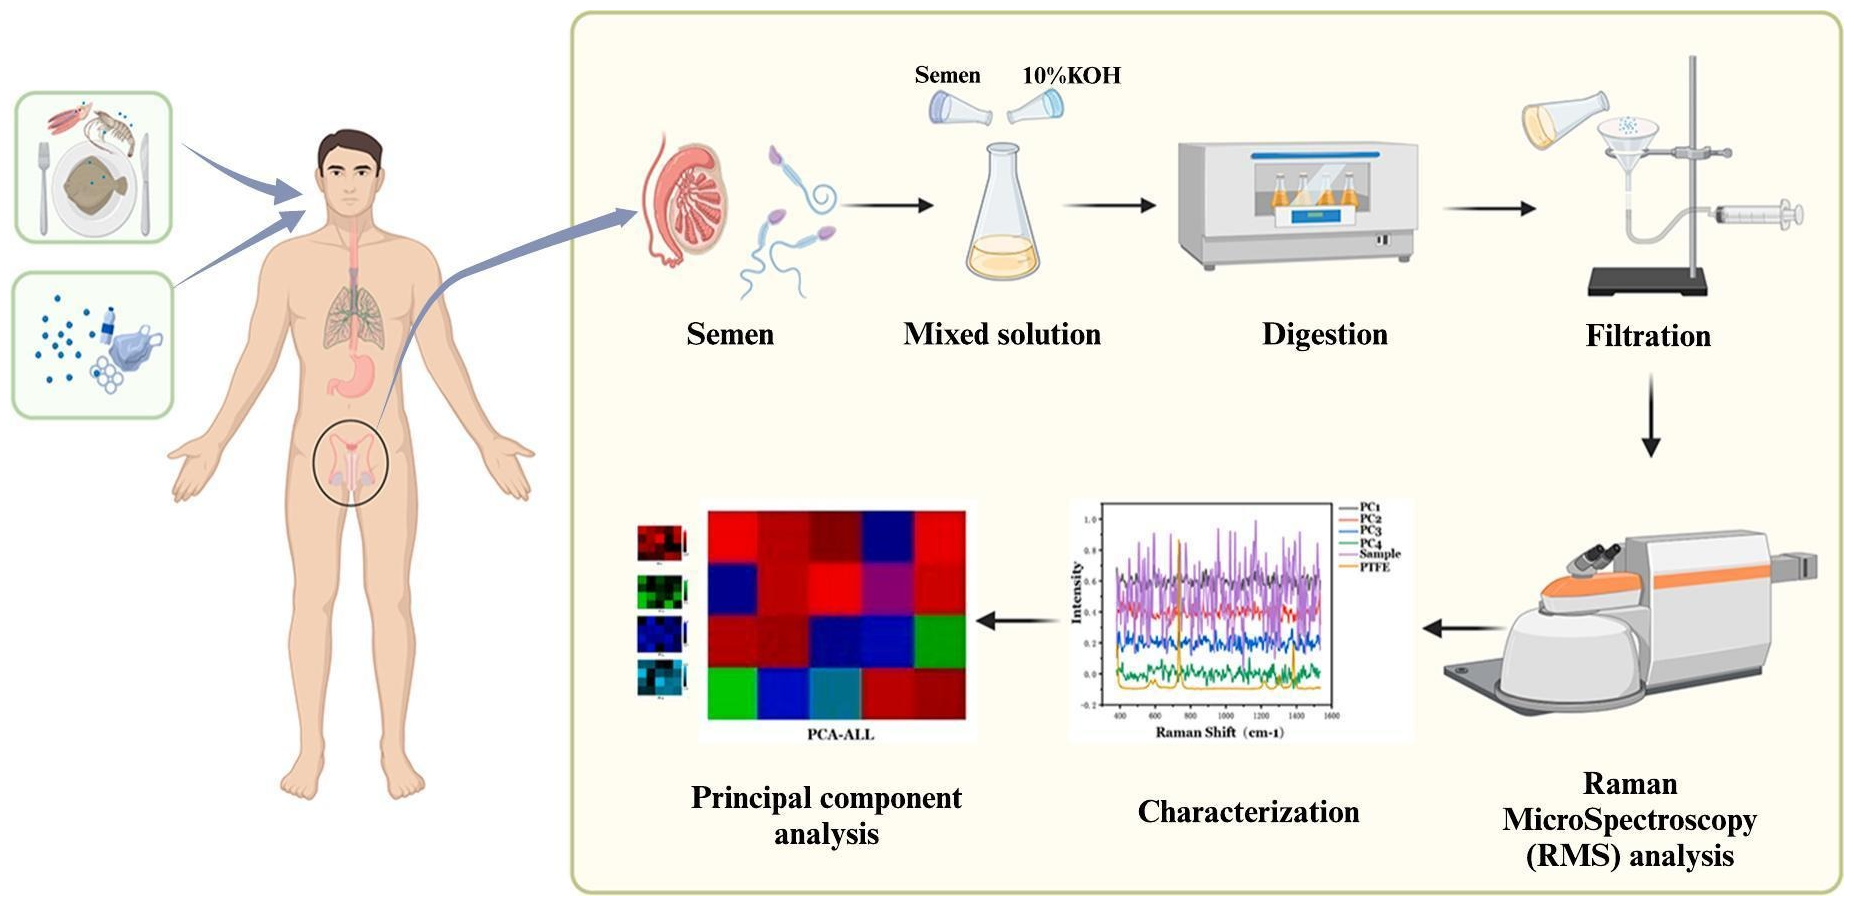
Diagram showing how microplastics enter the human body and are detected in semen by using Raman spectroscopy. Graphic: Li, et al., 2024 / Science of The Total Environment

Microplastics found in every human semen sample tested in study – “There is a need for action to avoid additional permanent damage to the planet and the human body”

By Damian Carrington 10 June 2024 (The Guardian) – Microplastic pollution has been found in all human semen samples tested in a study, and researchers say further research on the potential harm to reproduction is “imperative”. Sperm counts in men have been falling for decades and 40% of low counts remain unexplained, although chemical pollution has been implicated by many […]

Maps of near-bottom dissolved oxygen in the continental shelf waters off the United States Pacific Northwest, 1950-2021. About half of the water near the seafloor off the Pacific Northwest coast experienced low-oxygen conditions in 2021. Data from 1950 to 1980 are from the World Ocean Database32, data from 2009–2018 are from the NOAA Groundfish survey, and data from 2021 are from this study. Graphic: Barth, et al., 2024 / Nature Scientific Reports

Pacific Northwest coast suffers from low oxygen, study finds – “As we keep changing the climate, it’s going to become the norm. What’s pretty remarkable is that 50 percent of the continental shelf is going to be low oxygen.”

By Amanda Zhou 10 June 2024 (The Seattle Times) – About half of the water near the seafloor off the Pacific Northwest coast experienced low-oxygen conditions in 2021, according to a new study. And those hypoxic conditions, which are expected to become common with global warming, threaten the food web, the study found. The study […]

Map of the U.S. showing 11 weather and climate disasters each costing $1 billion or more that occurred between January and May, 2024. Graphic: NOAA / NCEI

Billion-dollar disasters swept across the U.S. in Spring 2024

By Meredith Garofalo 13 June 2024 (Space.com) – Two severe weather events in May brought the number of billion-dollar disasters for the United States in 2024 up to nearly a dozen.  The month began with a tornado outbreak from May 6 to May 10 that stretched across 23 states, going from South Dakota to Florida. […]
Social media & sharing icons powered by UltimatelySocial