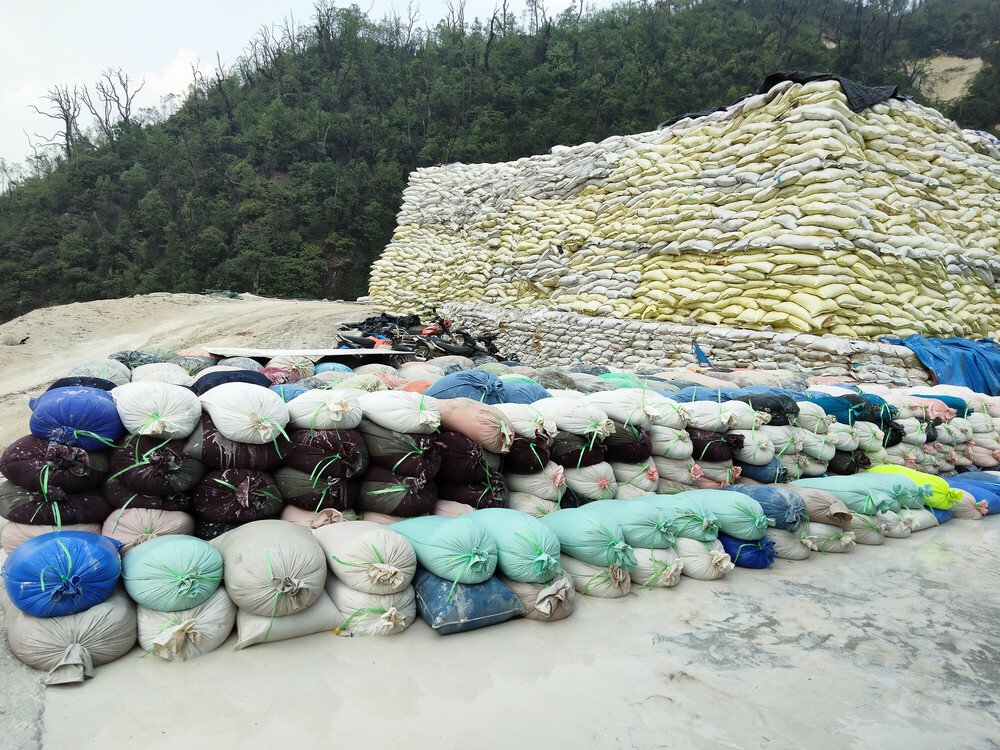
10 July 2024 (Global Witness) – Renewable energy is often hailed as a panacea for the energy crisis. But without better consultation and regulation, plans to expand mining for minerals central to the energy transition could be disastrous for people and the planet. To tackle the climate crisis, we need to transition away from fossil […]
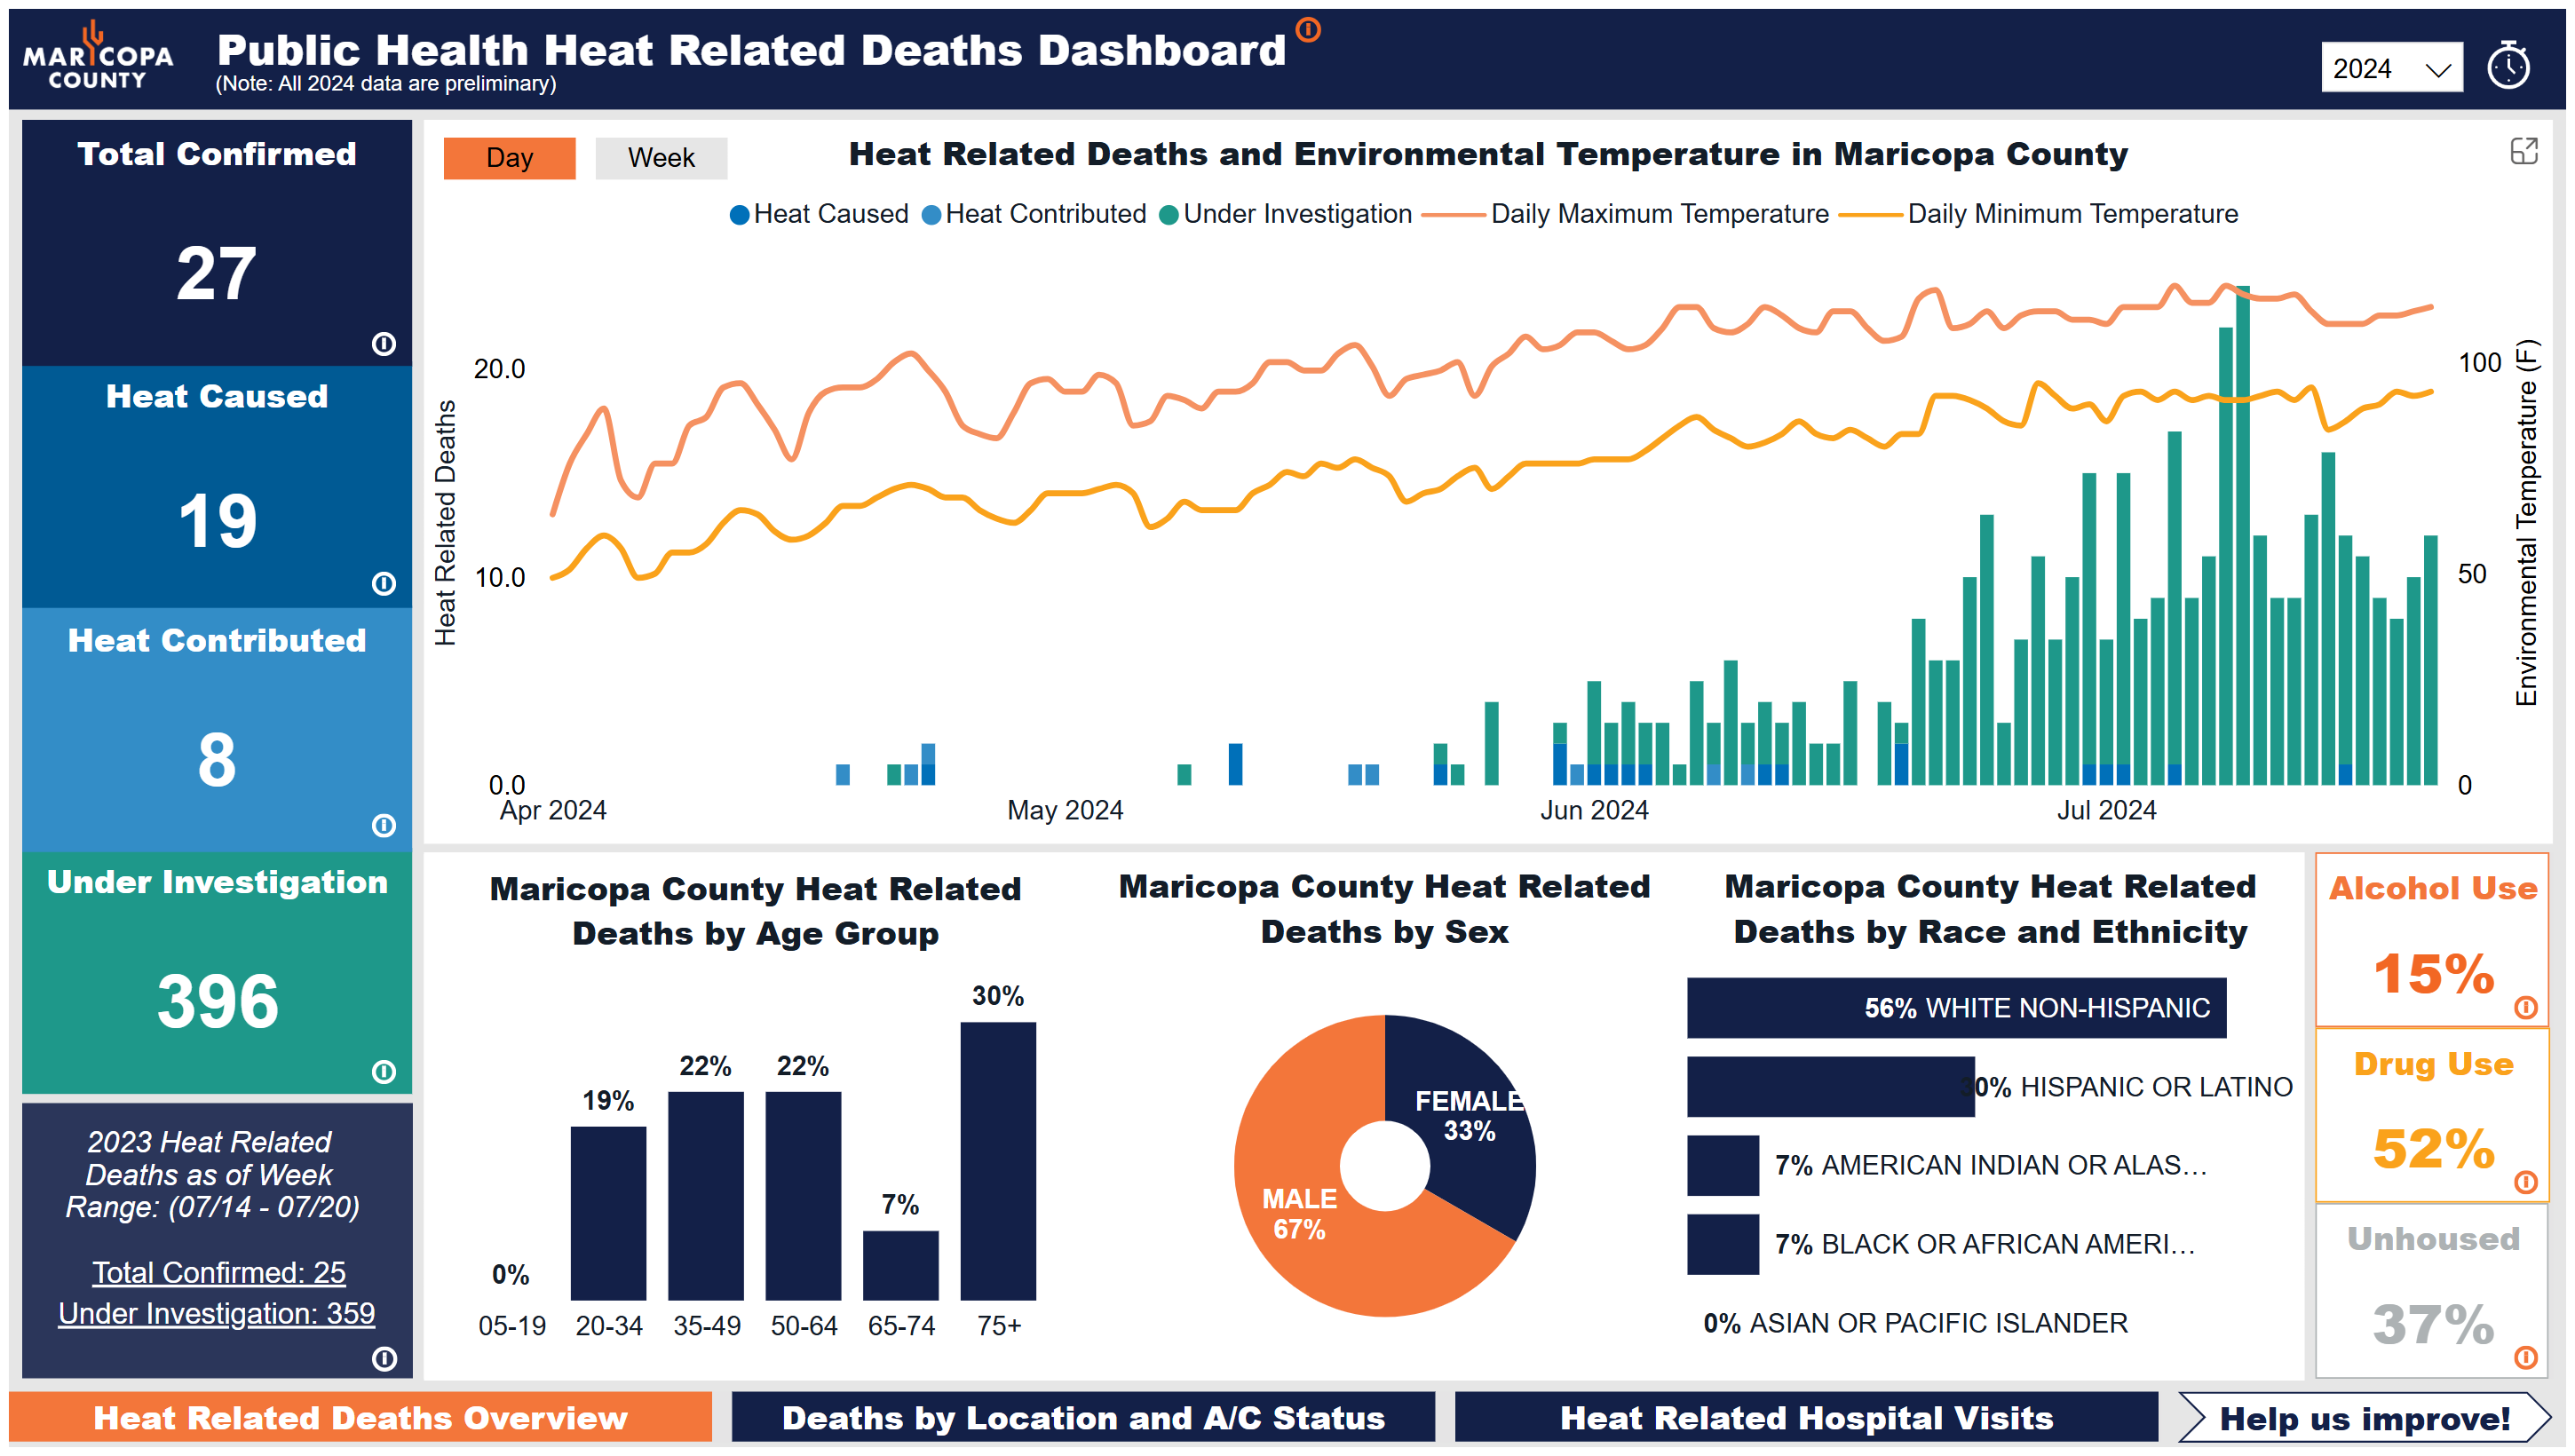
By Rachel Ramirez 24 July 2024 (CNN) – Hundreds of people may have died from heat in Arizona’s Maricopa County amid another record-breaking summer in the state. Heat has killed 27 people in the county, which is home to Phoenix, and is suspected as the cause of 396 other deaths so far this year, according to […]
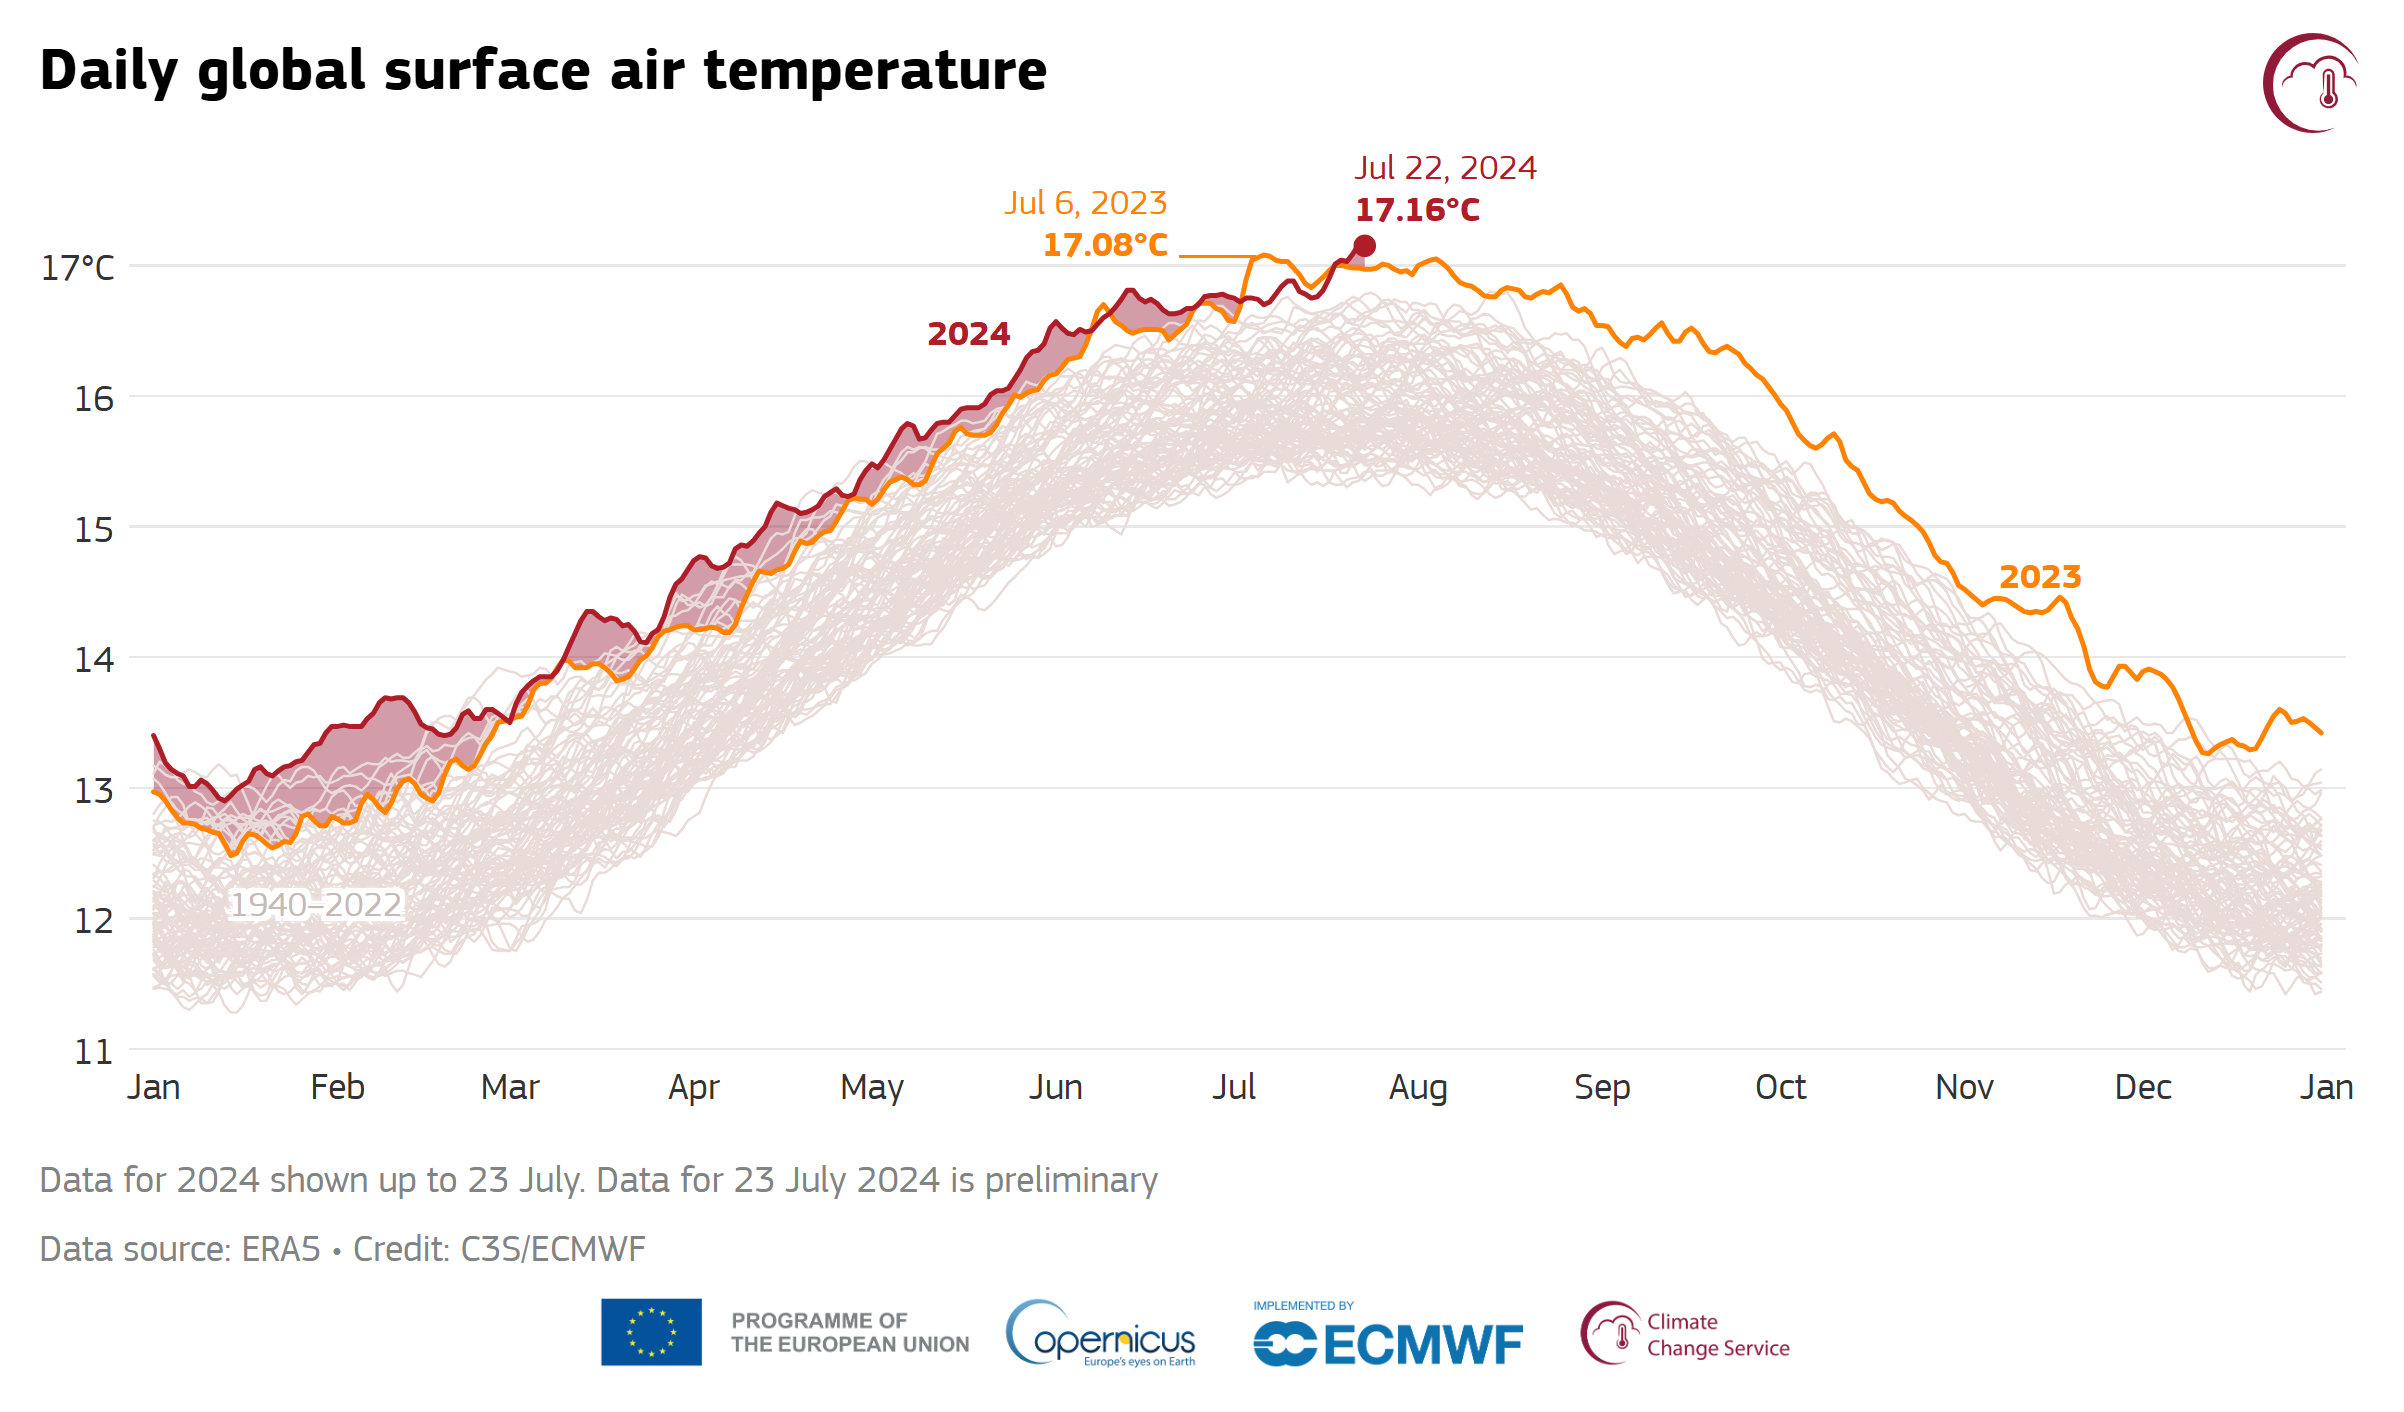
23 July 2024 (Copernicus Climate Change Service) – The Earth has just experienced its warmest day in recent history, according to the Copernicus Climate Change Service (C3S) data. On 22 July 2024, the daily global average temperature reached a new record high in the ERA5 dataset, at 17.16°C. This exceeds the previous records of 17.09°C, […]
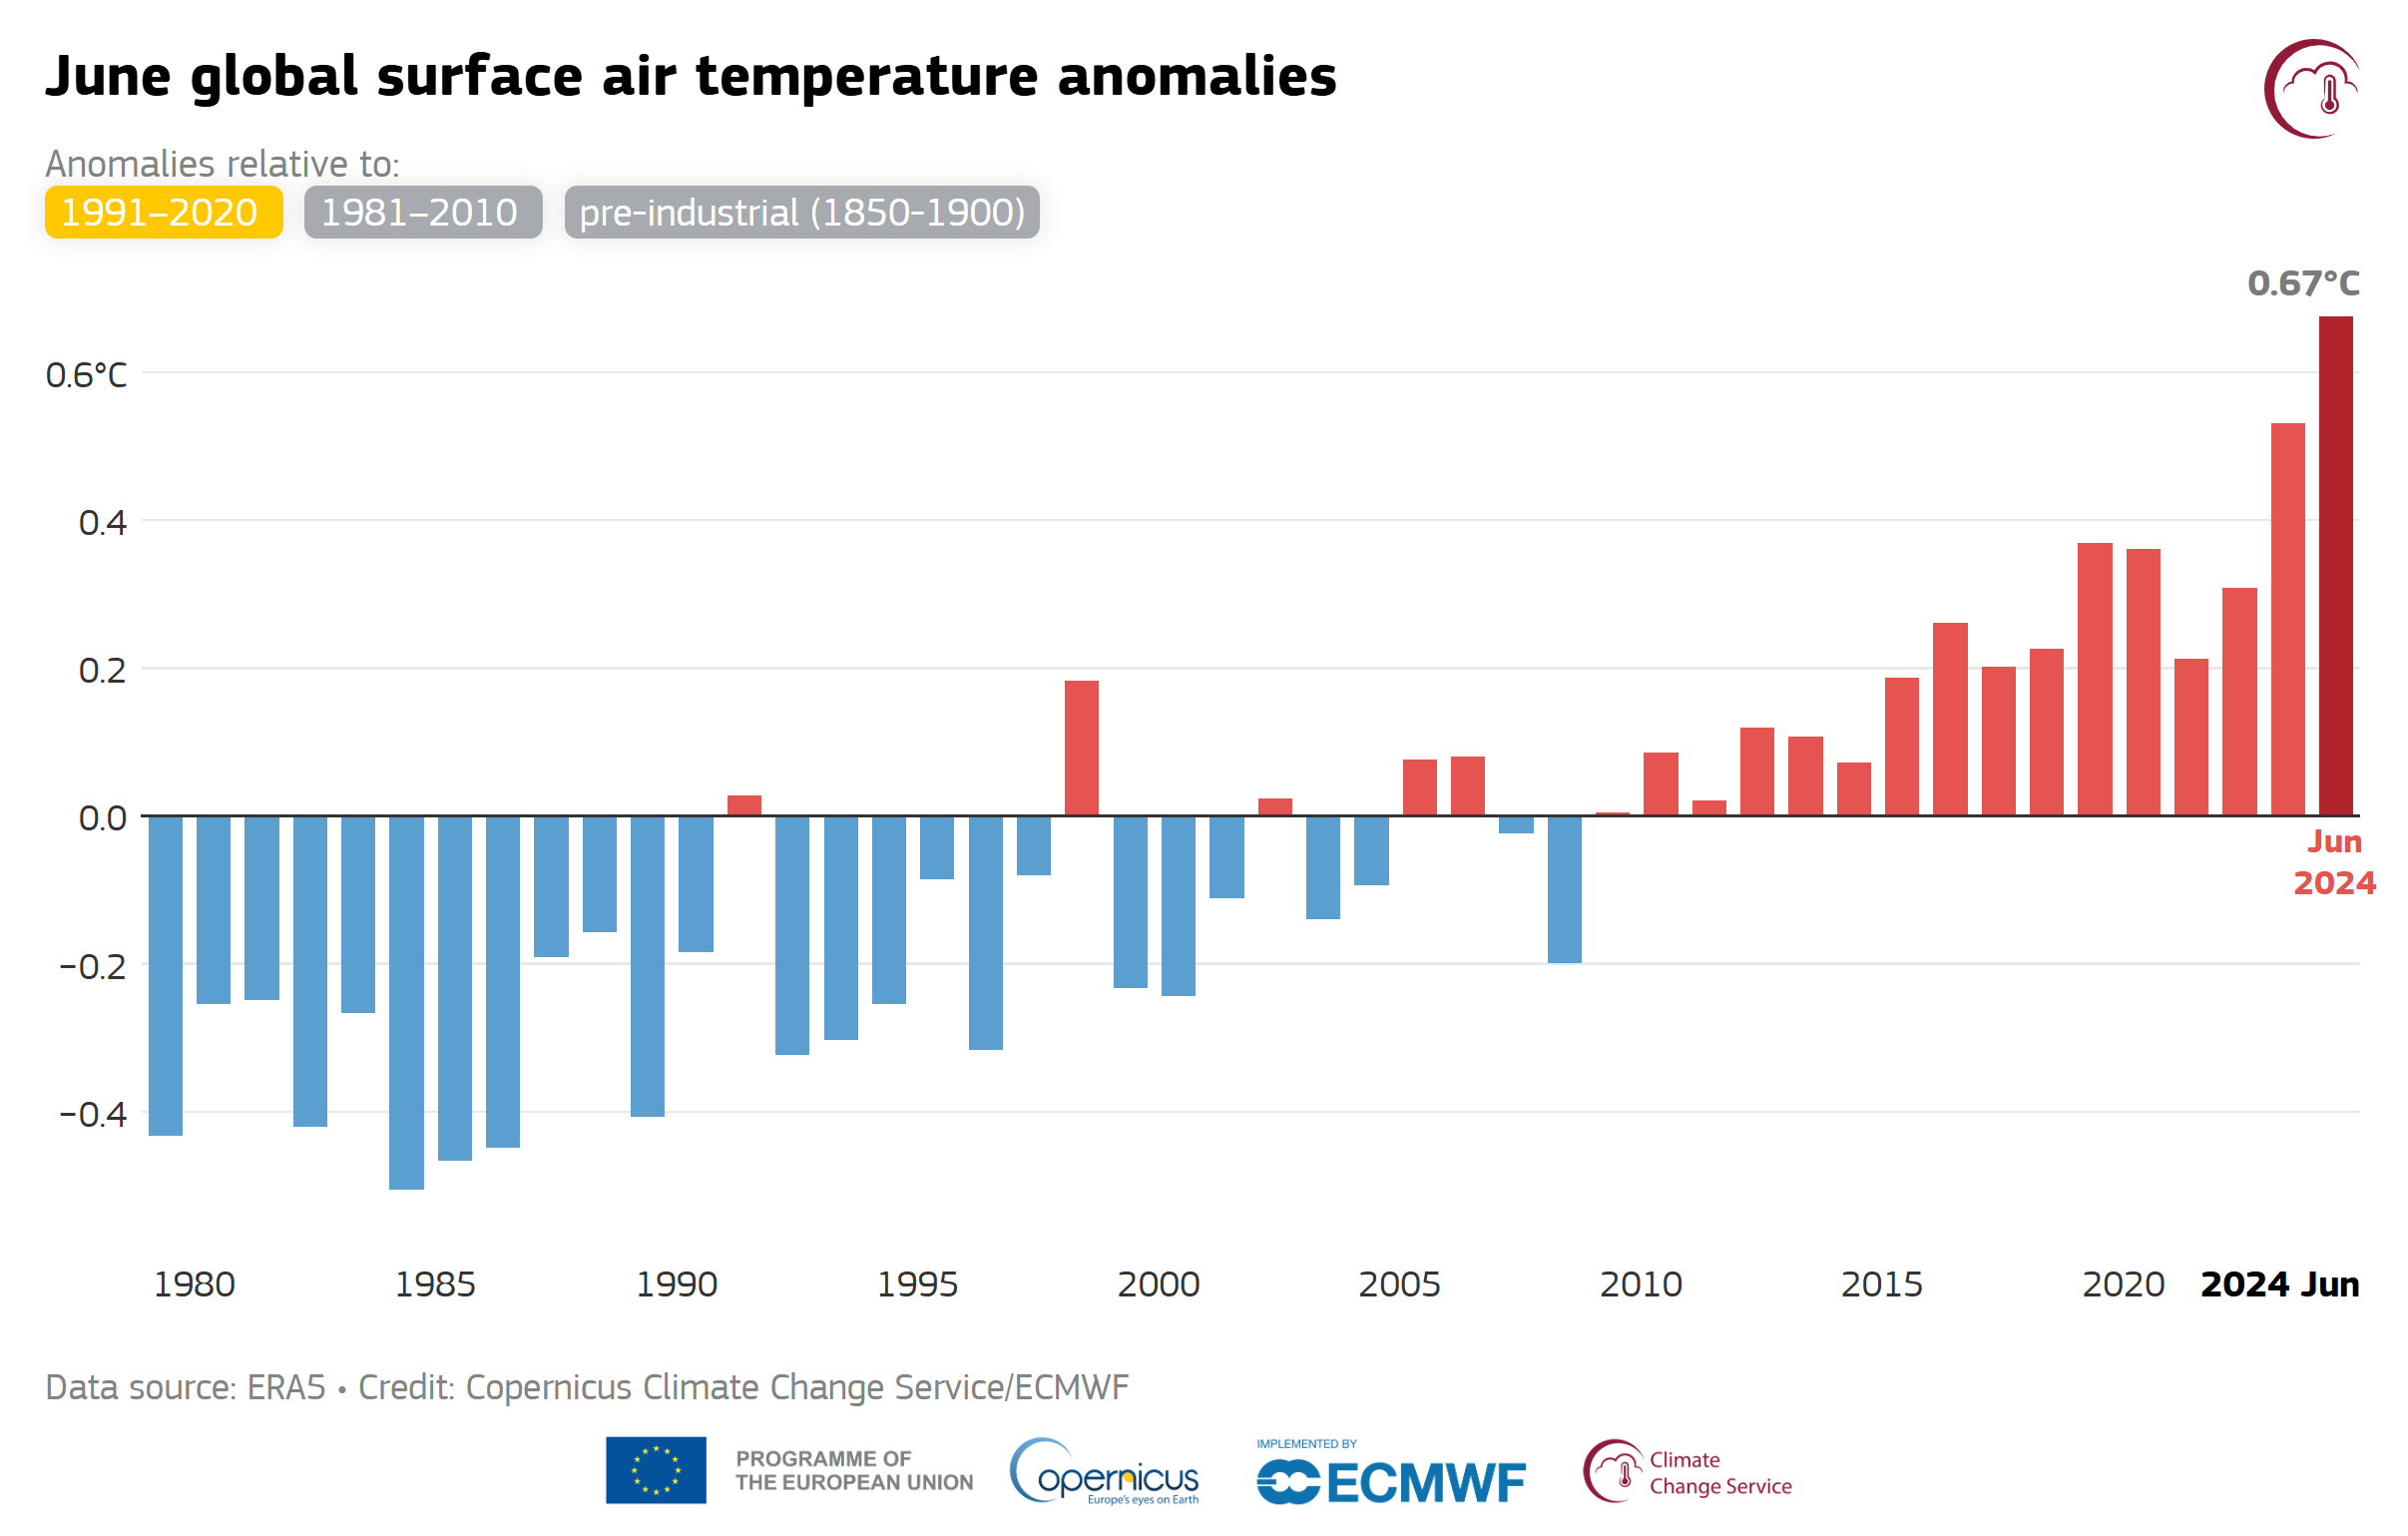
By Seth Borenstein 7 July 2024 (AP) – Earth’s more than year-long streak of record-shattering hot months kept on simmering through June, according to the European climate service Copernicus. There’s hope that the planet will soon see an end to the record-setting part of the heat streak, but not the climate chaos that has come […]
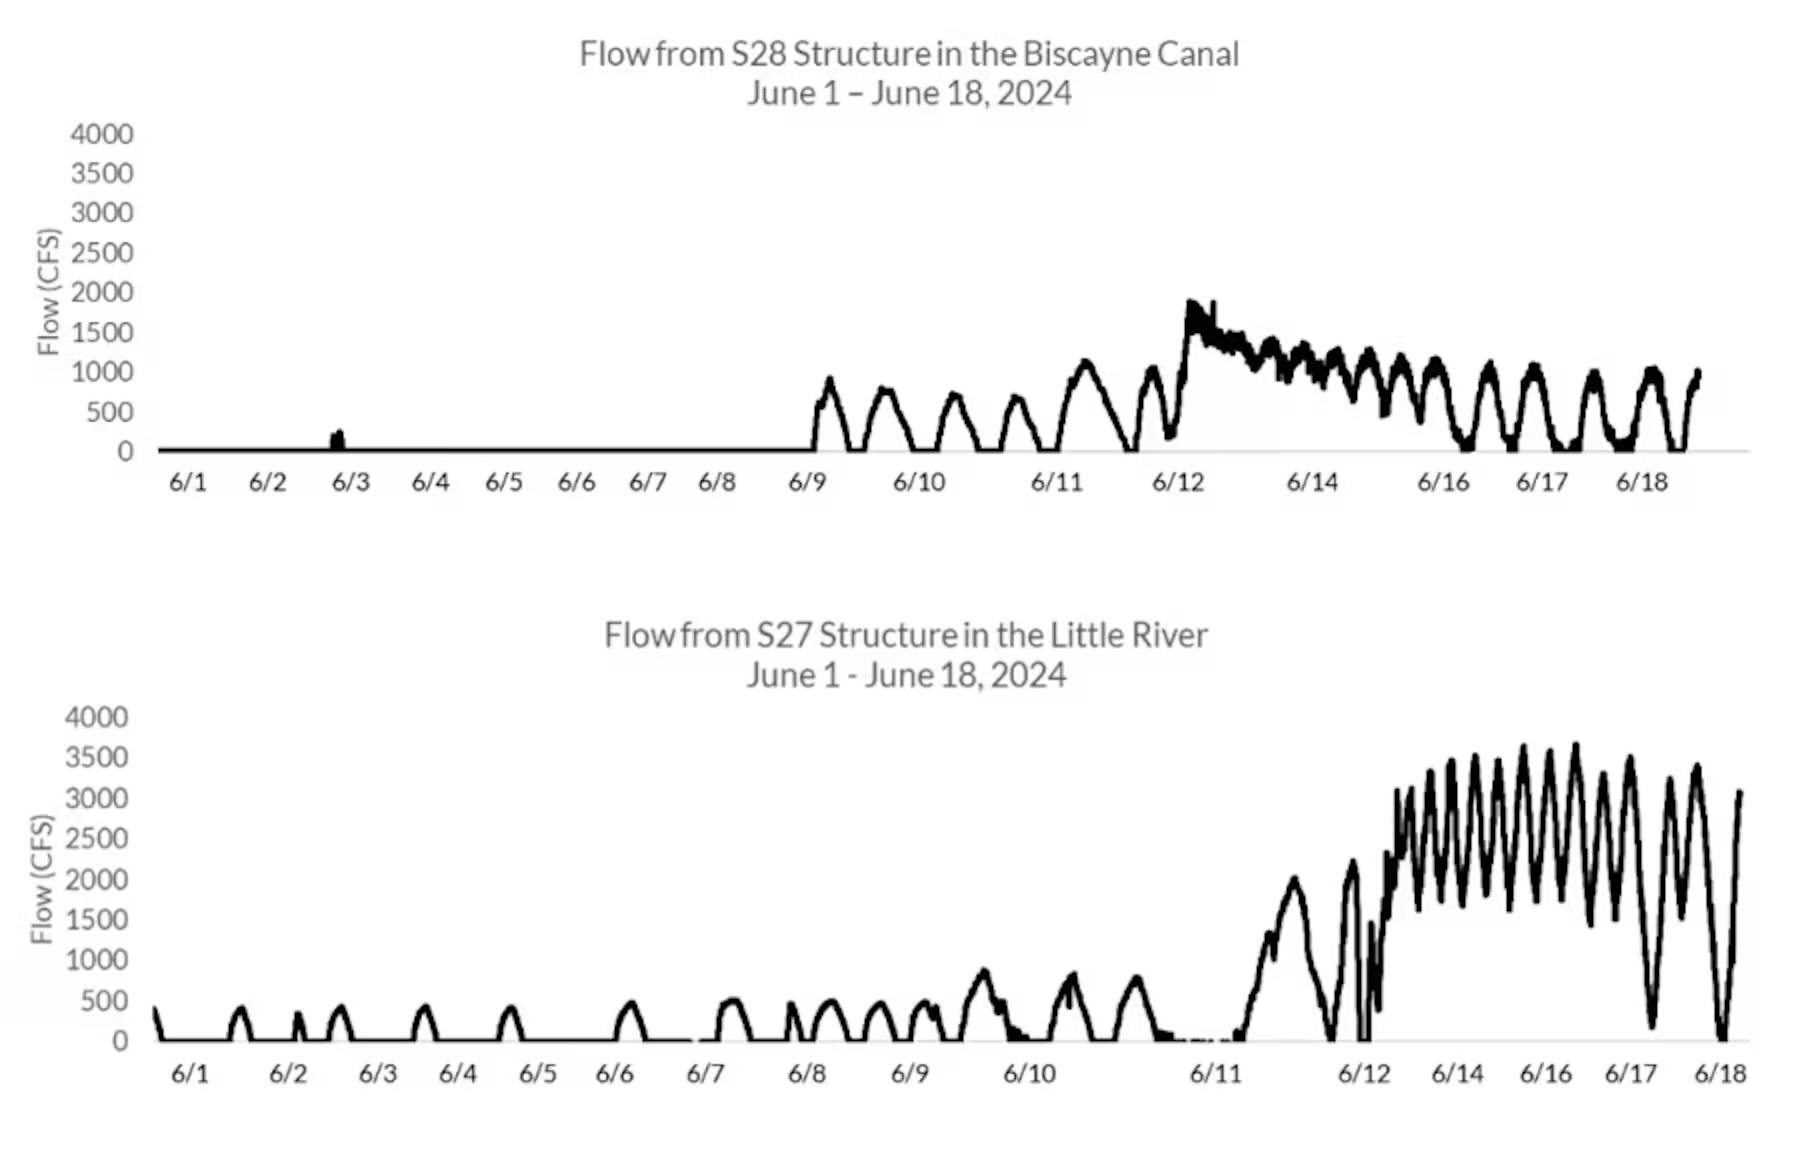
By Margaret Wong 23 July 2024 (The Cool Down) – Biscayne Bay is reeling from its fourth major fish kill in as many years, triggered by recent record flooding in South Florida. What’s happening? Torrential rains have inundated the region, causing a significant influx of freshwater into the bay, which has led to low salinity […]
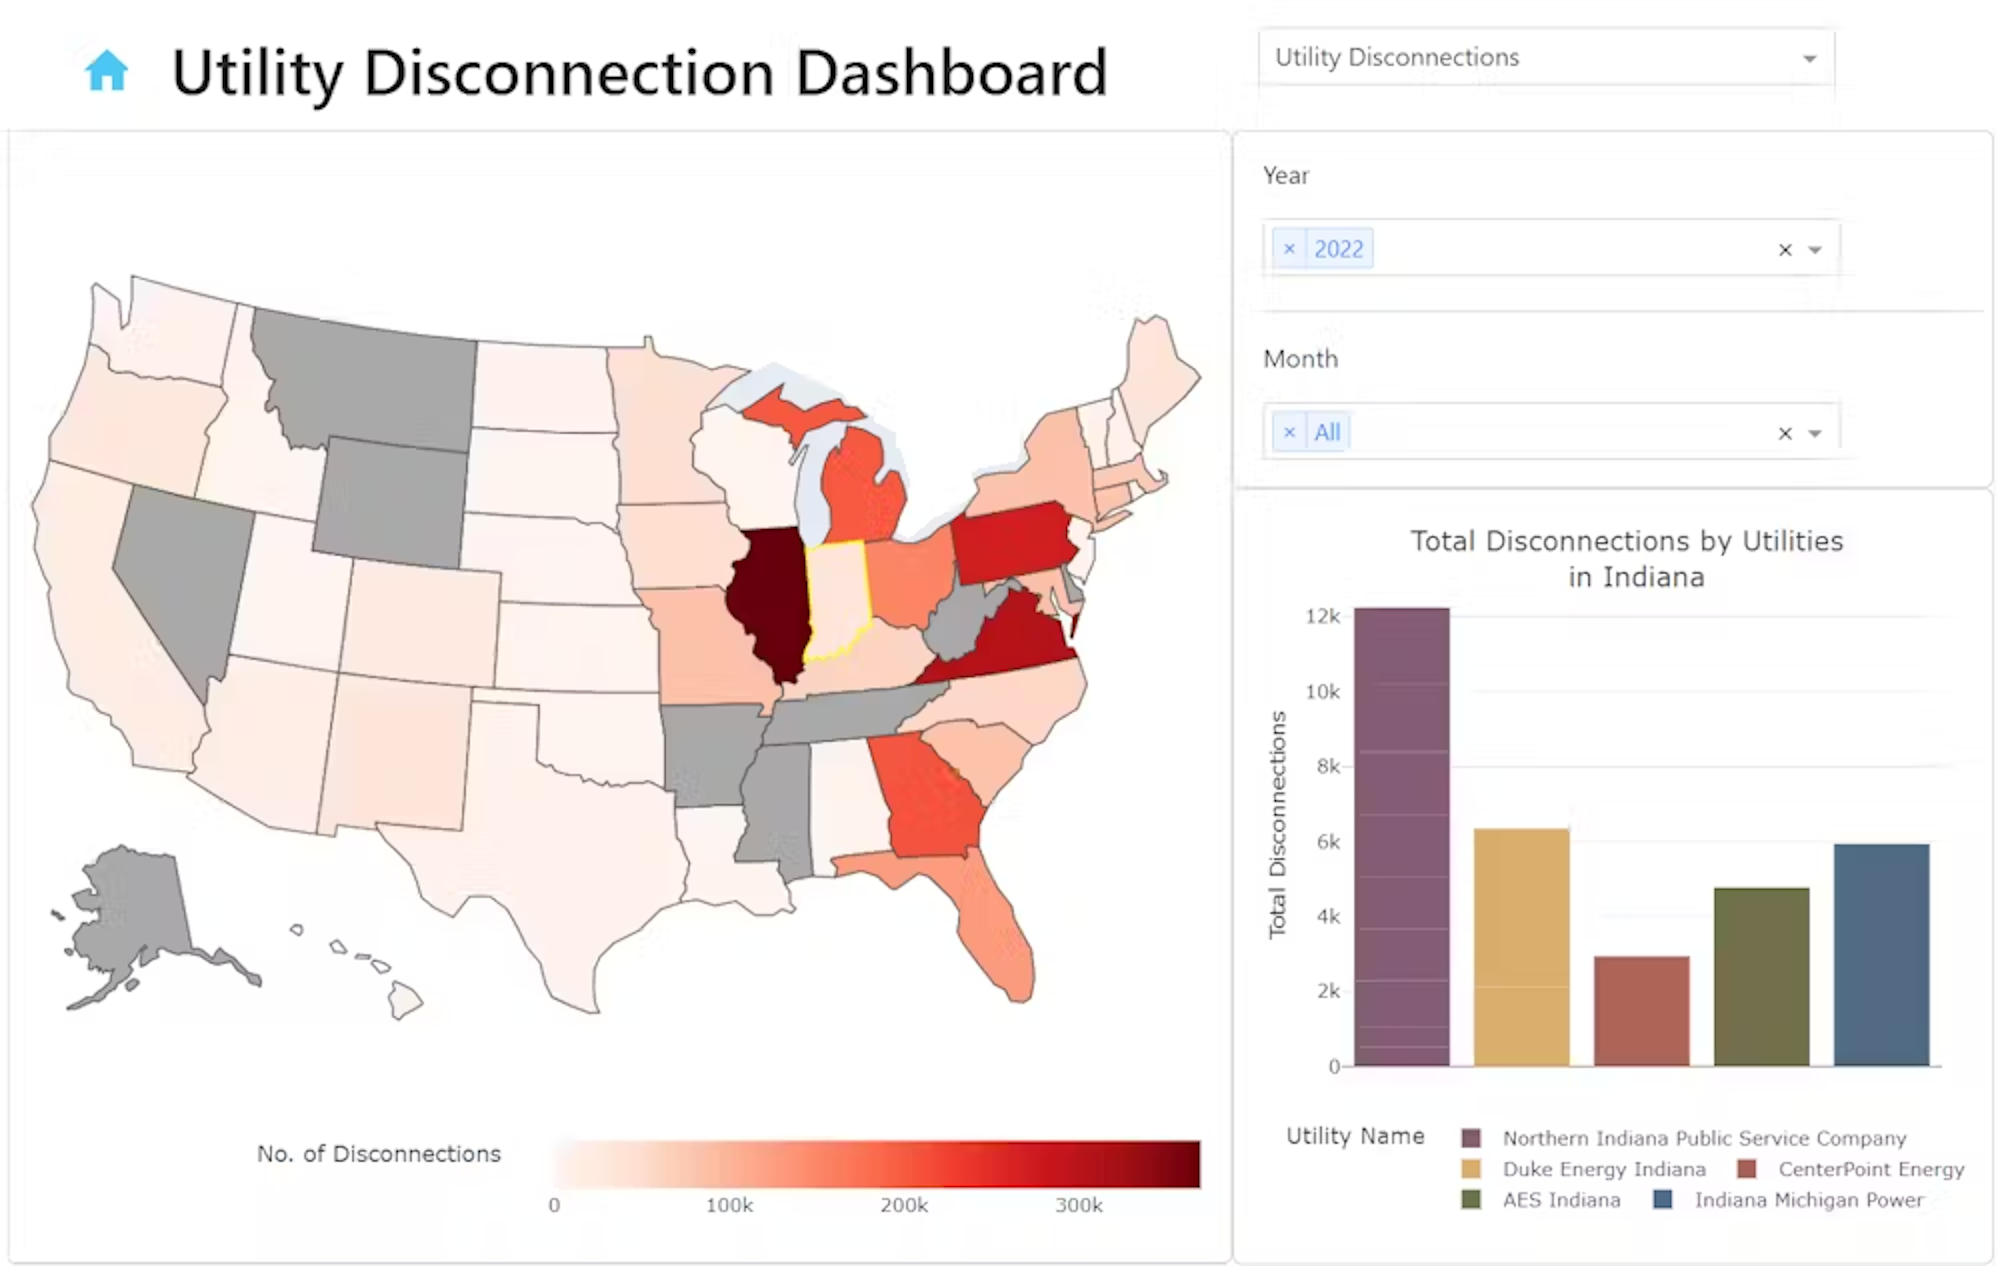
By Sanya Carley and David Konisky 5 July 2024 (The Conversation) – Millions of Americans have been sweltering through heat waves in recent weeks, and U.S. forecasters warn of a hot summer ahead. Globally, 2023 saw the warmest June on record, according to the European Union’s climate change service. That heat continued into July, with some of […]
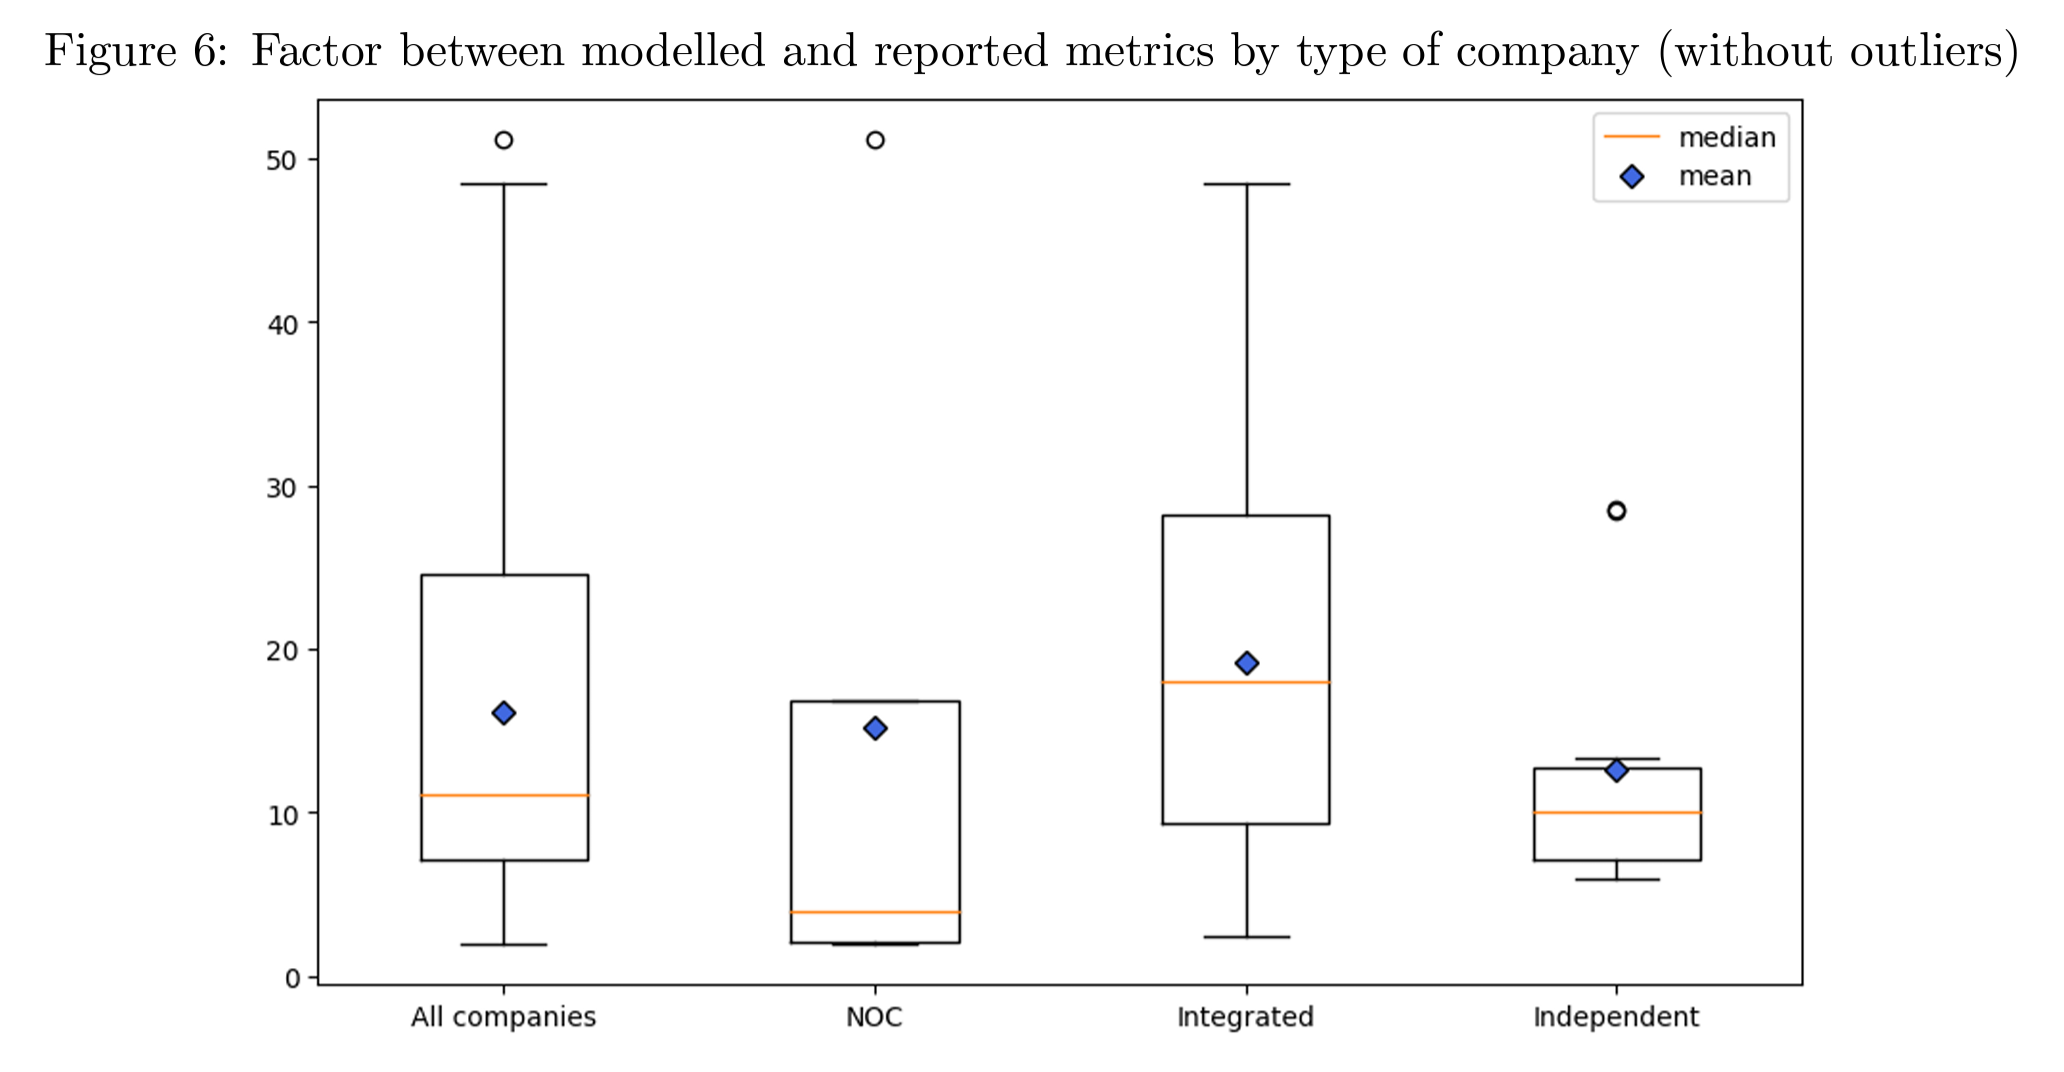
By Antoine Rostand 17 July 2024 (Fortune) – Committing countries or companies to climate pledges doesn’t guarantee that those pledges will be honored. After all, the planet is getting a great deal hotter every year, with the record-breaking temperature in India in May just the latest example. If companies and countries were fully honoring their […]
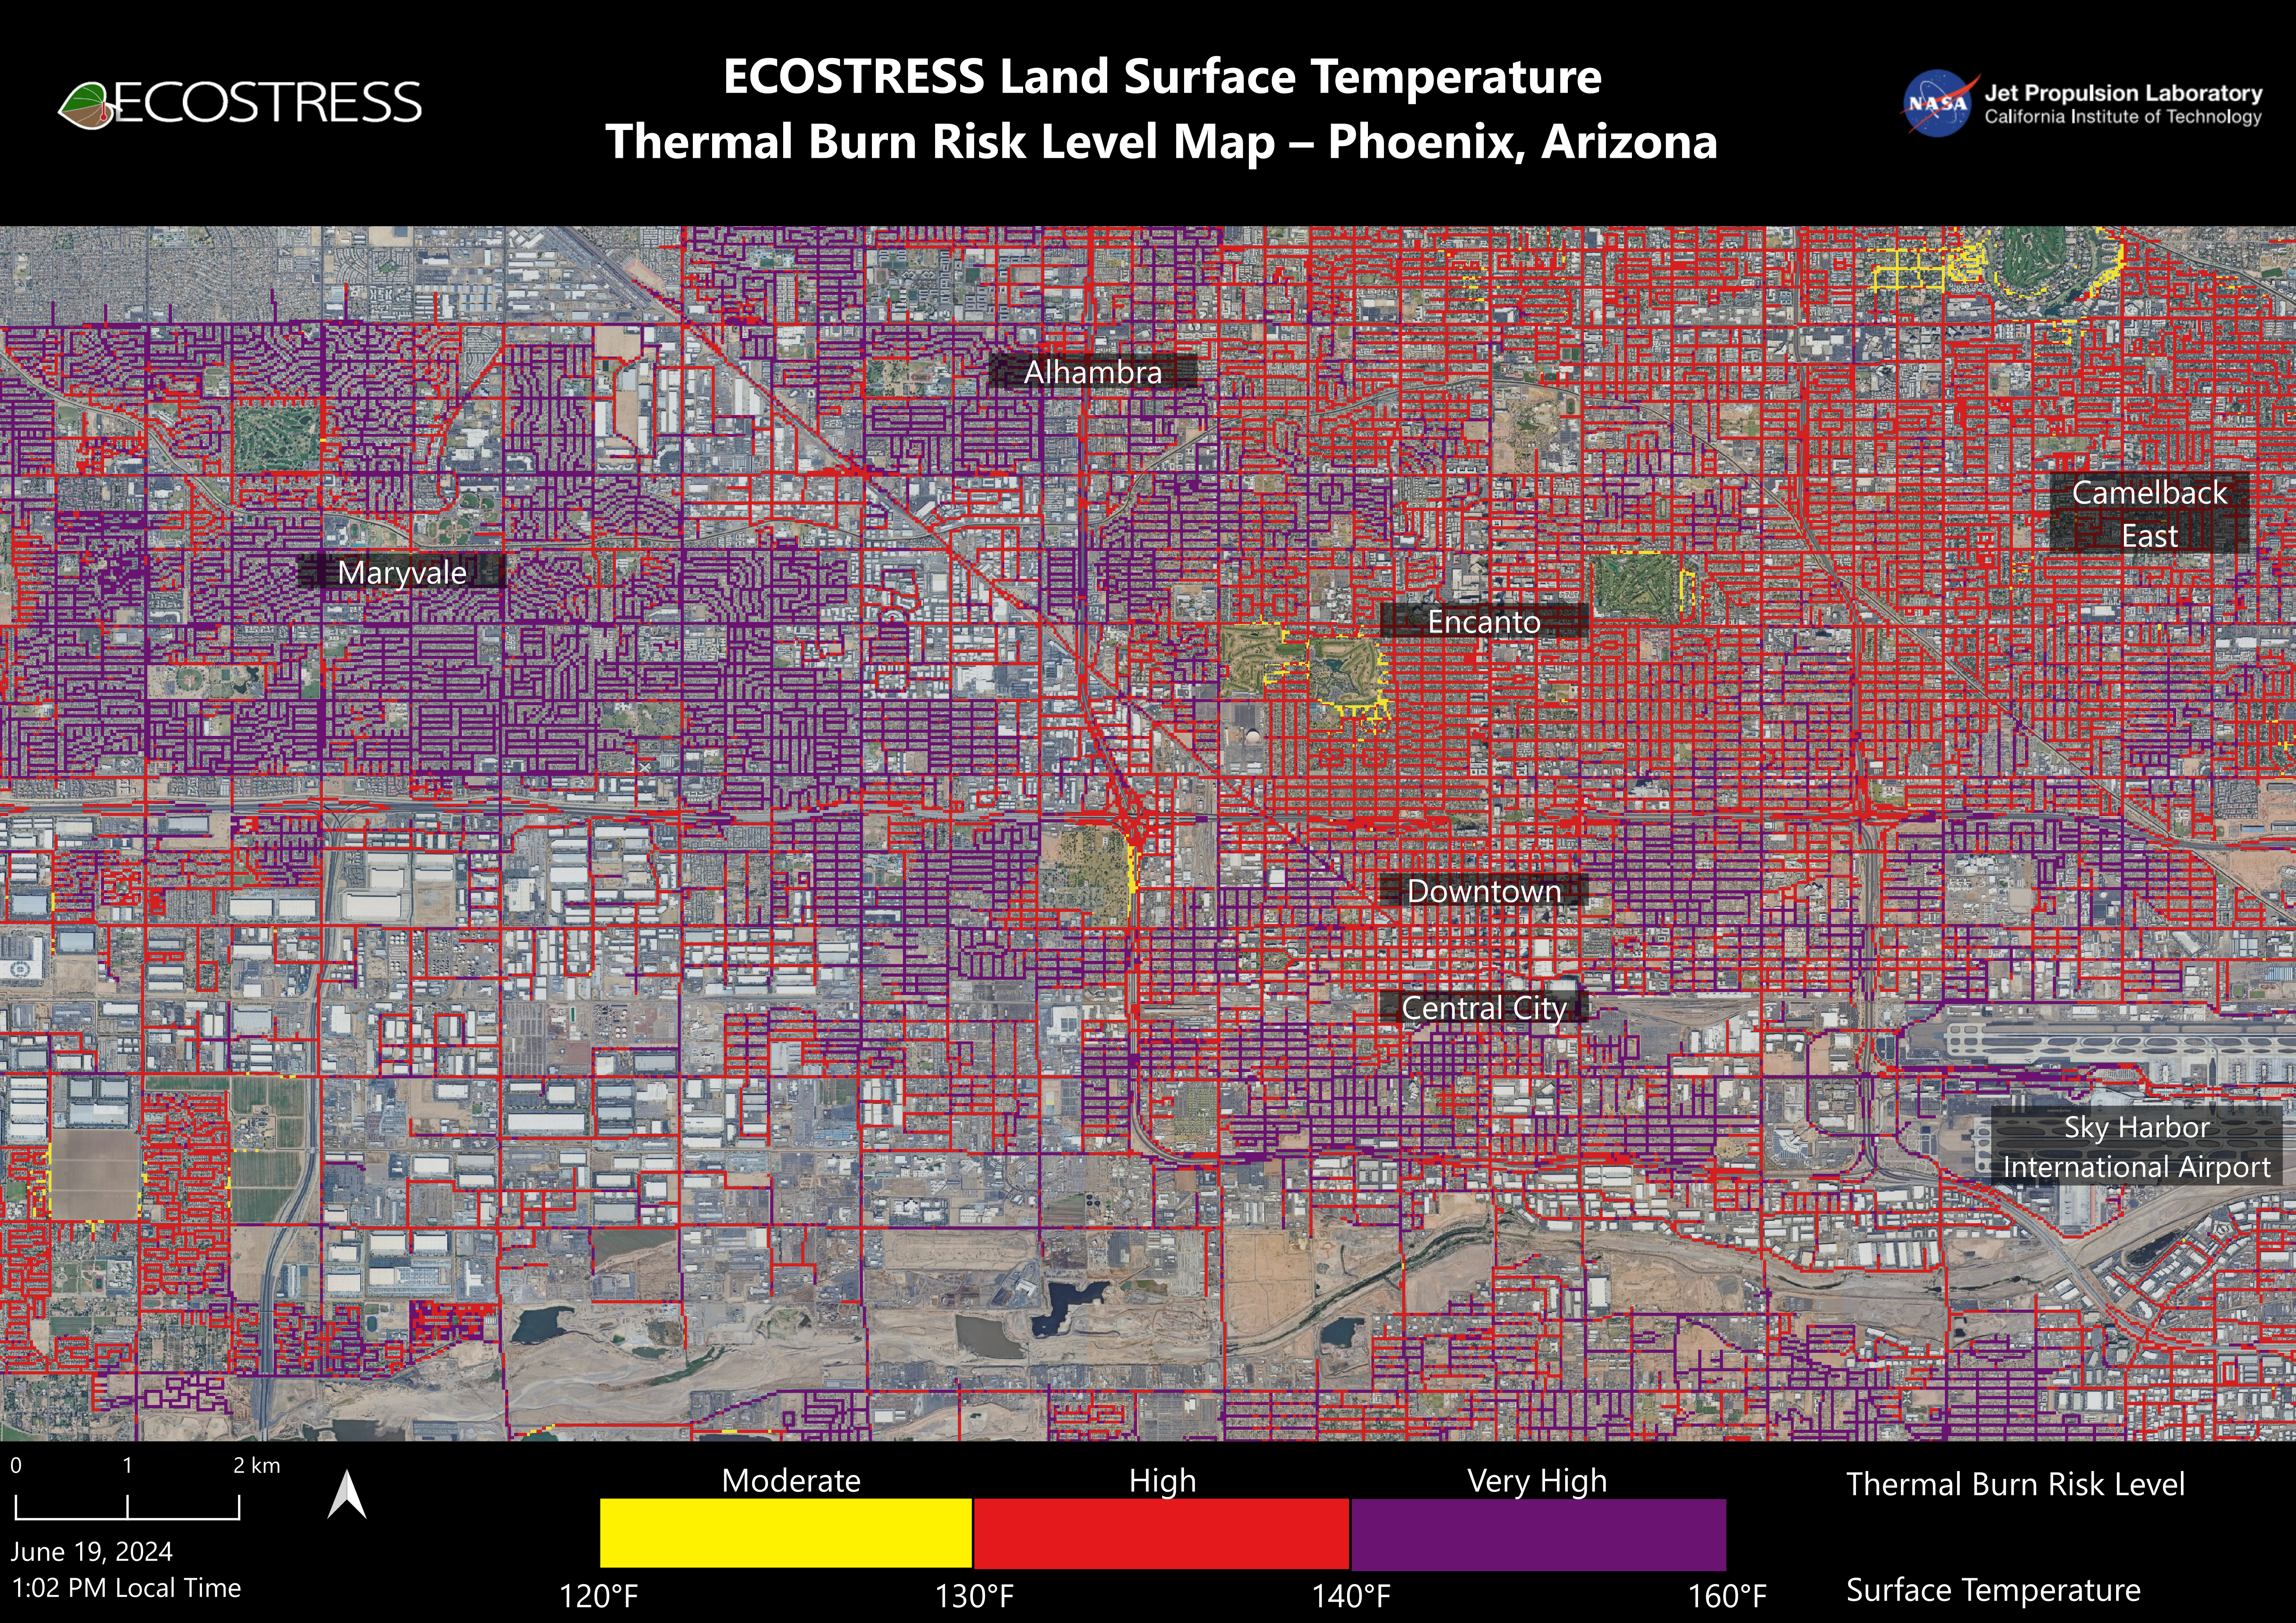
By Jessica Boehm 10 July 2024 (Axios) – Many Phoenix streets and sidewalks can reach 160° during the hottest parts of the day, according to a new NASA analysis. Why it matters: Surfaces that hot can cause contact burns in seconds, and Valley hospitals are seeing an uptick in patients with serious burn injuries. The big picture: Human-caused climate […]
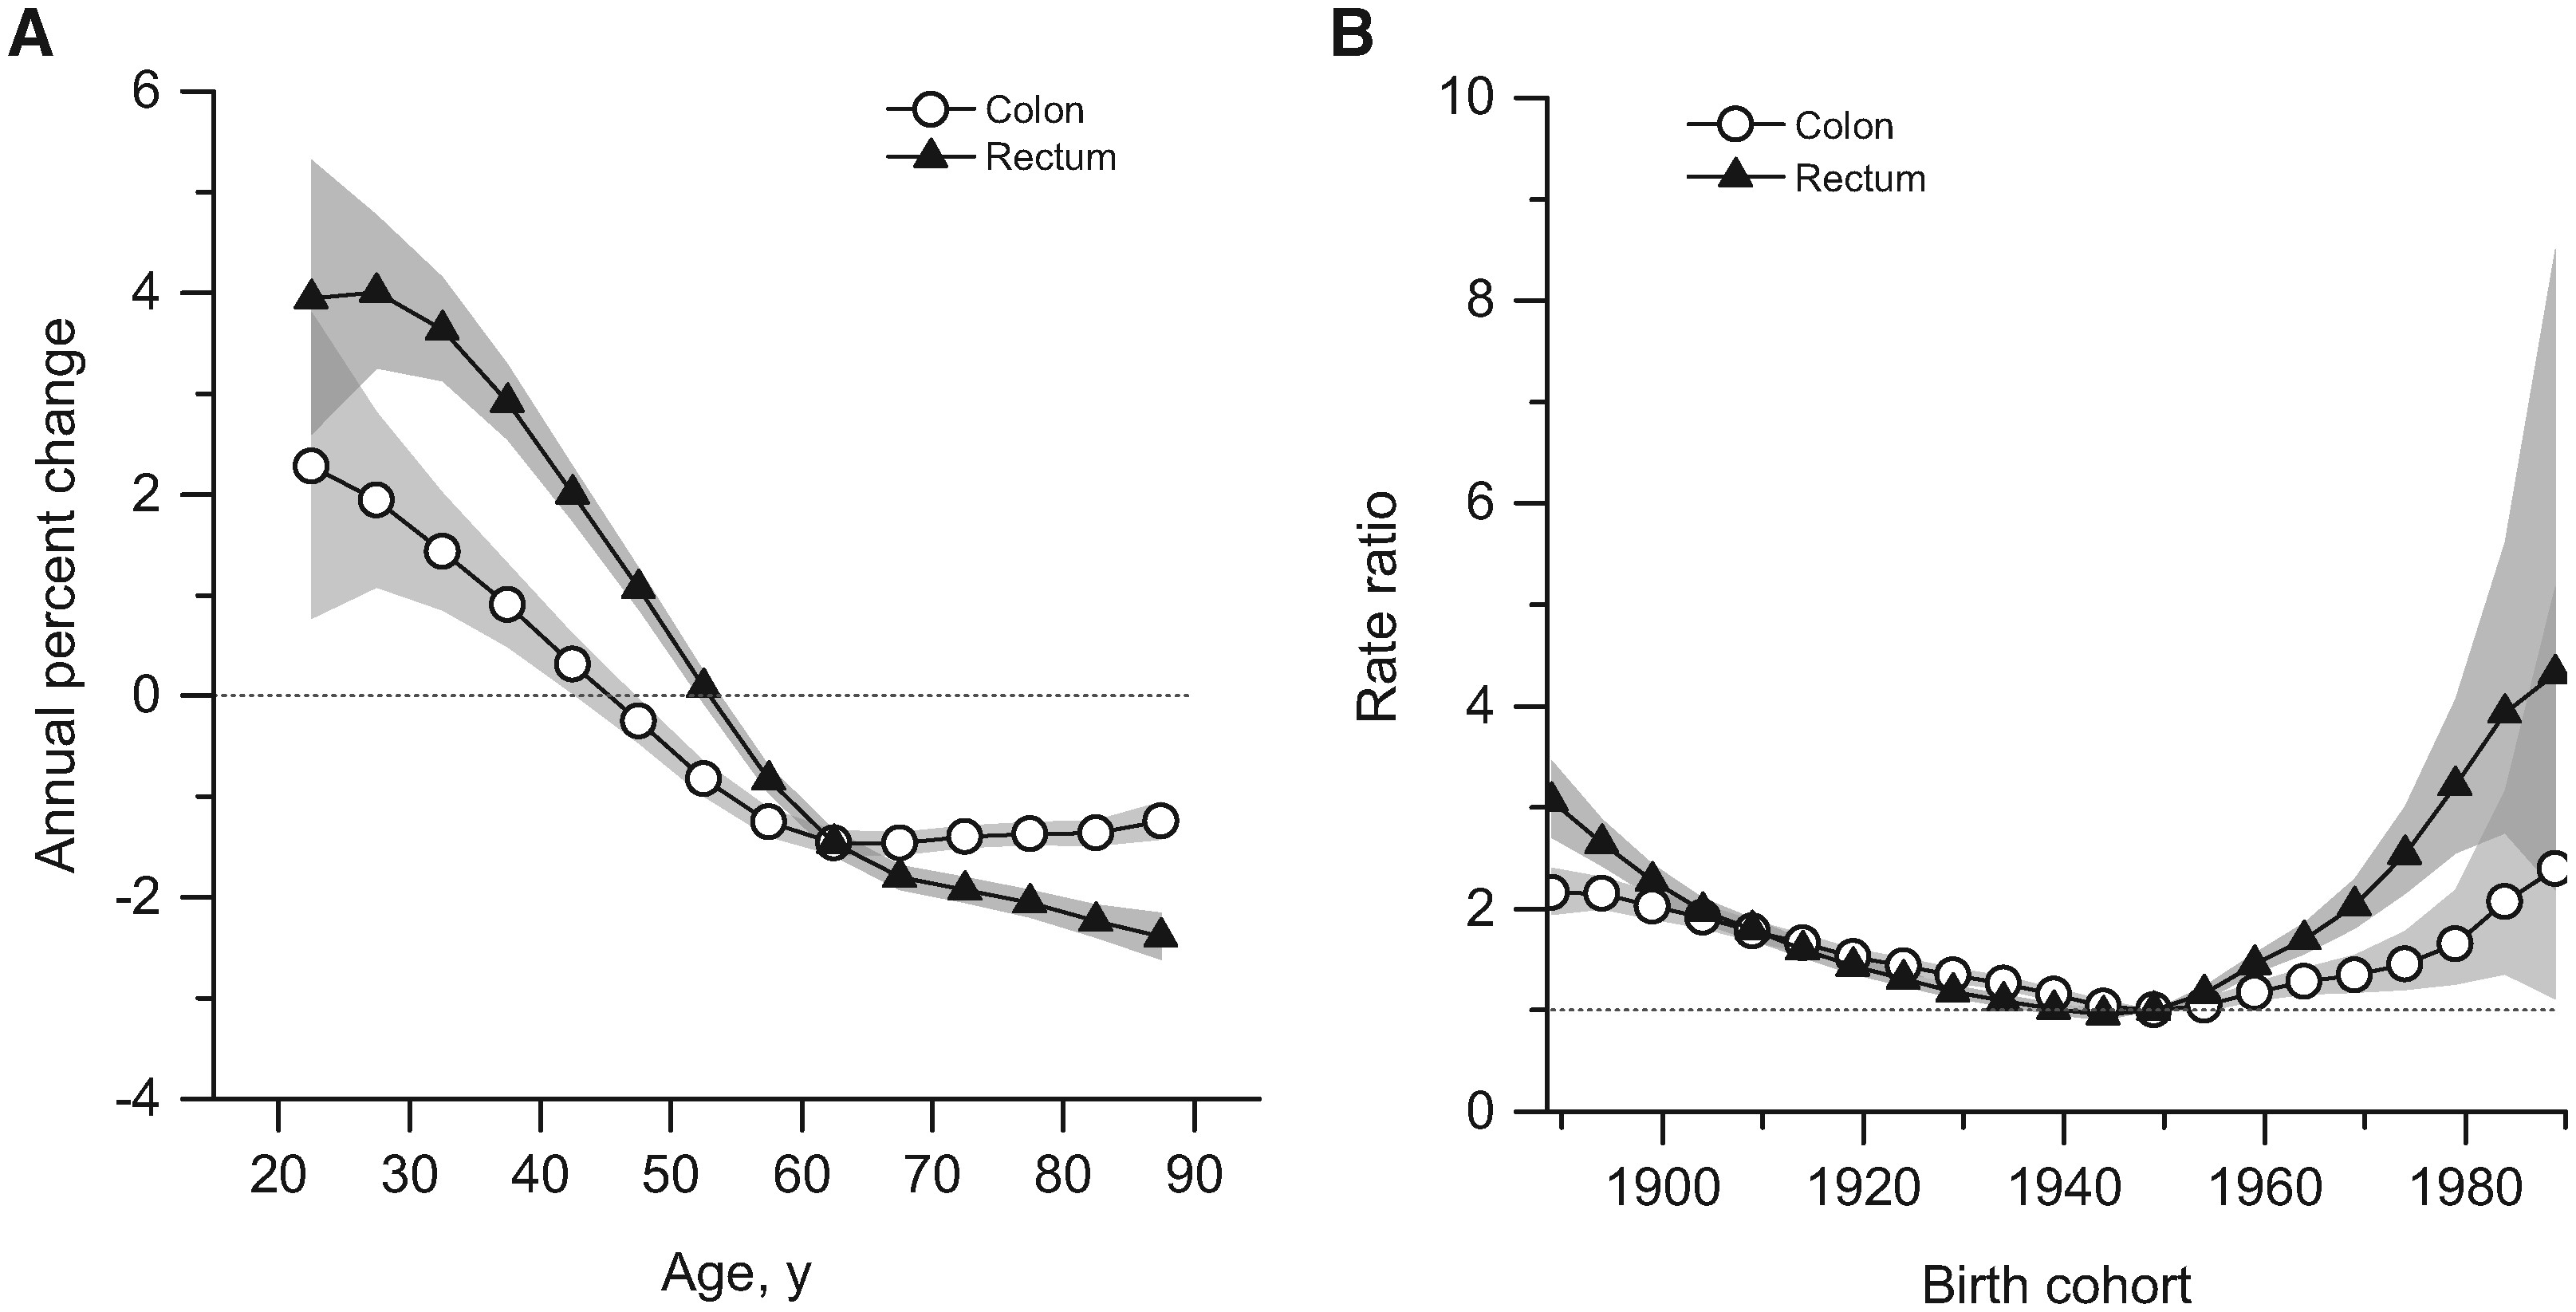
By Brianna Abbott 11 January 2024 (The Wall Street Journal) – Meilin Keen was studying for the bar exam and preparing to move to New York City last June when she started throwing up blood. Keen, 27 years old, learned days later that she has gastric cancer. She postponed the bar exam. Brain fog from […]
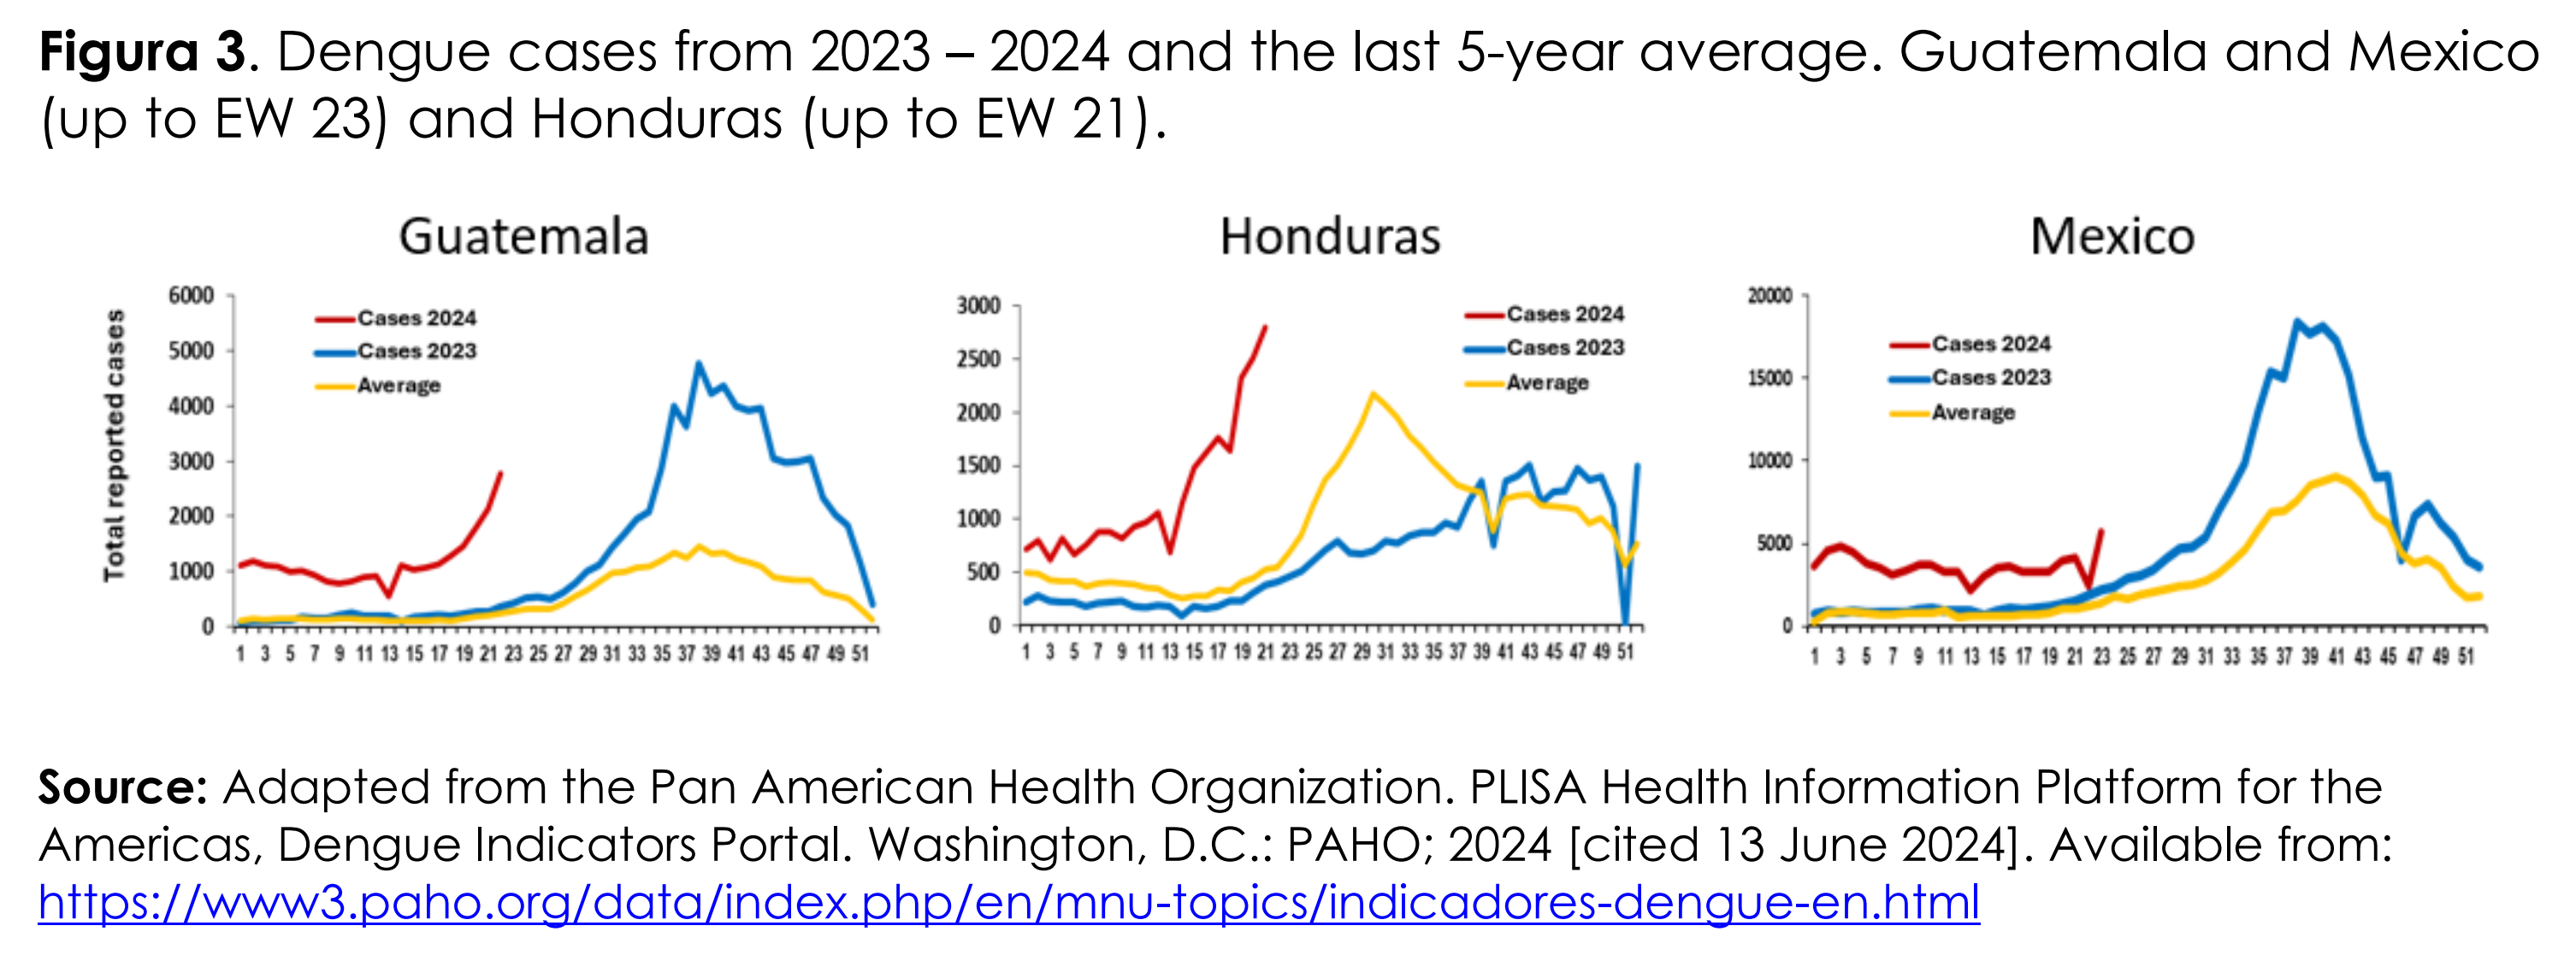
By Finn Cohen 27 June 2024 (Healthline) – As cases of dengue fever rise worldwide, the Centers for Disease Control and Prevention (CDC) issued an advisory for physicians, public health authorities, and the public in the United States to be alert to the trend. So far in 2024, cases of dengue fever in countries in the Americas have reached record-breaking […]