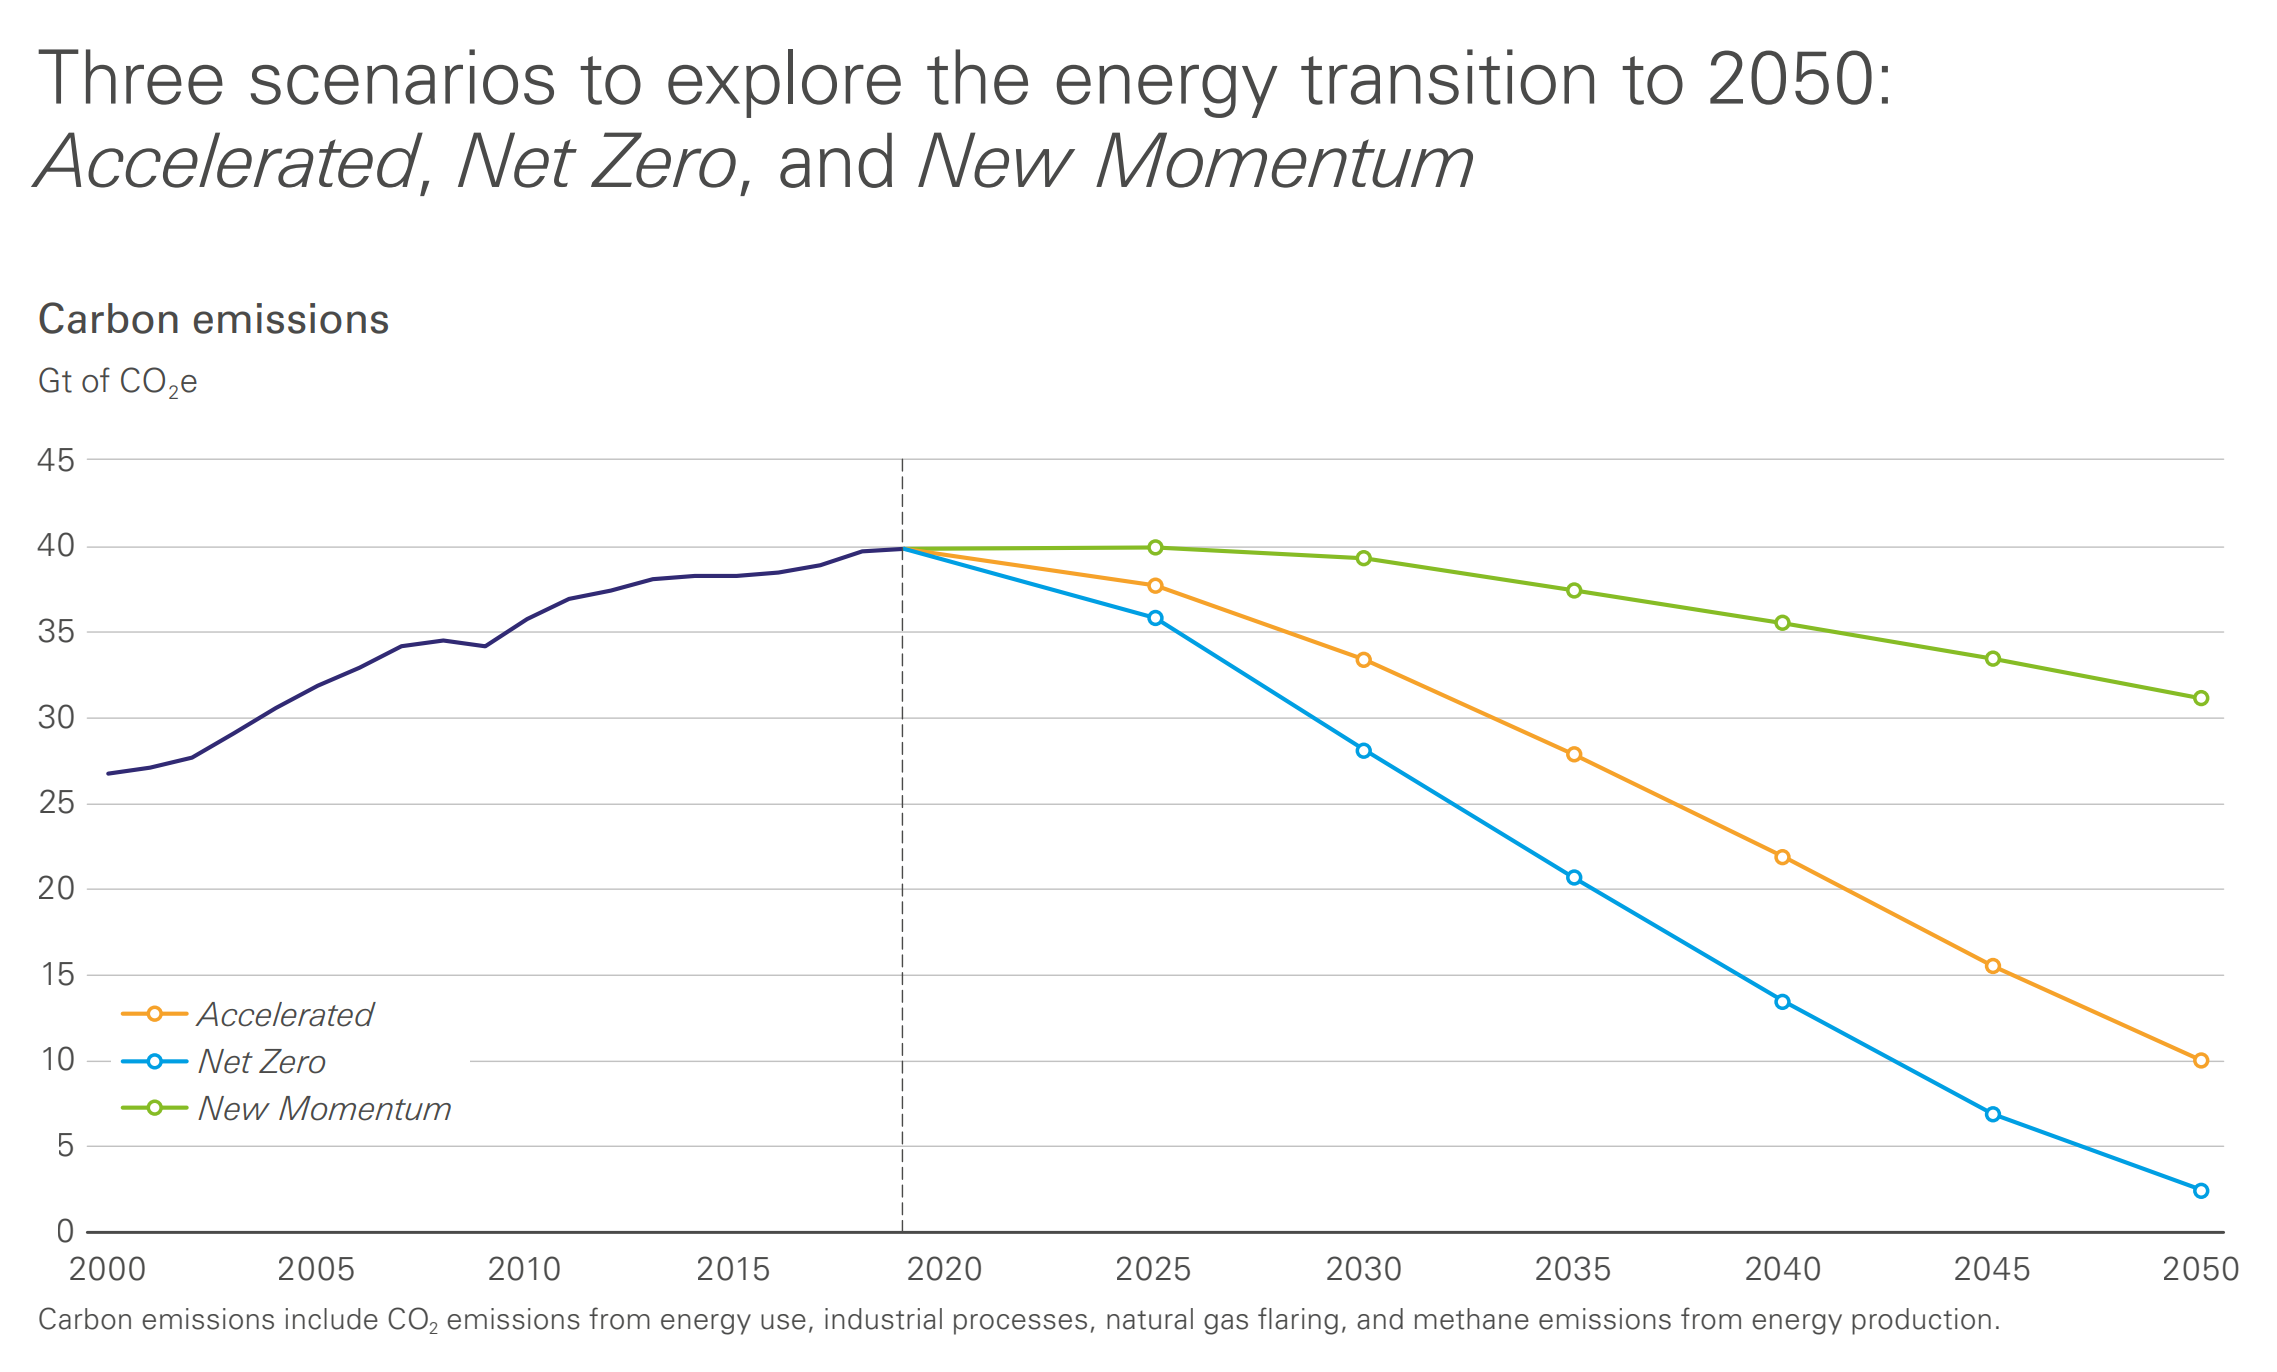
Carbon emissions projected to 2050 in three scenarios: Accelerated, Net Zero, and New Momentum. BP’s Energy Outlook 2022 uses three main scenarios (Accelerated, Net Zero, and New Momentum) to explore the range of possible pathways for the global energy system to 2050 and help shape a resilient strategy for BP. Graphic: BP

BP Energy Outlook 2022 edition – The carbon budget is finite, and it is running out

By Spencer Dale 14 March 2022 (BP) – At the time of writing, the world’s attention is focussed on the terrible events taking place in Ukraine. Our thoughts and hopes are with all those affected. The scenarios included in Energy Outlook 2022 were largely prepared before the outbreak of the military action and do not include any […]

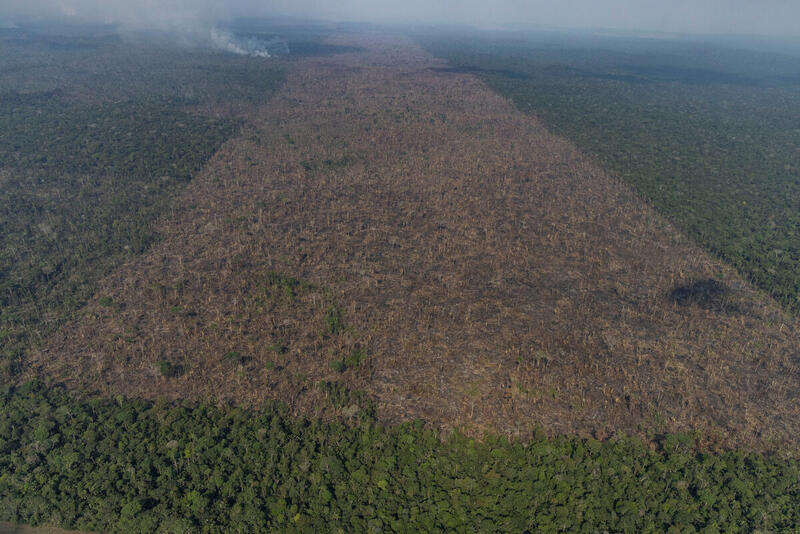
Aerial view of an area in the Amazon deforested for the expansion of livestock, in Lábrea, Amazonas state. The Amazon is still covered in smoke and torn by criminal and unrestrained destruction, according to overflights produced by the Amazon in Flames Alliance, organized by Amazon Watch, Greenpeace Brazil and the Brazilian Climate Observatory. The expedition took place between September 13th and 17th 2021, in the cities of Porto Velho (Rondônia state) and Lábrea (southern Amazonas state). Photo: Victor Moriyama / Amazônia em Chamas / Greenpeace

Brazil detects record Amazon deforestation in January and February 2022 – Forest destruction rate in 2021 was highest in ten years

By David Biller 11 March 2022 RIO DE JANEIRO (AP) – Detected deforestation in the Brazilian Amazon reached a record high for the month of February following a similar record the prior month. Satellite alerts of deforestation in February corresponded to 199 square kilometers (77 square miles), the highest indicator for that month in seven […]

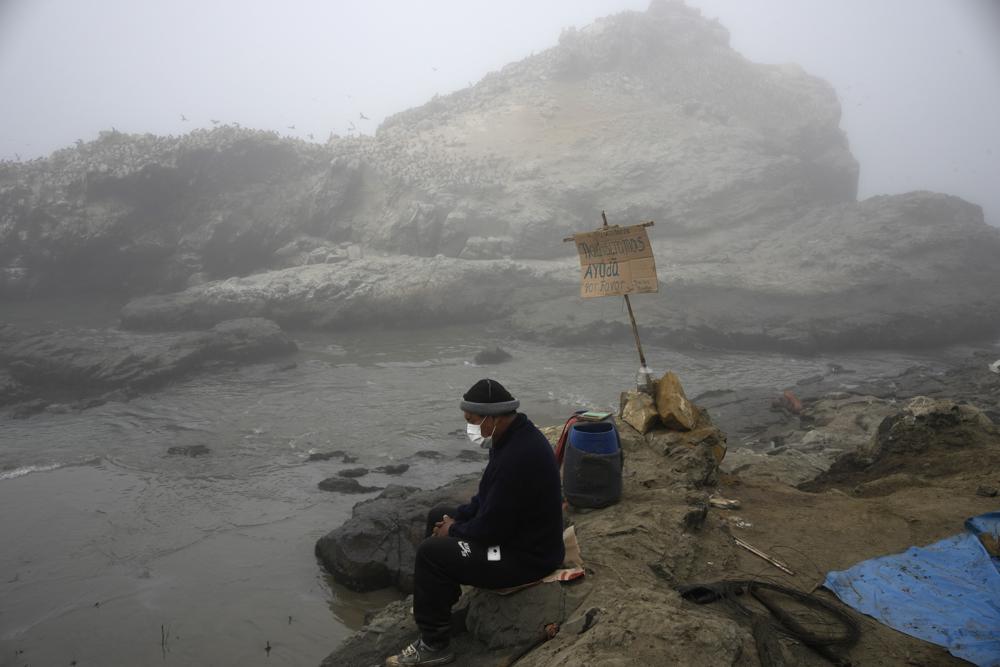
Fisherman Walter de la Cruz sits on the shore of the oil-stained Cavero Beach, unable to fish after a spill in the Ventanilla district of Callao, Peru, 21 January 2022. De la Cruz, 60, is one of more than 2,500 fishermen whose livelihoods have been cast into doubt as a result of a large crude-oil spill by the Spanish-owned Repsol oil refinery on 15 January 2022. Photo: Martin Mejia / AP Photo

Peru’s “worst ecological disaster” slams small-scale fishing – “I saw the fruits of my livelihood destroyed. It’s like if you have a store and someone comes and sets it on fire.”

By Franklin Briceño 13 March 2022 CIUDAD PACHACUTEC, Perú (AP) – Walter de la Cruz scrambled down a large sand dune in the fog to reach a rock overlooking the Pacific Ocean, where he has fished for three decades. He cast a hook into the waters off Peru’s coast several times, with no luck. One […]

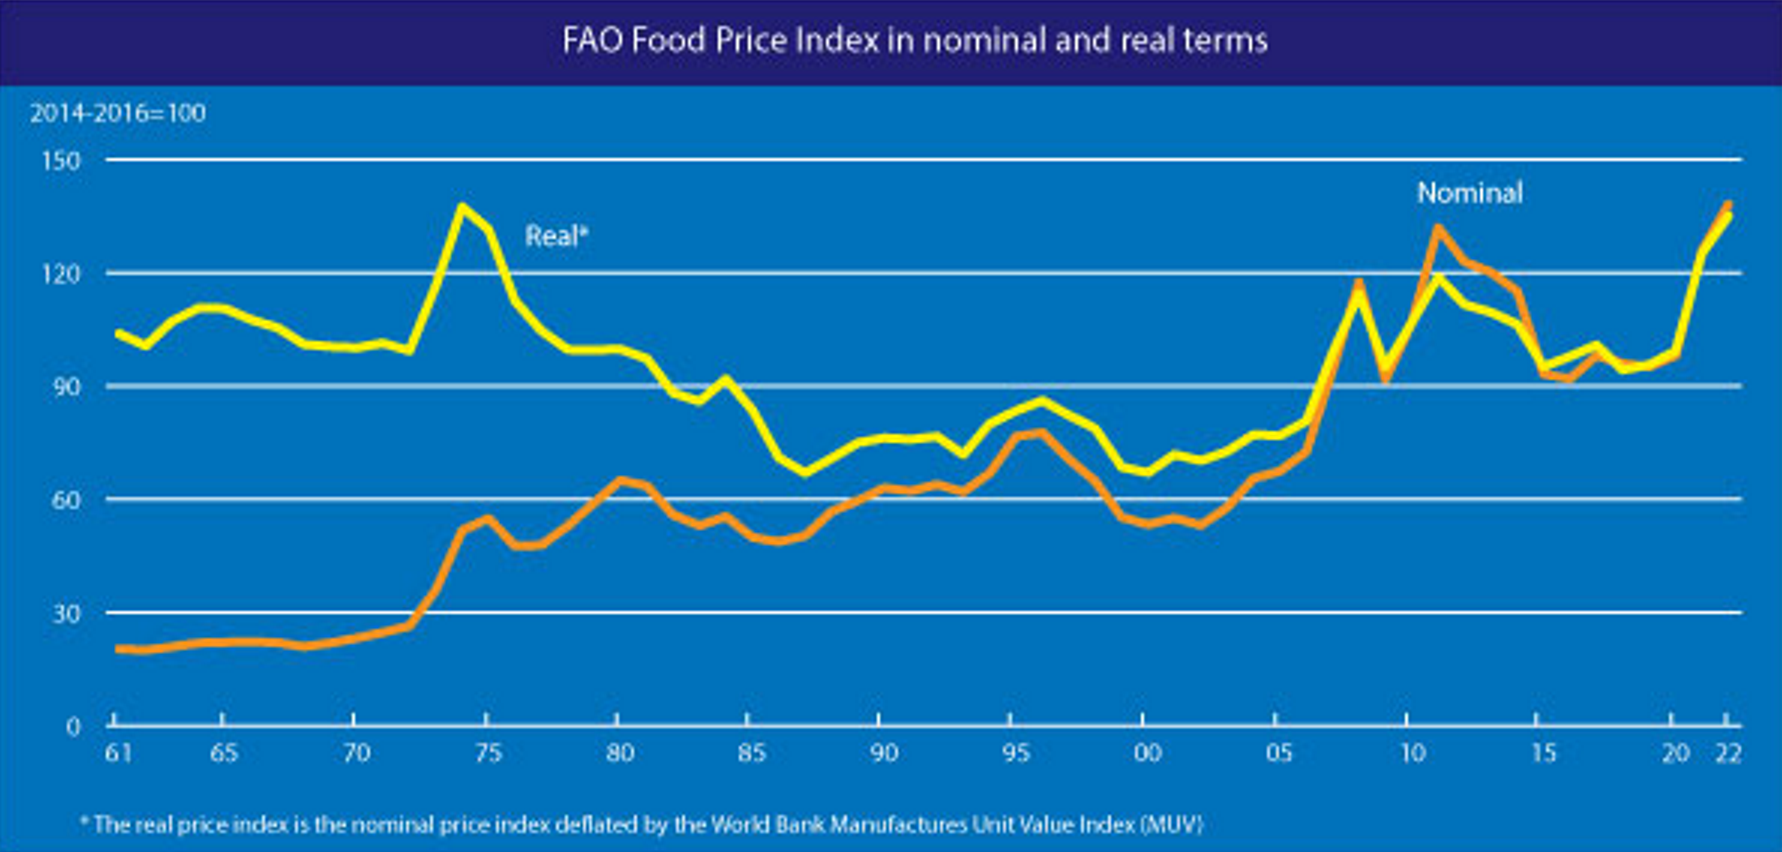
FAO Food Price Index, January 1961 - February 2022. In February 2022, the FAO Food Price Index (FFPI), averaged 140.7 points, up 5.3 points (3.9 percent) from January and as much as 24.1 points (20.7 percent) above its level a year ago. This represents a new all-time high, exceeding the previous top of February 2011 by 3.1 points. The February rise was led by large increases in vegetable oil and dairy price sub-indices. Cereals and meat prices were also up, while the sugar price sub-index fell for the third consecutive month. Graphic: FAO

FAO Food Price Index rose to new all-time high in February 2022

4 March 2022 (FAO) – The FAO Food Price Index (FFPI) averaged 140.7 points in February 2022, up 5.3 points (3.9 percent) from January and as much as 24.1 points (20.7 percent) above its level a year ago. This represents a new all-time high, exceeding the previous top of February 2011 by 3.1 points. The […]

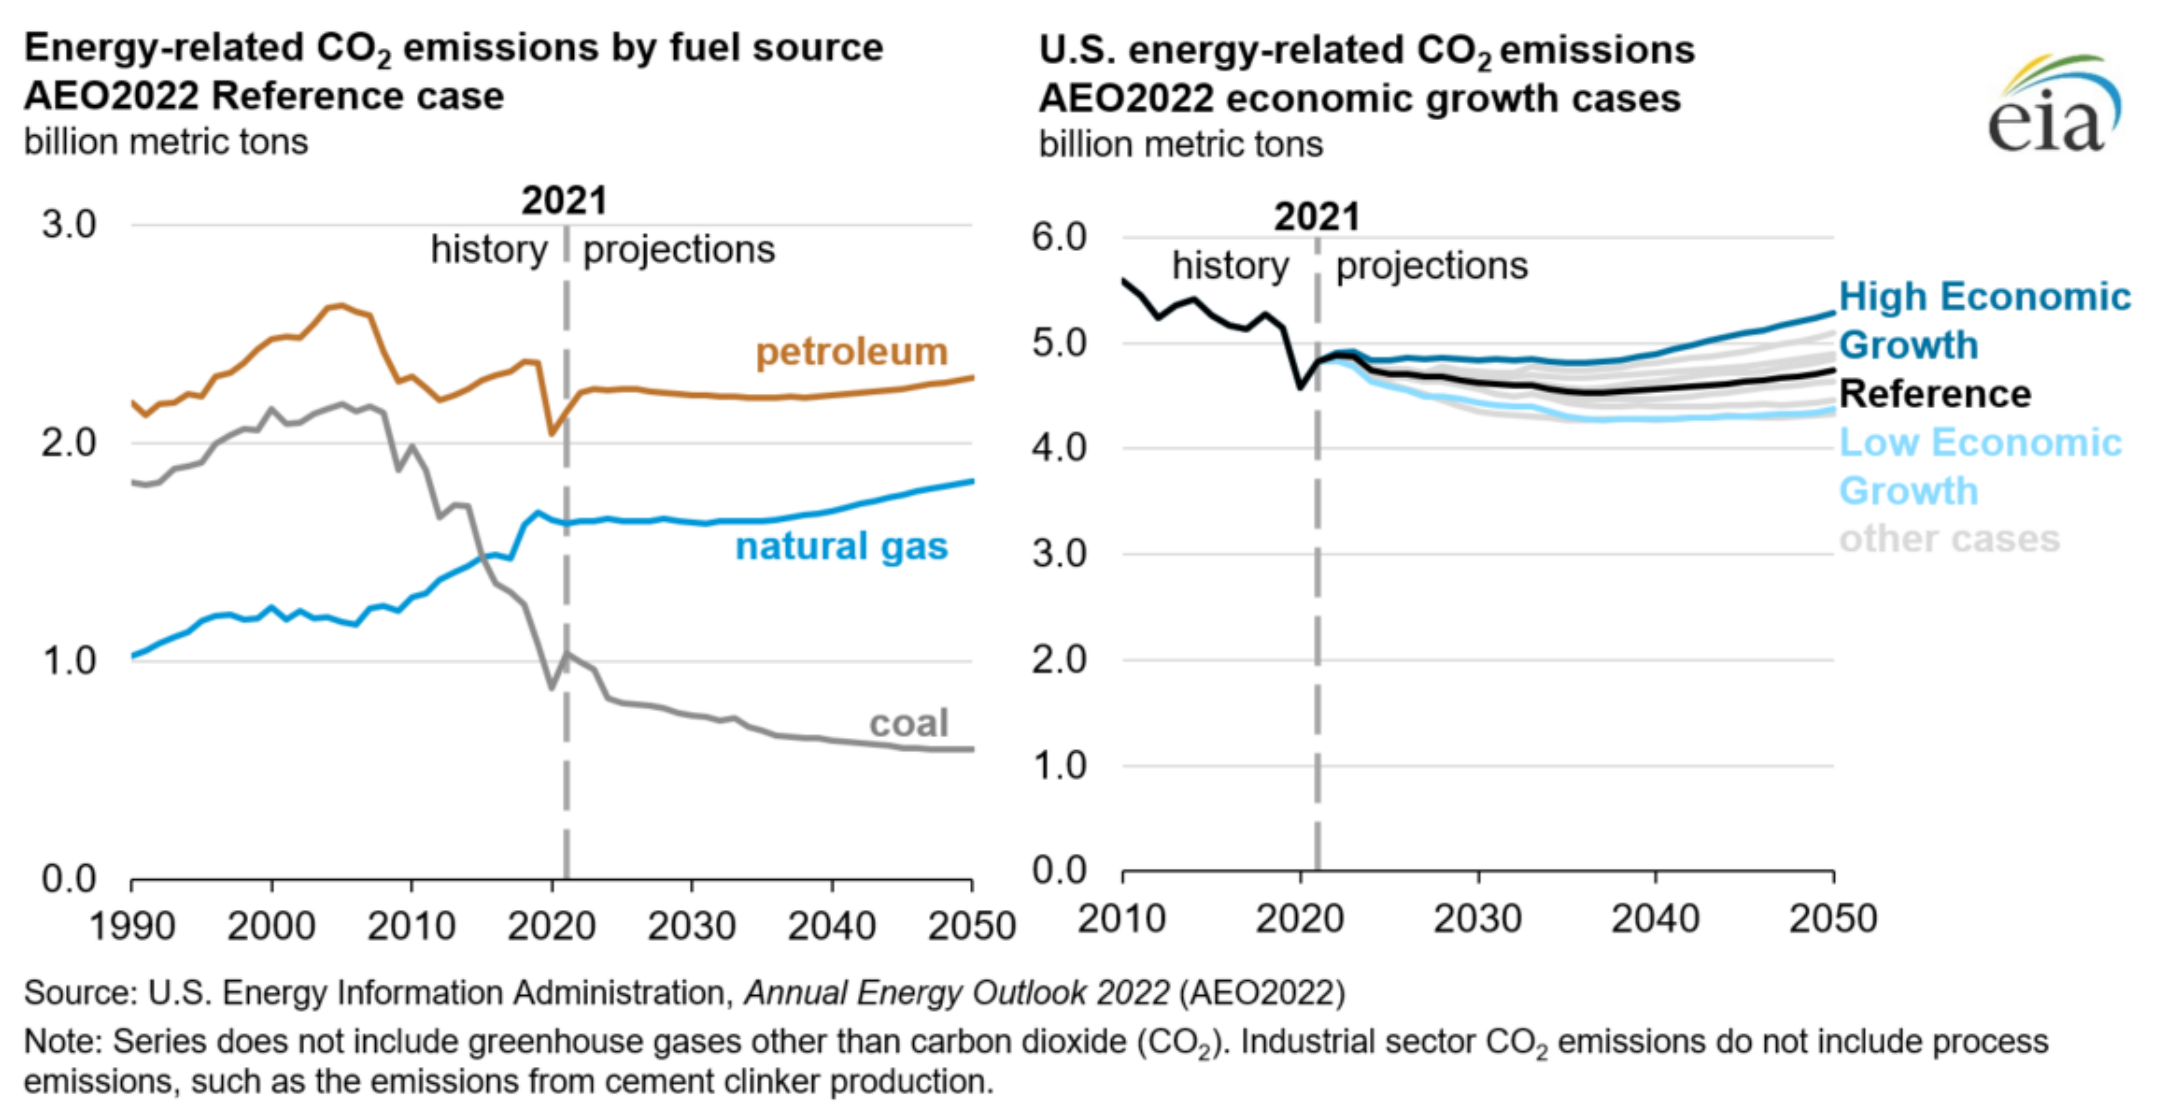
Projected U.S. energy-related carbon dioxide (CO2) emissions by fuel source in the AEO2022 reference case (left) and U.S. Energy-related CO2 emissions by AEO2022 economic growth cases (right). Energy‐related CO2 emissions dip through 2035 before climbing in later projection years. Graphic: EIA

U.S. energy projections to 2050: Fossil fuels still most-consumed energy sources through 2050 – Energy consumption increases as population and economic growth outweigh efficiency gains – Energy‐related CO2 emissions dip through 2035 but climb later

3 March 2022 (EIA) – Key takeaways from the Reference case and side cases: Petroleum and natural gas remain the most-consumed sources of energy in the United States through 2050, but renewable energy is the fastest growing Motor gasoline remains the most prevalent transportation fuel despite electric vehicles gaining market share Energy-related carbon dioxide (CO2) […]

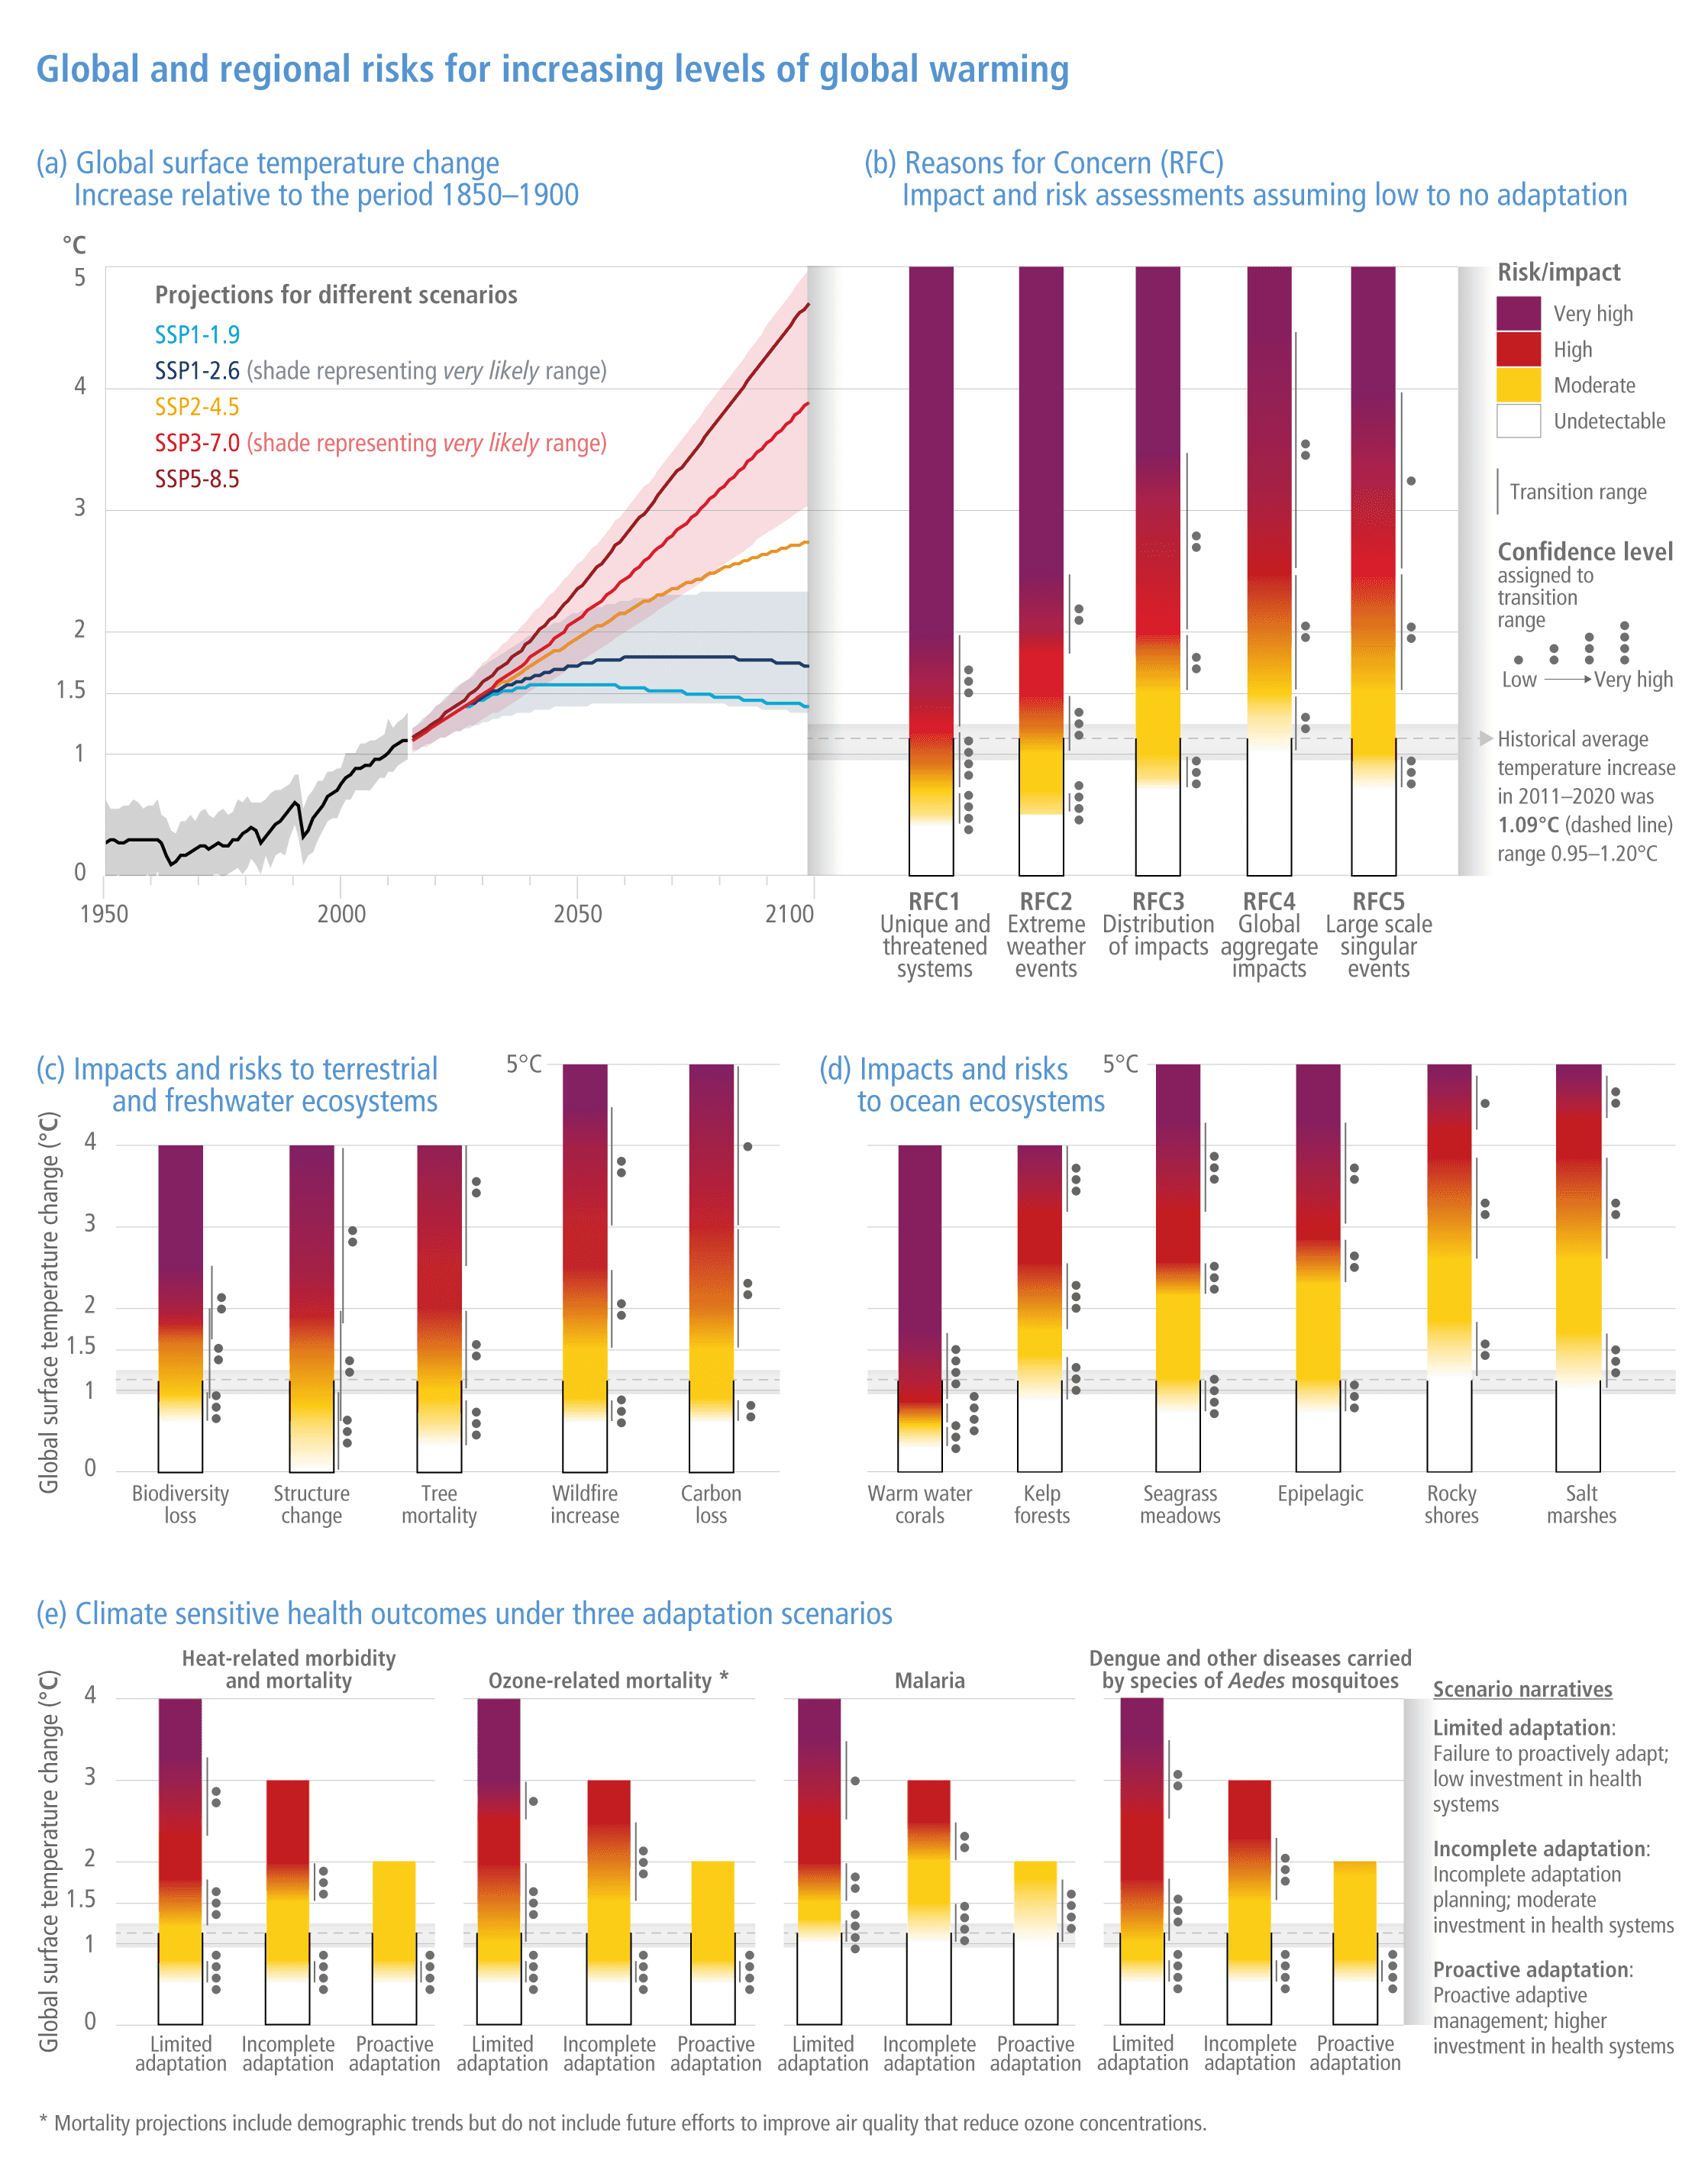
Global and regional risks for increasing levels of global warming. (a) Global surface temperature change increase relative to the period 1850-1900. (b) Reasons for concern (RFC) impact and risk assessments assuming low-to-no adaptation. (c) Impacts and risks to terrestrial and freshwater ecosystems. (d) Impacts and risks to ocean ecosystems. (e) Climate-sensitive health outcomes under three adaptation scenarios. Graphic: IPCC

Pacific Northwest heatwave in 2021 was a glimpse of global warming in North America – “We’re exposed to untold damage”

By Gillian Flaccus 1 March 2022 PORTLAND, Oregon (AP) – The U.S. Pacific Northwest was in the throes of a record-shattering heat wave last summer when a woman in her 70s was wheeled into an emergency room with symptoms of a life-threatening heat stroke. Desperate to cool her, Dr. Alexander St. John grabbed a body […]

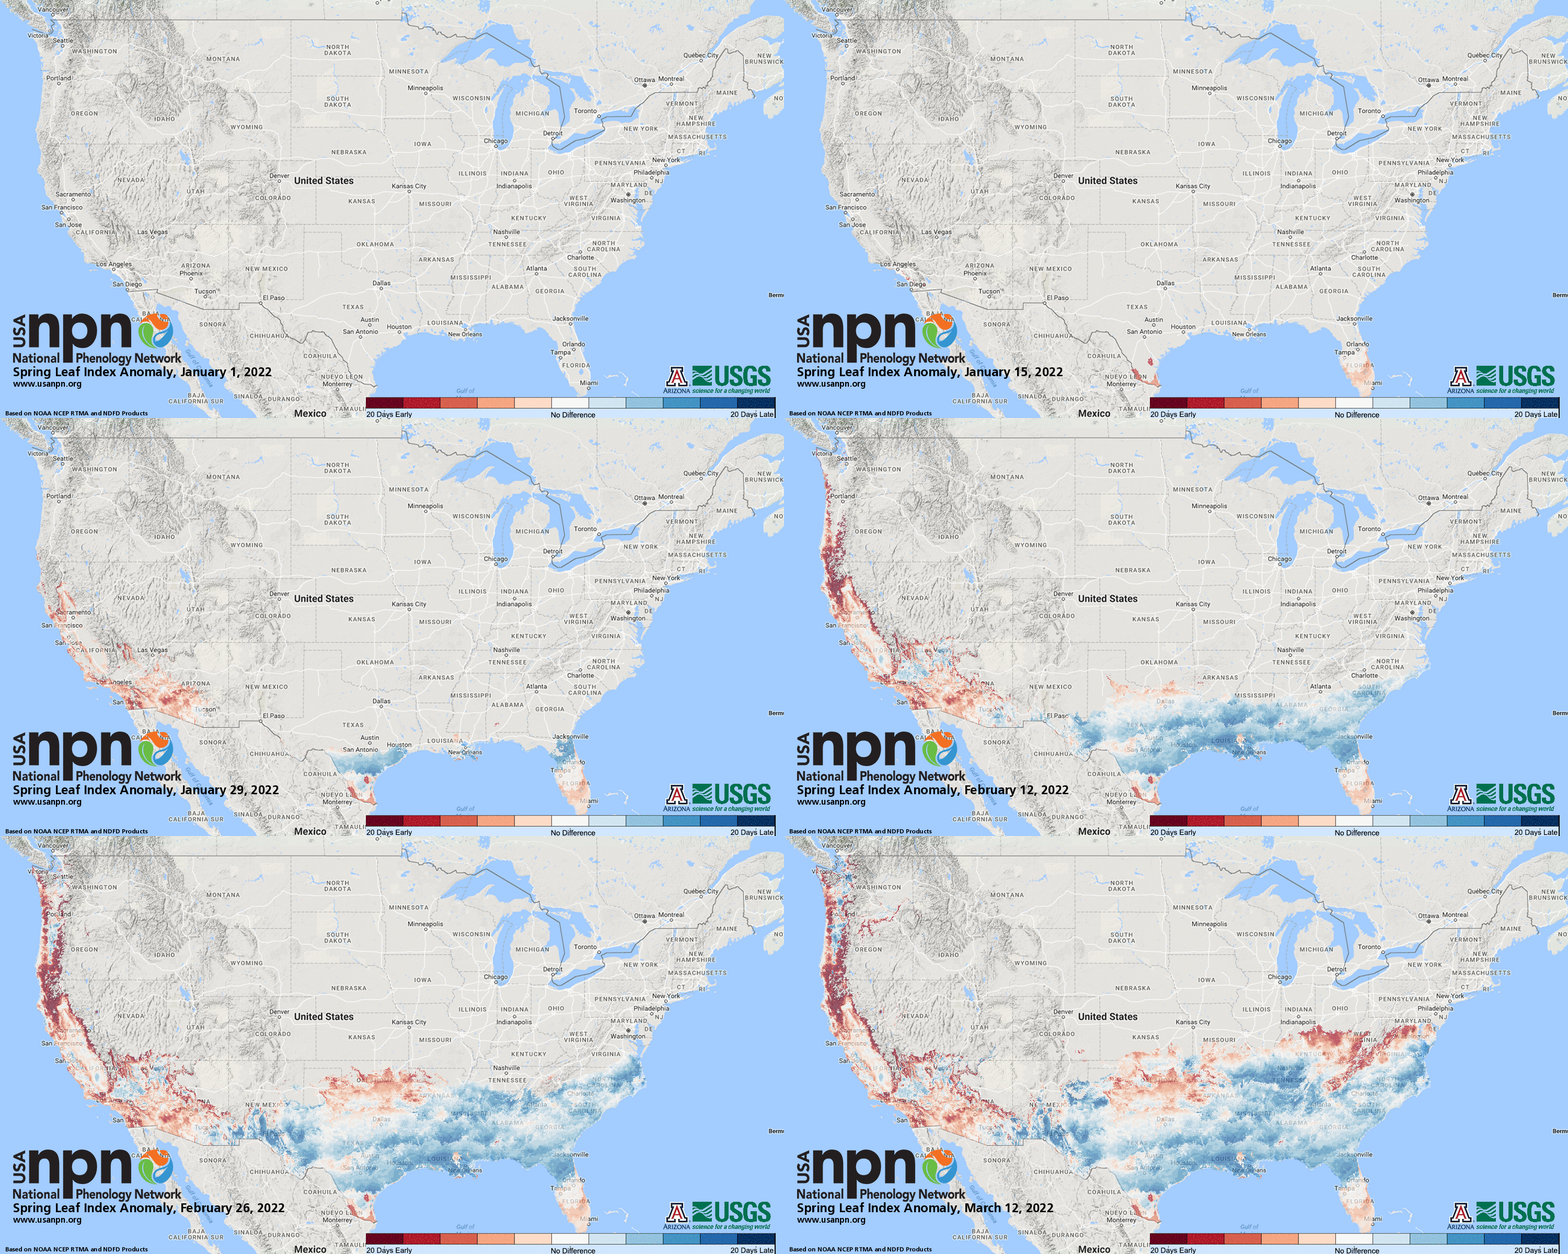
Map showing the Spring First Leaf Index Anomaly in the United States in 2022. In parts of California and Arizona, this year's spring leaf out is the earliest in the 40-year record. Graphic: National Phenology Network

Spring 2022: In parts of California and Arizona, spring leaf out is earliest on record – In parts of Texas, spring bloom is latest on record   

9 March 2022 (National Phenology Network) – Spring leaf out continues to progress across the country. Our spring leaf anomaly compares the arrival of spring leaf out this year to a long-term average of 1991-2020. After a slow start to spring across much of the Southeast, spring is progressing more rapidly, arriving a few days […]

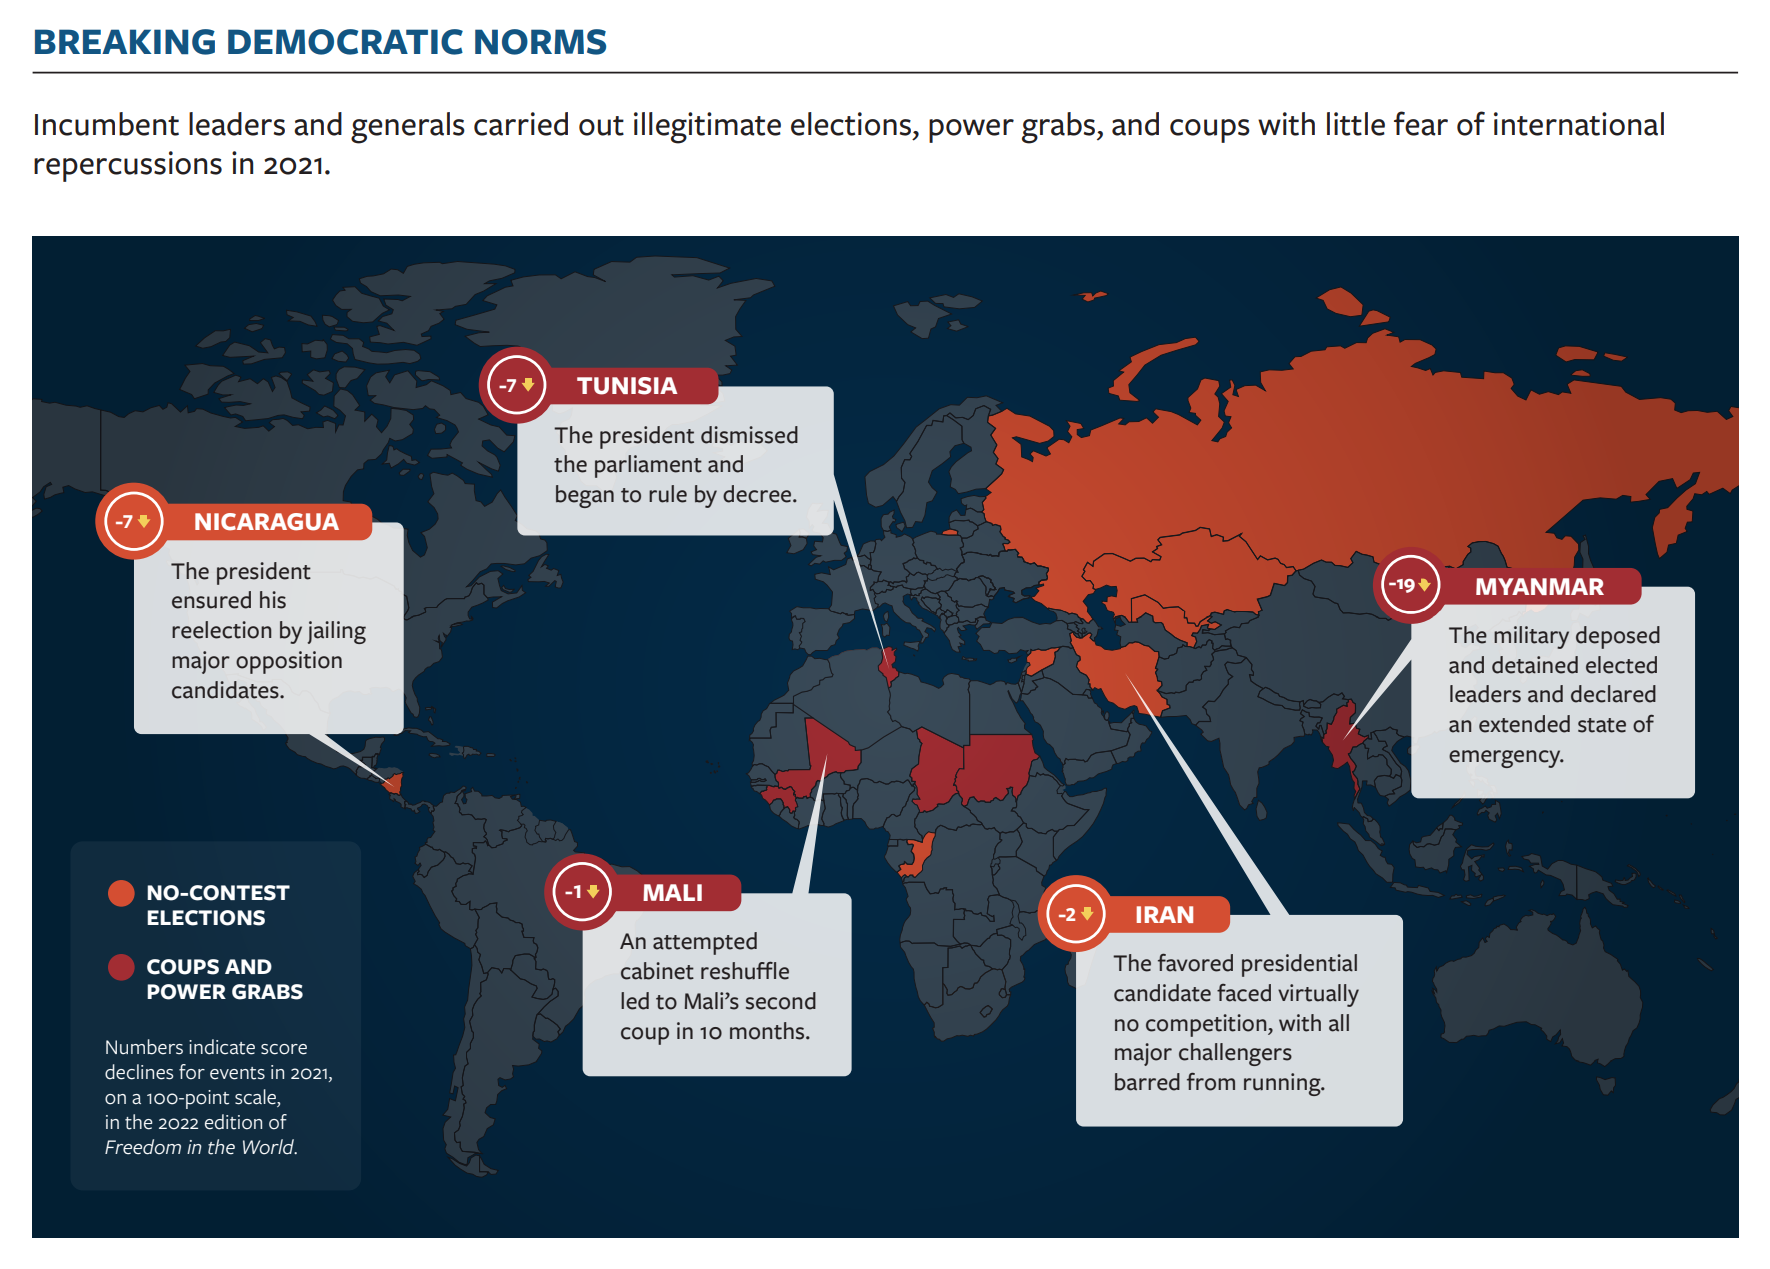
Map showing no-contest elections, coups, and power grabs globally in 2021. Numbers indicate score declines for events in 2021, on a 100-point scale, in the 2022 edition of the “Freedom in the World” report. Coups were more common in 2021 than in any of the previous 10 years. Graphic: Freedom House

The global expansion of authoritarian rule – “The present threat to democracy is the product of 16 consecutive years of decline in global freedom”

By Sarah Repucci and Amy Slipowitz 24 February 2022 (Freedom House) – Global freedom faces a dire threat. Around the world, the enemies of liberal democracy—a form of self-government in which human rights are recognized and every individual is entitled to equal treatment under law—are accelerating their attacks. Authoritarian regimes have become more effective at […]

Graph showing a spike in gamma radiation at the Chernobyl nuclear power plant on 24 February 2022, after Russian military forces invaded Ukraine on a manufactured pretext. The spike was likely due to the movement of heavy military equipment in the area lifting radioactive dust into the air. The measured value is 54,200 nSv/hour. Graphic: SSE Ecocentre / SaveEcoBot

Radiation spikes around Chernobyl after Russian invasion of Ukraine

By Matt Mathers 25 February 2022 (The Independent) – Radiation at the Chernobyl nuclear power plant has exceeded control levels after Russia troops took control of the area, Ukraine has said. Data from the automated radiation monitoring system of the exclusion zone, which is available online, indicate that the control levels of gamma radiation dose […]

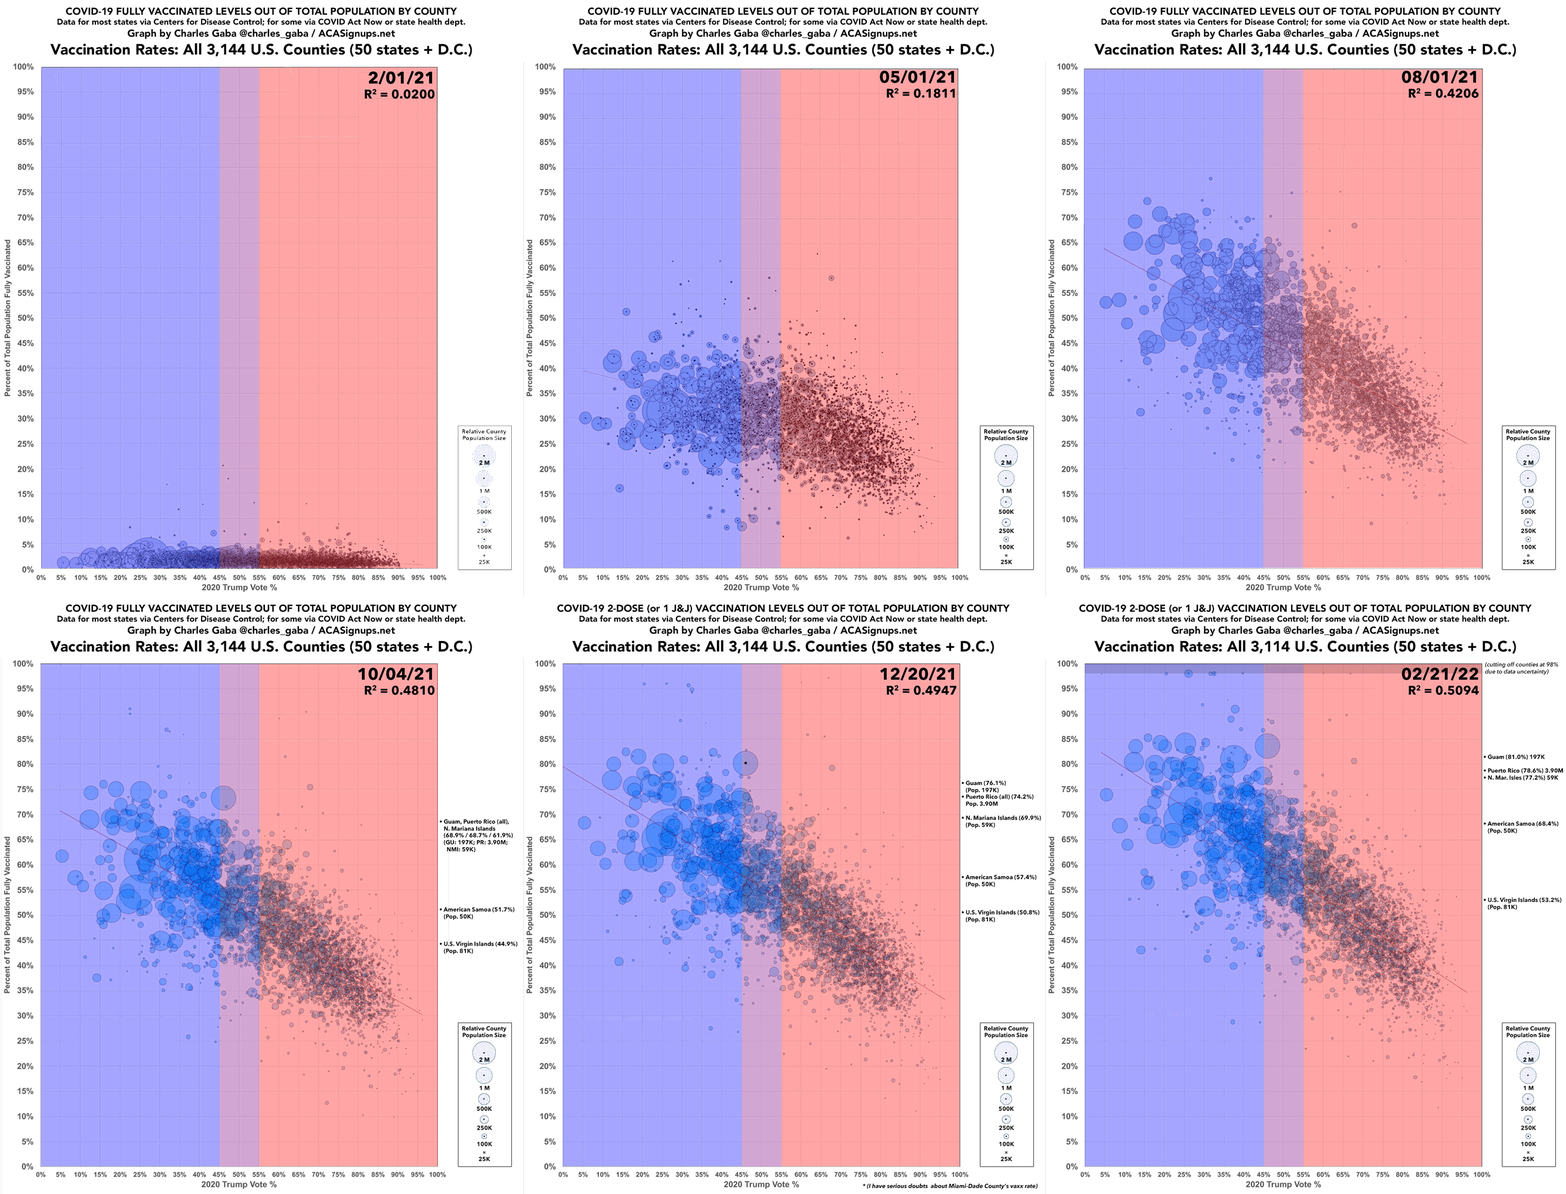
COVID-19 fully vaccinated levels out of total population by U.S. county, 1 February 2021 - 21 February 2022. In February and March 2021, there was virtually no partisan gap, when only seniors, healthcare workers, and some and other select groups were eligible to get COVID-19 vaccines. Starting in early April 2021, when all U.S. adults became eligible for the vaccine, the partisan divide started to ramp up quickly. The red/blue divide increased month after month regardless of other factors. Data: CDC / COVID Act Now / state health departments. Graph: Charles Gaba / ACA Signups

Graph of the Day: U.S. COVID-19 vaccinations by partisan lean, February 2021 – February 2022

By Charles Gaba 22 February 2022 (ACA Signups) – Last summer, I pulled together the occasional vaccination rate scatter plot graphs I’d been compiling for months into a single animated GIF image to show how both the correlation (R^2) and steepness (slope) of the partisan COVID vaccination divide grew from almost nothing at all to a gaping […]
Social media & sharing icons powered by UltimatelySocial