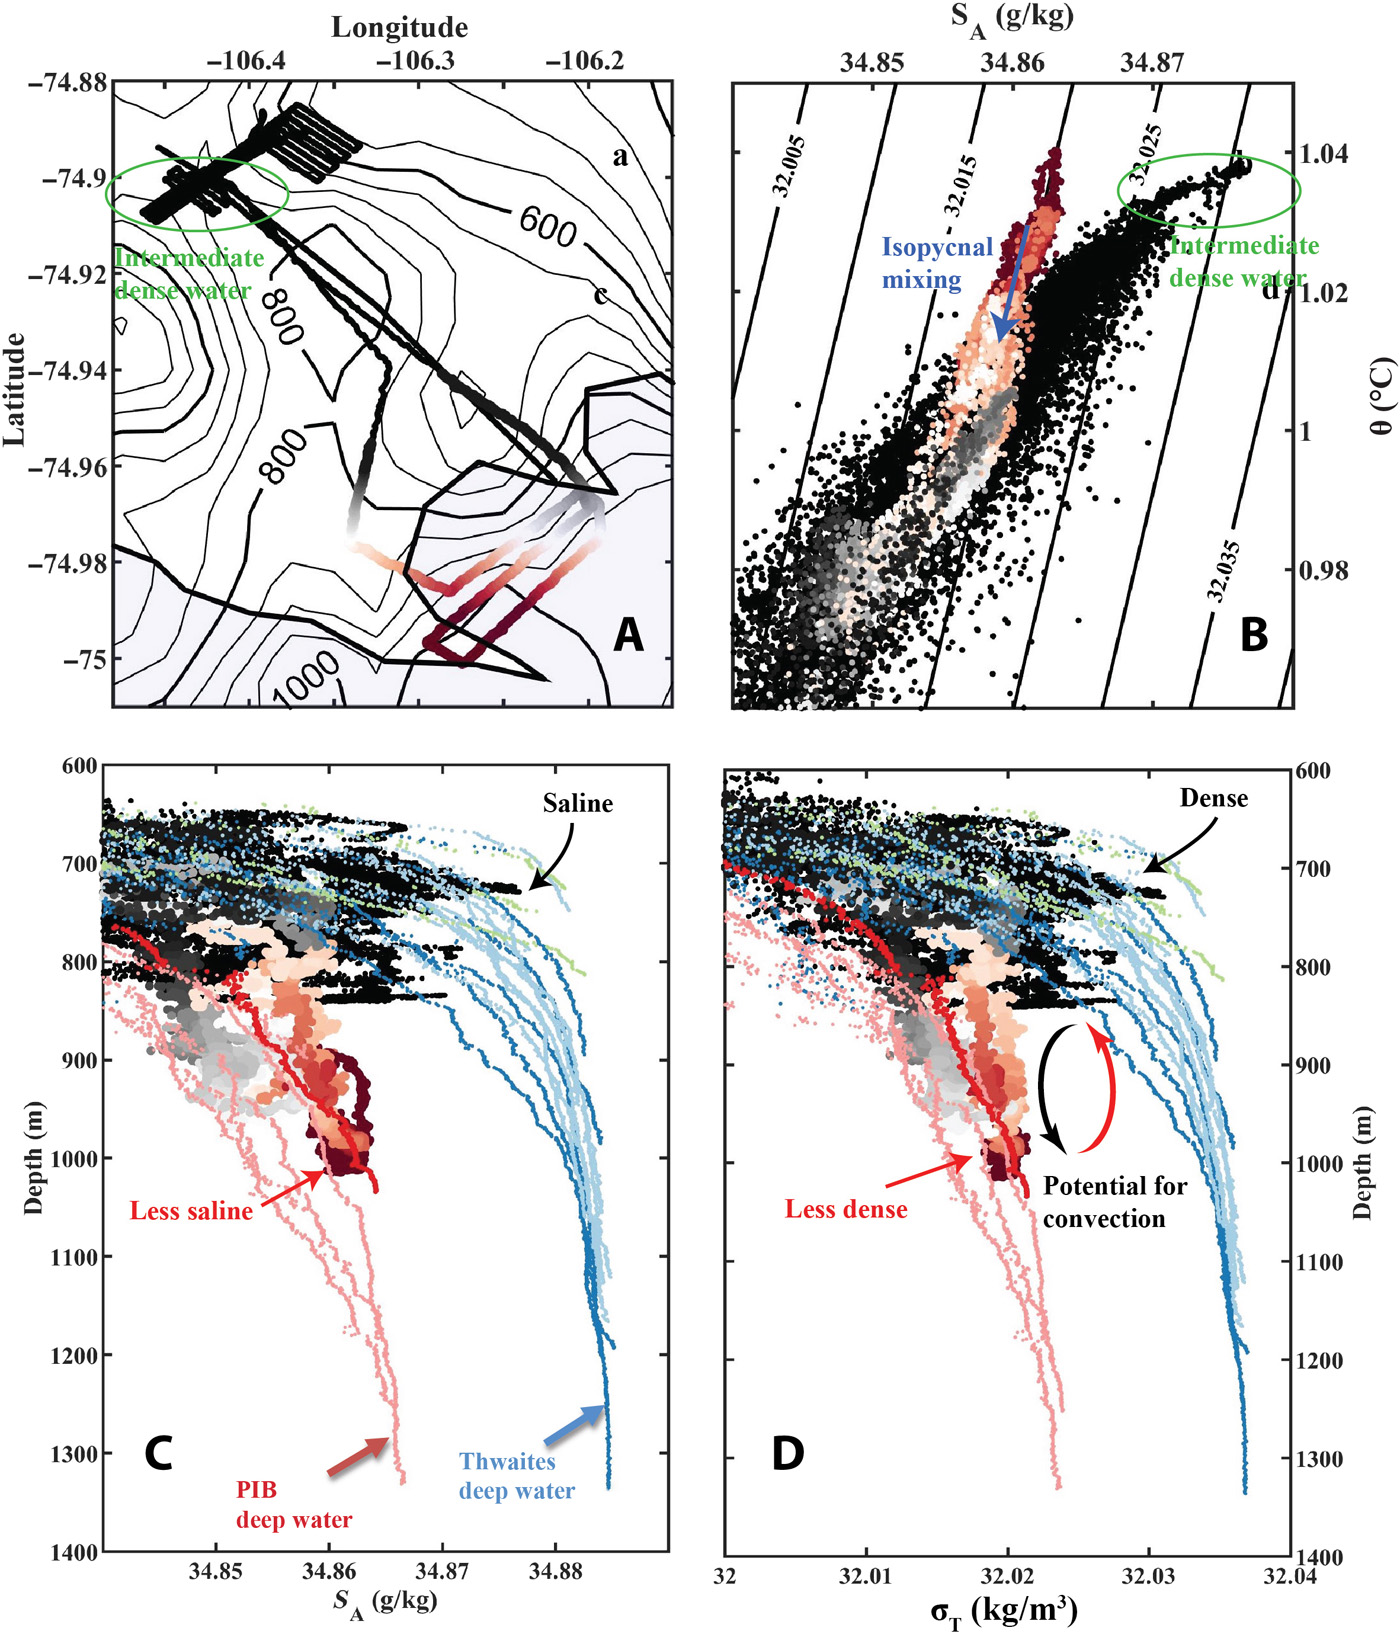
Deep water underneath the Thwaites ice shelf front is lighter than water outside the ice shelf. (A) Map of trough T3 showing the AUV path color coded by latitude. Shaded region indicates the ice shelf front, and black contours are depth contours. (B) Conservative temperature θ (in degrees Celsius) versus absolute salinity SA (in grams per kilogram) for the AUV data points shown in (A), colors as in (A). Contours show potential density (9) relative to 900 m, and blue arrow indicates isopycnal mixing, i.e., water that has the same density but different temperatures and salinities. Green circles in (A) and (B) show the dense saline deep water found in trough T3 discussed in the main text. (C) Absolute salinity SA (in grams per kilogram) as a function of depth for the AUV data in trough T3 and the CTD data (colors indicate station as in Fig. 3). (D) Potential density (in kilograms per cubic meter) as a function of depth for the AUV data in trough T3 and the CTD data (colors indicate station as in Figs. 3 and 4). Red and blue arrows indicate the two deep water masses discussed in the main text from Pine Island Bay and Thwaites Trough. Dissolved oxygen versus θ and SA is shown in fig. S6. Graphic: Wåhlin, et al., 2021 / Science Advances

Exploration of ocean currents beneath the “Doomsday Glacier” by an autonomous underwater vehicle – Net melting of 75 cubic km of ice per year means “the glacier is not stable over time”

9 April 2021 (University of Gothenburg) – For the first time, researchers have been able to obtain data from underneath Thwaites Glacier, also known as the “Doomsday Glacier”. They find that the supply of warm water to the glacier is larger than previously thought, triggering concerns of faster melting and accelerating ice flow. With the […]

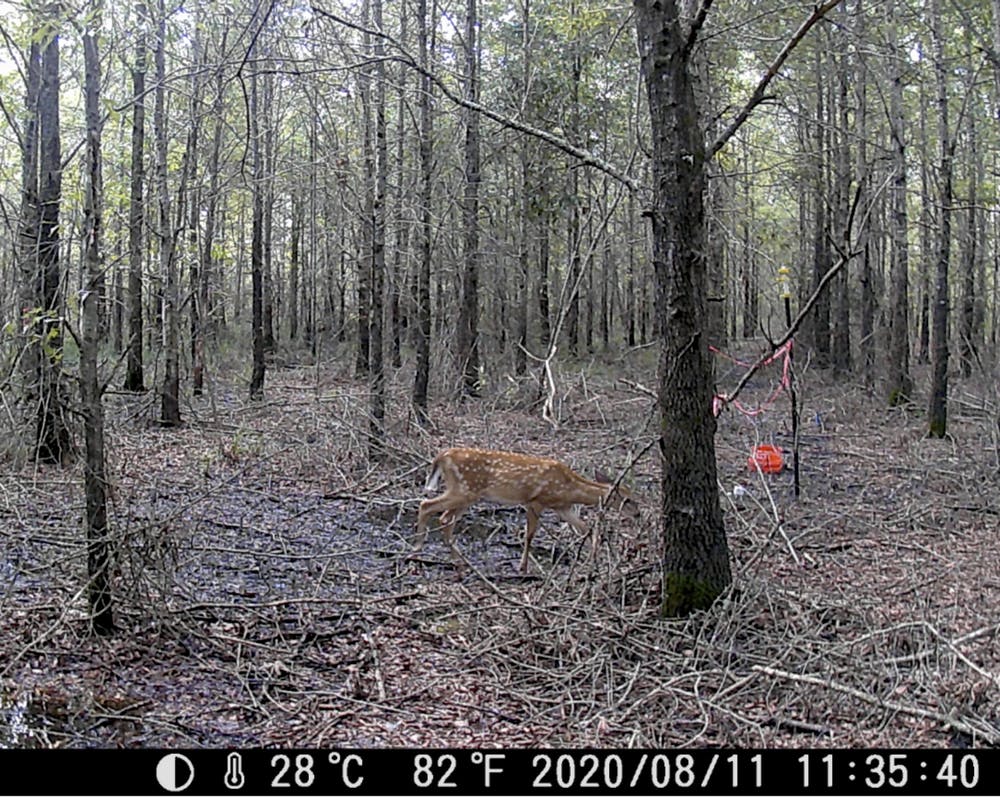
Deer photographed by a remote camera on 11 August 2020 in a forest destroyed by climate change in North Carolina. Sea level rise and saltwater intrusion are killing trees en masse, causing ghost forests. Photo: Emily Ury

Sea level rise is killing trees along the Atlantic coast, creating “ghost forests” that are visible from space

By Emily Ury 6 April 2021 (The Conversation) – Trekking out to my research sites near North Carolina’s Alligator River National Wildlife Refuge, I slog through knee-deep water on a section of trail that is completely submerged. Permanent flooding has become commonplace on this low-lying peninsula, nestled behind North Carolina’s Outer Banks. The trees growing in […]

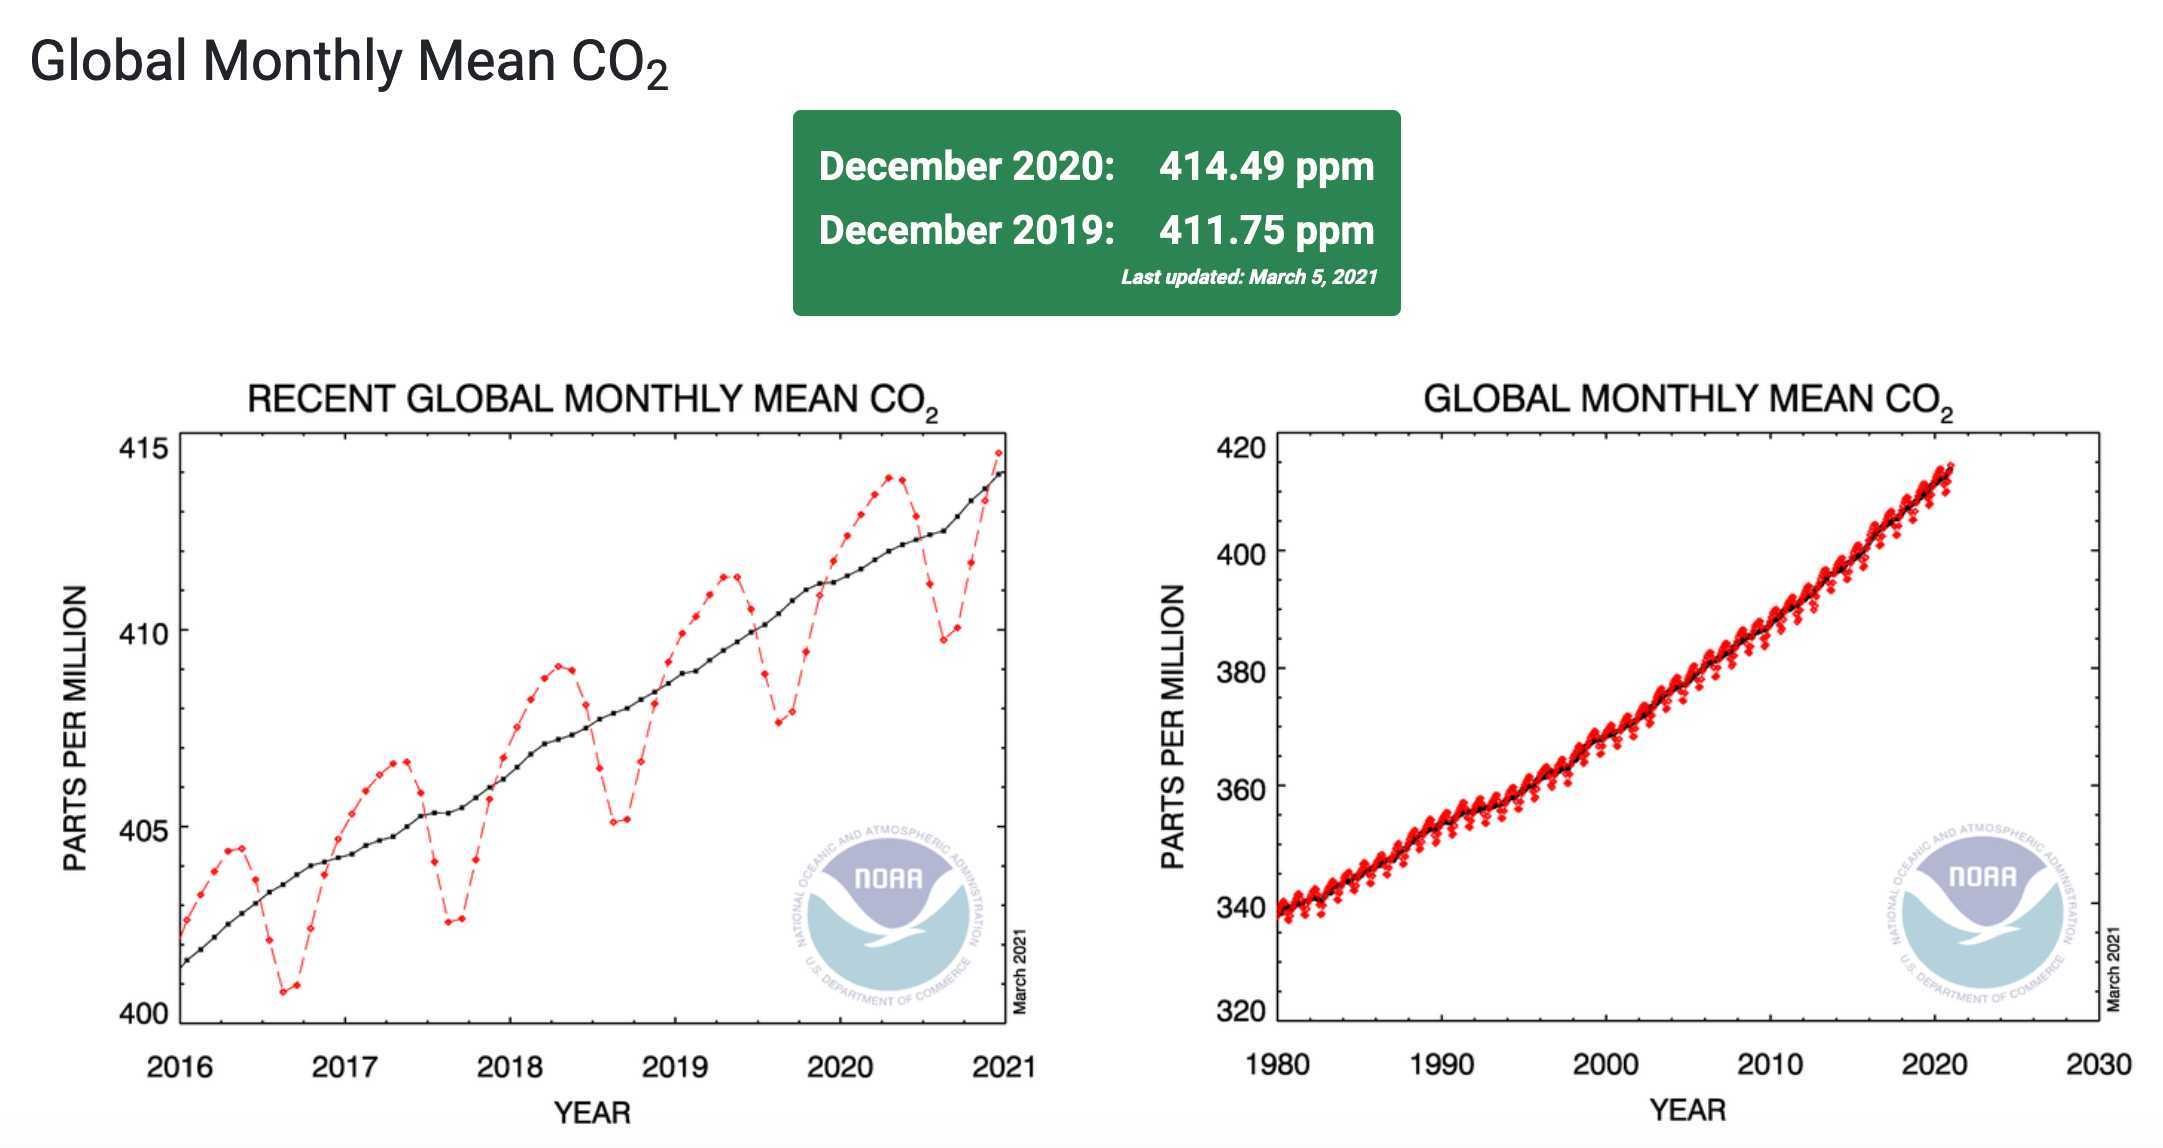
Global monthly mean atmospheric CO2, 1980-2020. These graphs shows the mean global atmospheric burden of carbon dioxide as analyzed from measurements collected by the NOAA Global Greenhouse Gas Reference Network. Graphic: NOAA Global Monitoring Laboratory

Despite pandemic shutdowns, carbon dioxide and methane surged in 2020 – Carbon dioxide levels now higher than any time in past 3.6 million years – Largest annual methane increase ever recorded

7 April 2021 (NOAA) – Levels of the two most important anthropogenic greenhouse gases, carbon dioxide and methane, continued their unrelenting rise in 2020 despite the economic slowdown caused by the coronavirus pandemic response, NOAA announced today. The global surface average for carbon dioxide (CO2), calculated from measurements collected at NOAA’s remote sampling locations, was […]

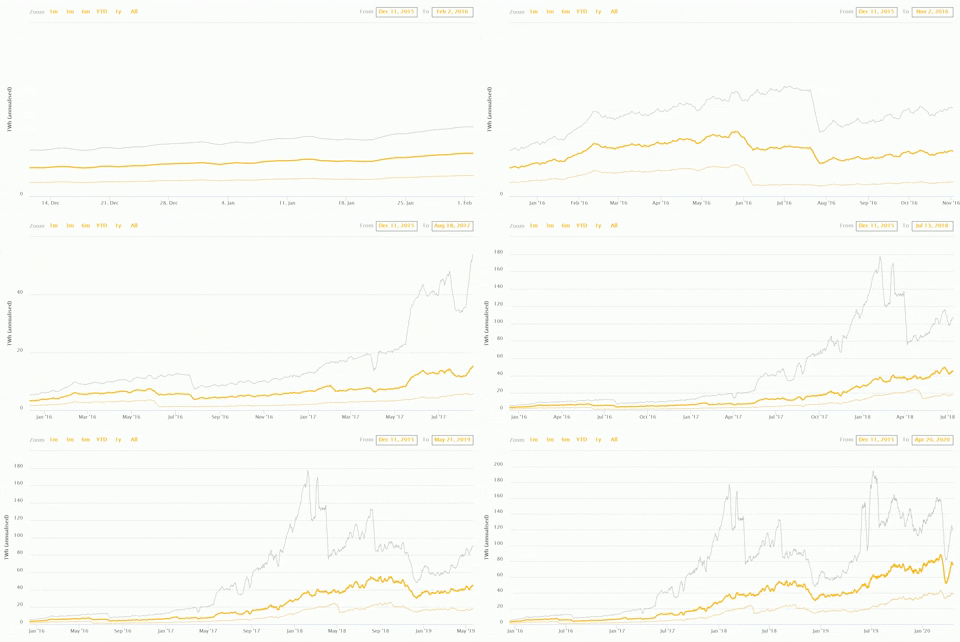
Annualized global Bitcoin electricity consumption in TWh, 2016-2021. Graphic: Cambridge Bitcoin Electricity Consumption Index / University of Cambridge

Majority of global Bitcoin energy consumption powered by non-renewable energy – Only 39 percent comes from renewables

24 September 2020 (CCAF) – The Cambridge Centre for Alternative Finance (CCAF) at the Cambridge Judge Business School today published the third edition of its Global Cryptoasset Benchmarking Studywhich highlights the industry’s efforts to address regulatory concerns over anti-money laundering (AML) and combating the financing of terrorism (CFT), but cautions that efforts to address issues such […]

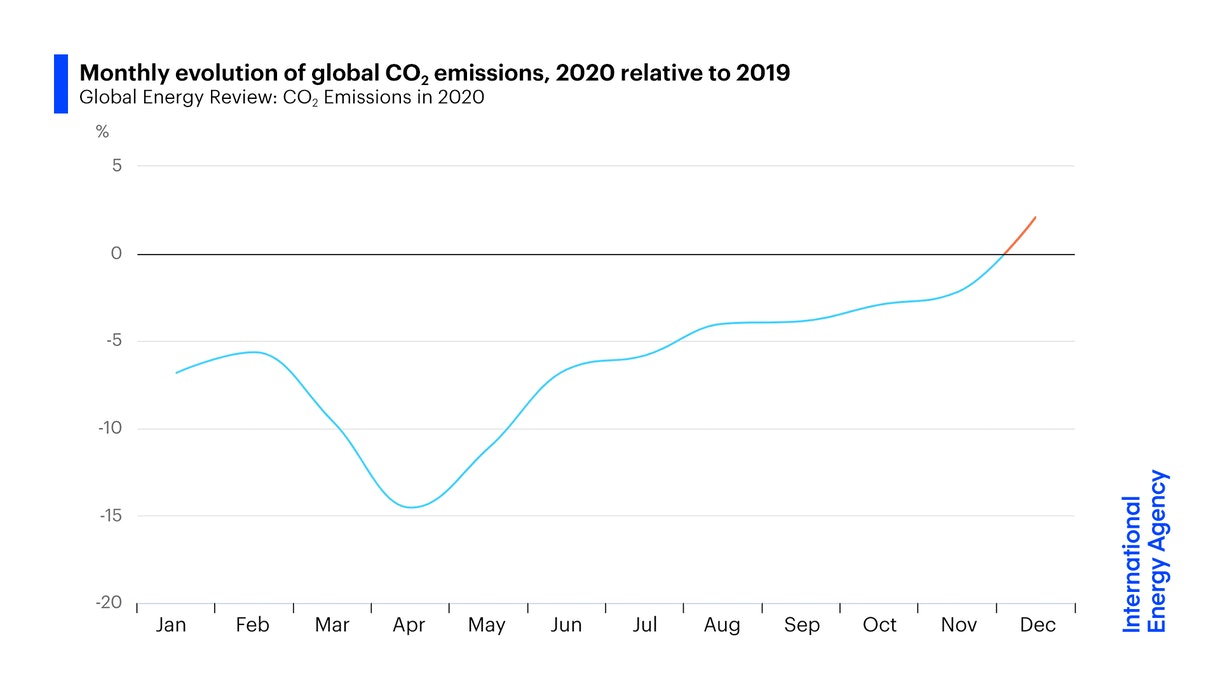
Monthly evolution of global CO2 emissions in 2020, relative to 2019. After hitting a low in April 2020, global emissions rebounded strongly and rose above 2019 levels in December. Global CO2 emissions were 2 percent, or 60 million tonnes, higher in December 2020 than they were in the same month a year earlier. Major economies led the resurgence as a pick-up in economic activity pushed energy demand higher and significant policies measures to boost clean energy were lacking. Many economies are now seeing emissions climbing above pre-crisis levels. Graphic: IEA

After steep drop in early 2020, global carbon dioxide emissions have rebounded strongly – “The rebound in global carbon emissions is a stark warning that not enough is being done to accelerate clean energy transitions worldwide”

2 March 2021 (IEA) – The Covid-19 crisis in 2020 triggered the largest annual drop in global energy-related carbon dioxide emissions since the Second World War, according to IEA data released today, but the overall decline of about 6% masks wide variations depending on the region and the time of year. After hitting a low in […]

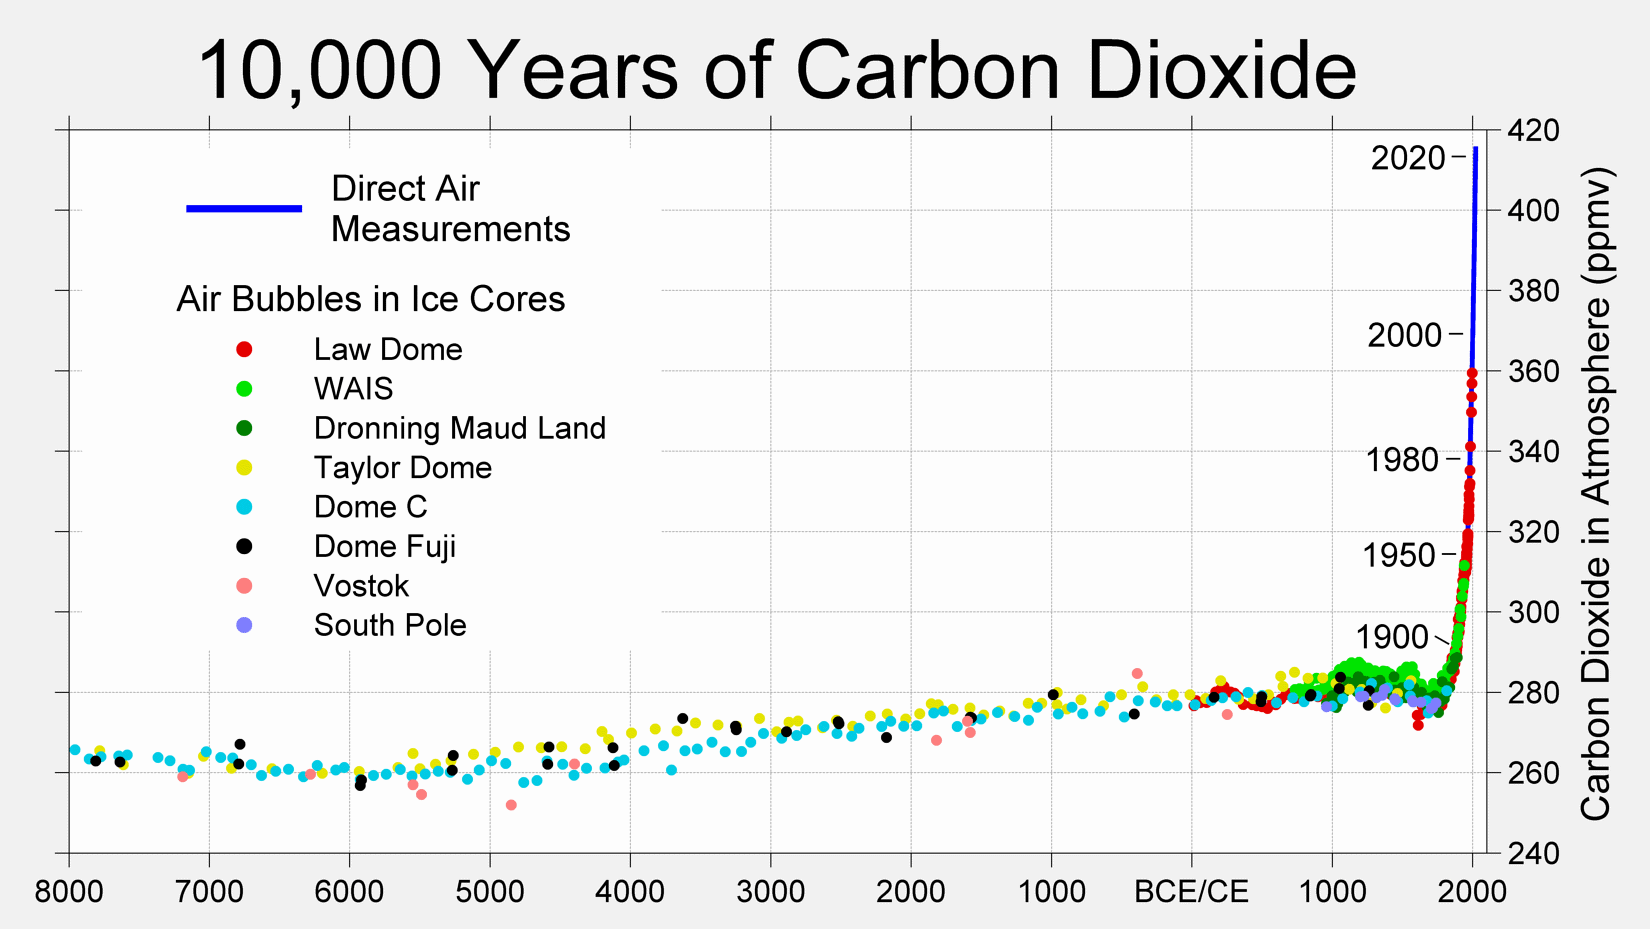
10,000 years of carbon dioxide. Due in large part to the burning of fossil fuels, carbon dioxide levels in the atmosphere have now risen by about 50 percent% above the preindustrial level. At recent rates of growth, we would reach double the preindustrial by around the year 2075. Graphic: Dr. Robert Rohde

Graph of the Day: 10,000 years of carbon dioxide

Dr. Robert Rohde 17 March 2021 (Twitter) – Due in large part to the burning of fossil fuels, carbon dioxide levels in the atmosphere have now risen about 50 percent above the preindustrial level. At recent rates of growth, we would reach double the preindustrial by around 2075. Dr. Robert Rohde on Twitter

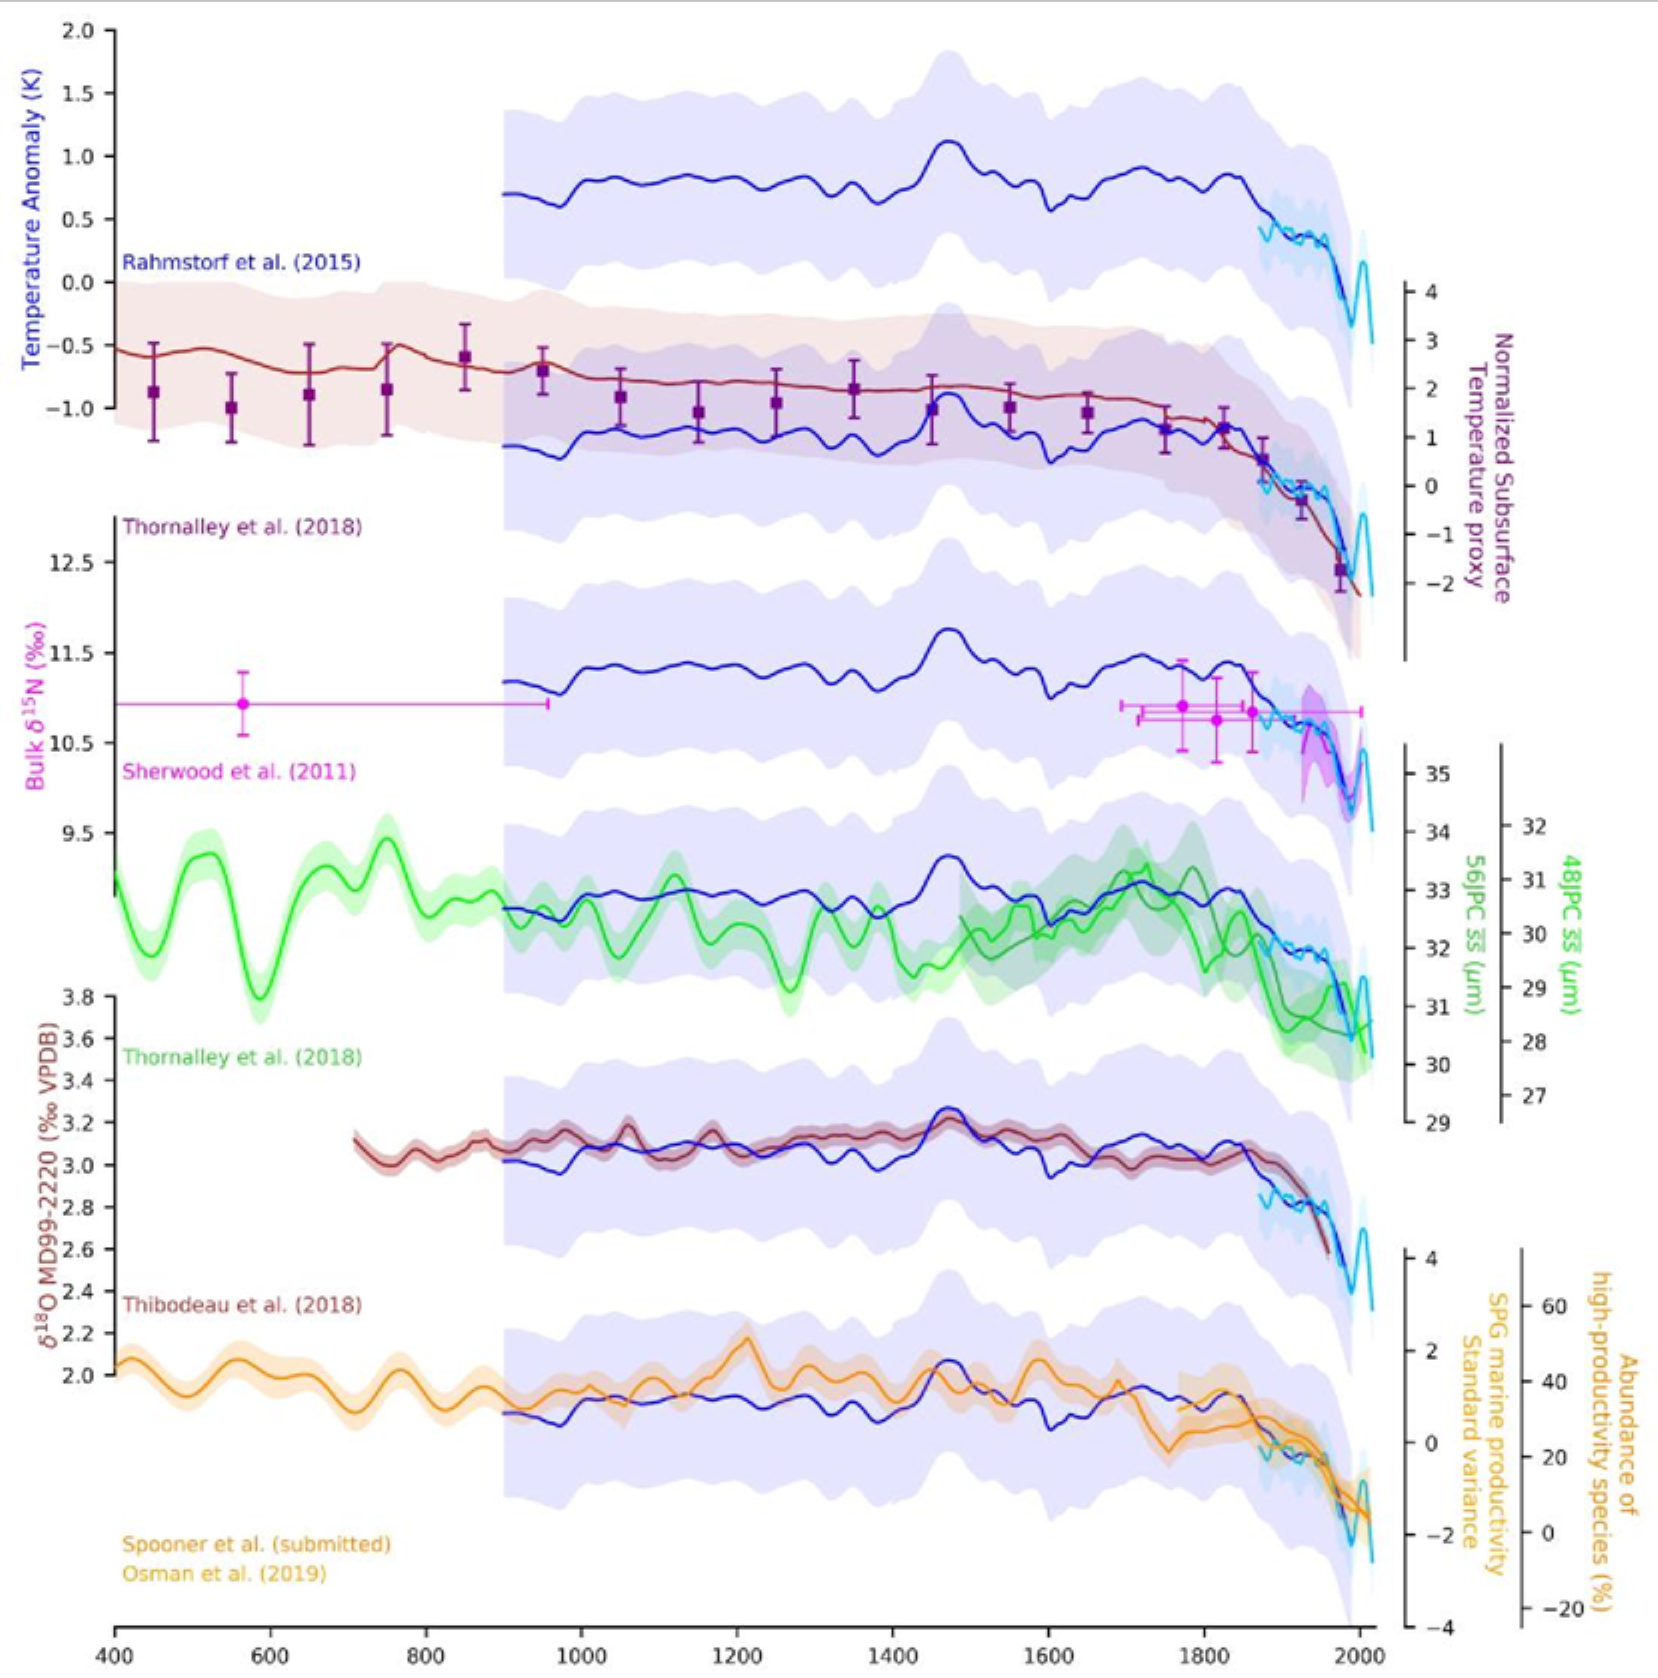
Millennium-scale evolution of the Atlantic Meridional Overturning Circulation (AMOC), 400 - 2020. SST-based AMOC reconstructions (light and dark blue) compared to various proxy reconstructions, including land and sea surface temperature reconstructions, sortable silt data, δ18O in benthic foraminifera, δ15N of deep-sea gorgonian corals, and relative abundance of Turborotalita quinqueloba. Since at least 400 AD relatively stable, the AMOC began to decline during the 19th Century which is evident in all proxy records. Around 1950 a phase of particularly rapid decline started that is found in several, largely independent proxies. A short-lived recovery is evident in the 1990s before a return to decline from the mid-2000s. Together these data consistently show that the modern AMOC slowdown is unprecedented in over a thousand years. Graphic: Levke Caesar

Gulf Stream System at its weakest in more than a millennium – “This could bring us dangerously close to the tipping point at which the flow becomes unstable”

25 February 2021 (PIK) – Never before in over 1000 years the Atlantic Meridional Overturning Circulation (AMOC), also known as Gulf Stream System, has been as weak as in the last decades. This is the result of a new study by scientists from Ireland, Britain, and Germany. The researchers compiled so-called proxy data – taken […]

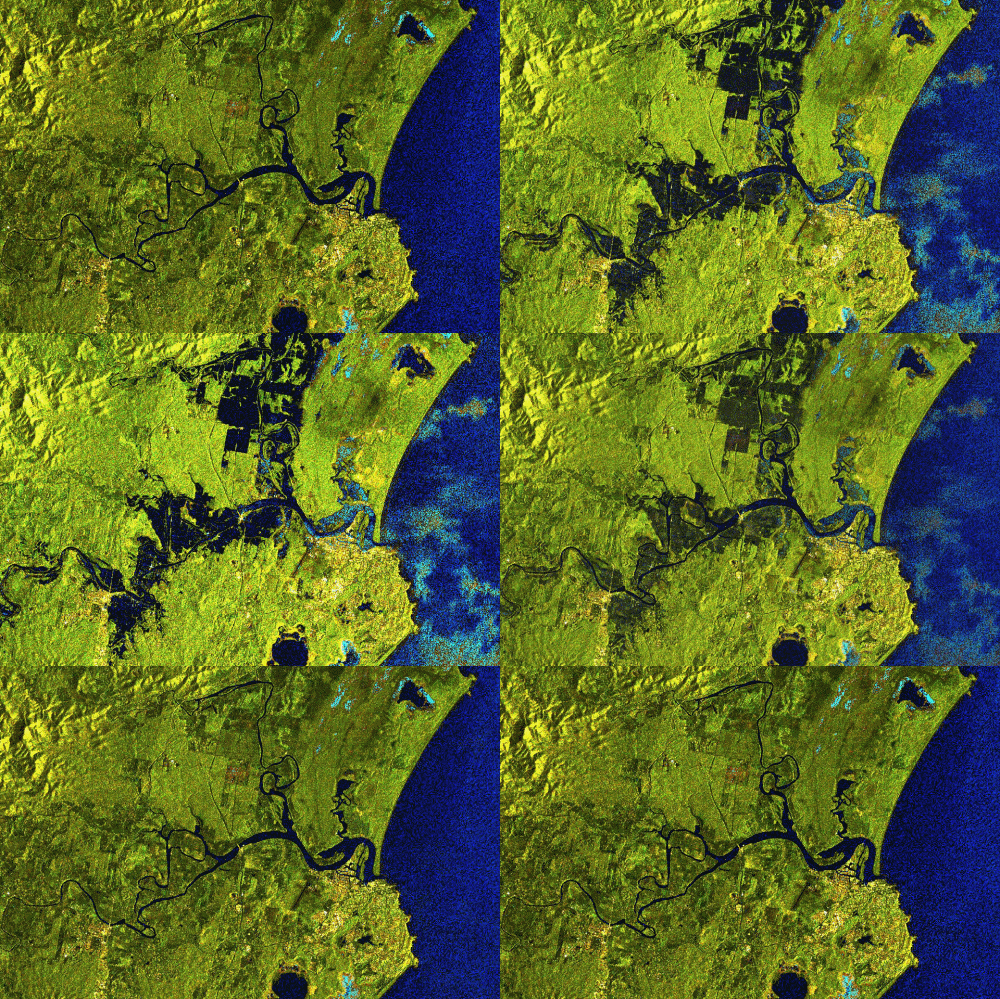
A before-and-after satellite view of flooding at Port Macquarie, captured by radar data from the European Union Earth Observation Programme's Sentinel-1 satellite on 12 March 2021 19 March 2021. Photo: Copernicus European Earth Observation Programme

Heavy rains in Australia’s east bring worst floods in 50 years – “Yesterday, we were hoping it will only be a one-in-20-year event, now it looks like a one-in-50-year event”

By Angus Thompson, Rachel Clun, and Lucy Cormack 21 March 2021 (Sydney Morning Herald) – The collision of two powerful weather systems over the east coast of NSW on Monday night may see more evacuations as western Sydney residents were forced to flee to higher ground on Sunday when floodwaters inundated their neighbourhoods. The State […]

Screenshot of the EPA Climate Change website, which was relaunched on 17 March 2021 after President Biden reversed the antiscience policies of the Trump administration. Graphic: EPA

EPA brings climate science back to website after Trump purge – “Climate facts are back”

By Richard Luscombe 20 March 2021 (The Guardian) – Canceled four years ago by a president who considered global warming a hoax, climate crisis information has returned to the website of the US government’s Environmental Protection Agency (EPA) as part of Joe Biden’s promise to “bring science back”. The revival of a page dedicated to the […]

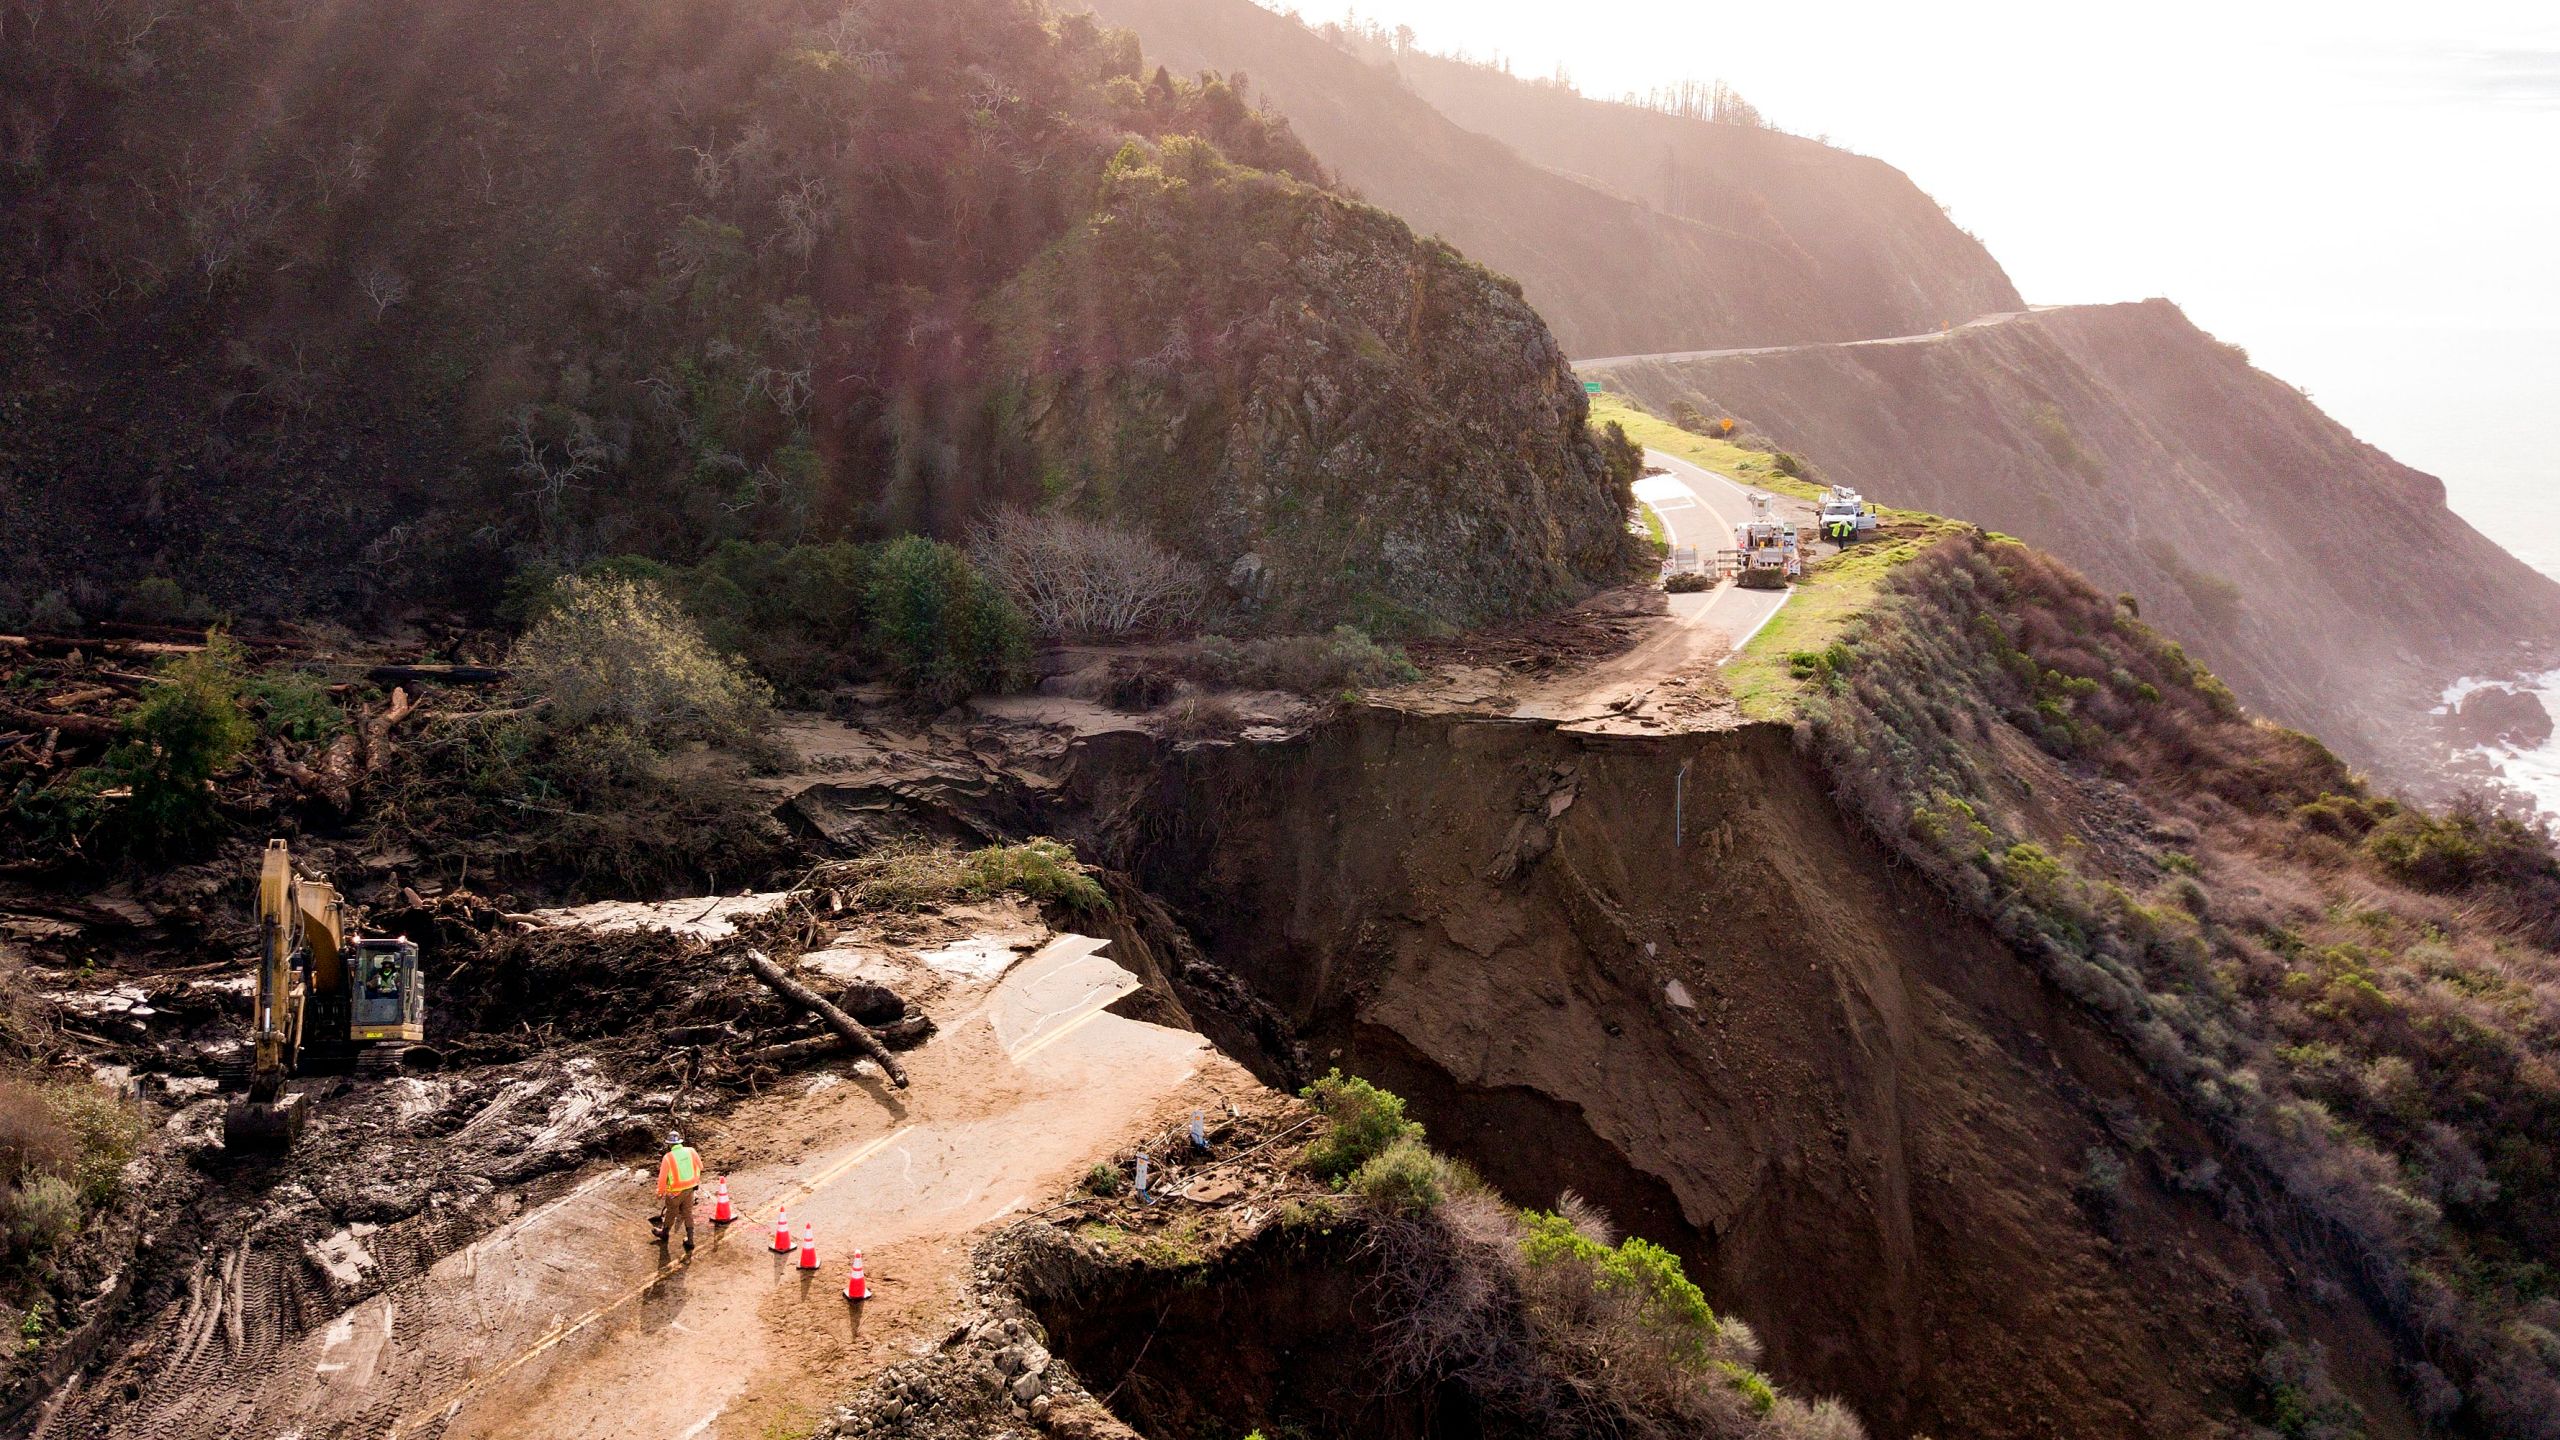
Construction crews work on a section of Highway 1 which collapsed into the Pacific Ocean near Big Sur, California on 31 January 2021. Heavy rains caused debris flows of trees, boulders, and mud that washed out a 150-foot section of the road. Photo: Josh Edelson / AFP / Getty Images

Floods after wildfires are washing California’s Pacific Coast Highway into the ocean – “It was great while it lasted”

By Joel Shannon and Doyle Rice 2 March 2021 (USA TODAY) – Soaring mountains on one side of the road and the Pacific Ocean on the other: It was 1956 and Gary Griggs was experiencing California State Route 1 for the first time. He was a child, but in the following decades he would drive […]
Social media & sharing icons powered by UltimatelySocial