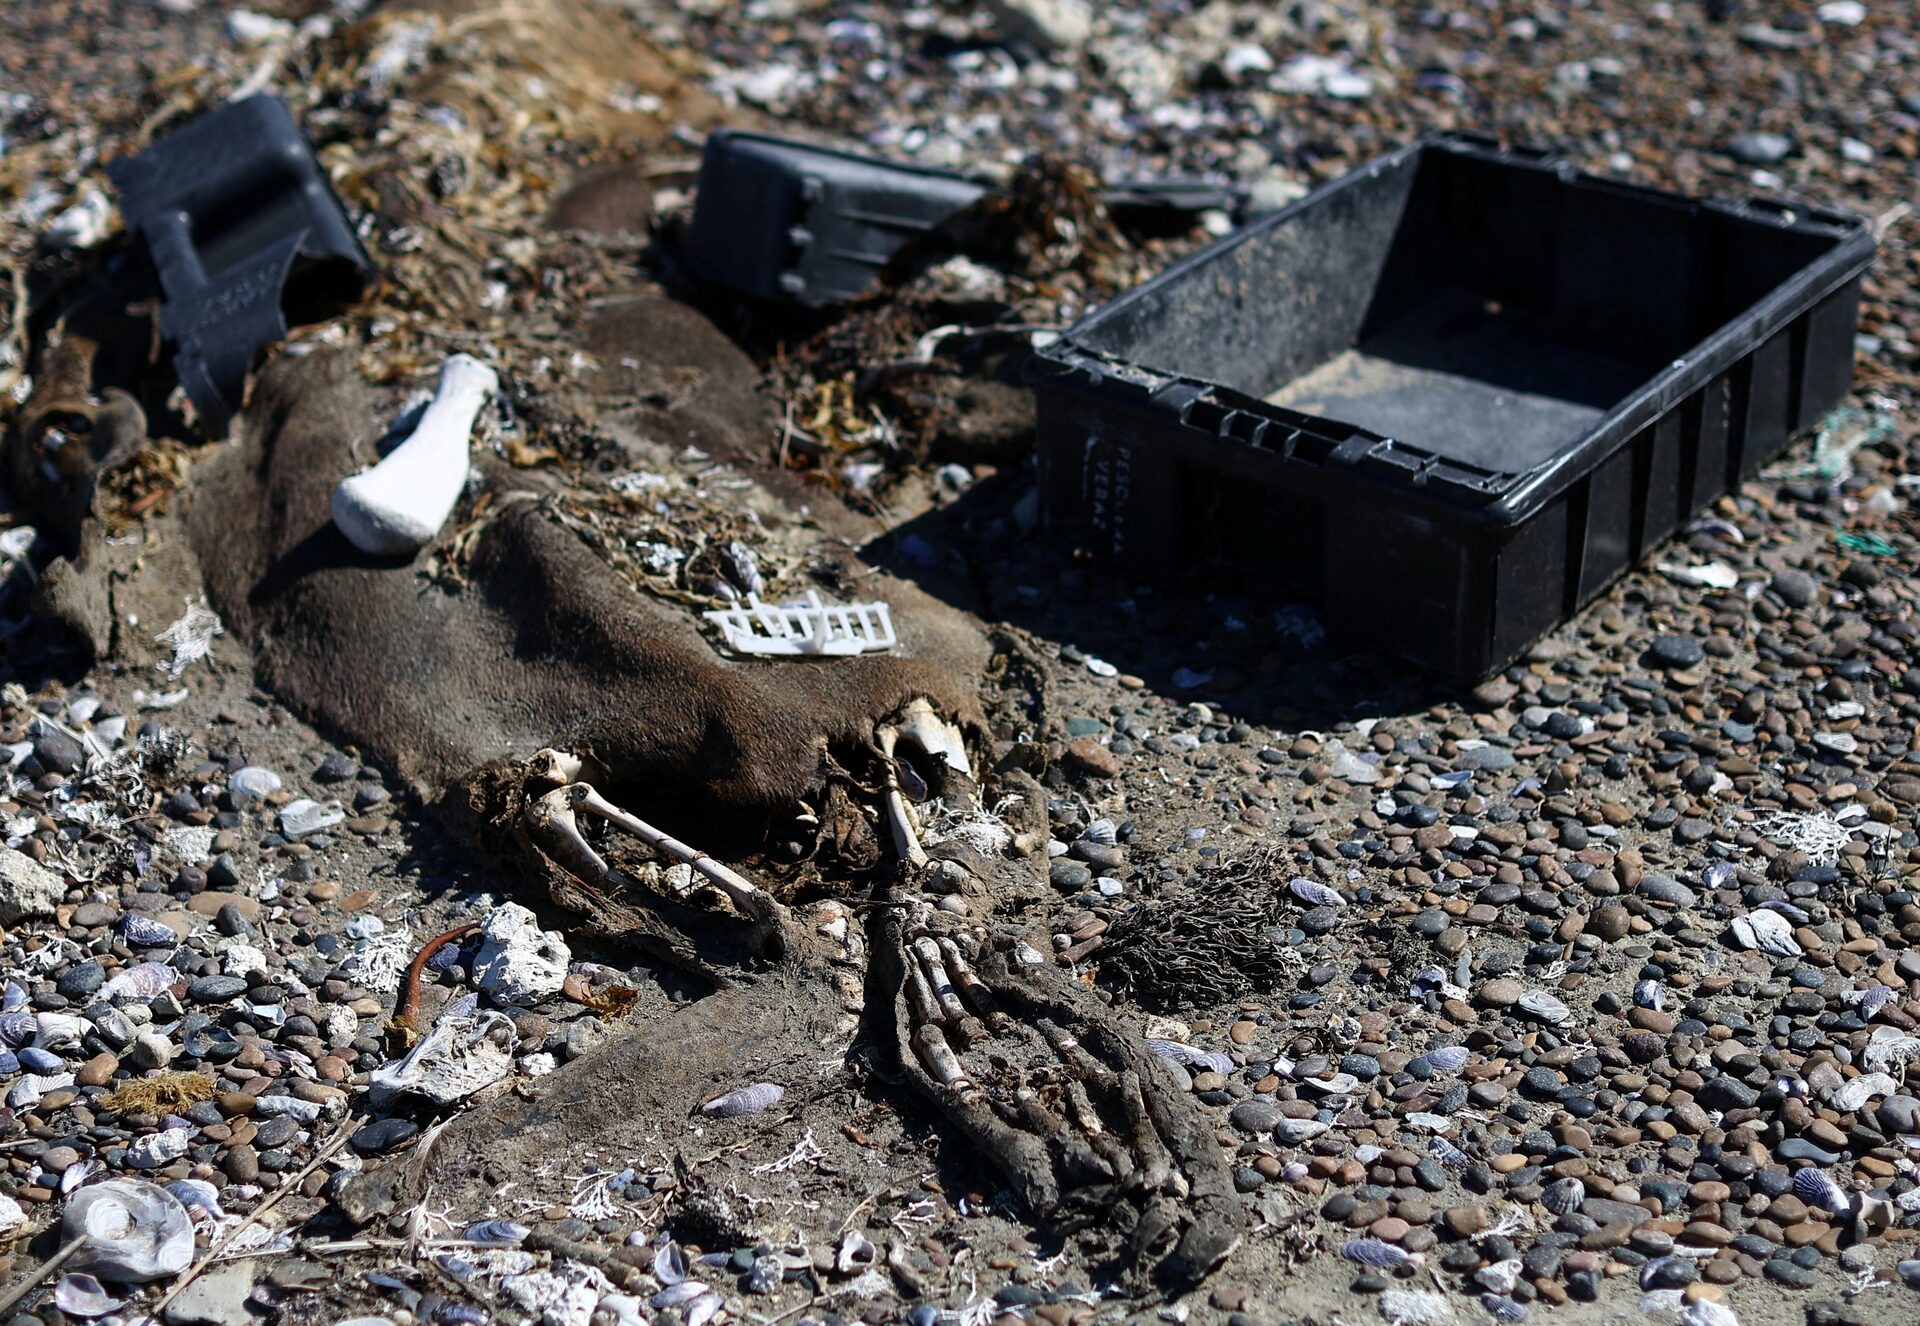
By Miguel Lo Bianco 4 October 2024 VALDES PENINSULA, Argentina (Reuters) – Mountains of plastic waste from the fishing industry have covered the coast along the Valdes Peninsula in Argentina’s Patagonia, threatening the lives of sea lions, fish, penguins and whales and also endangering human health. The coasts of the peninsula on Argentina’s Atlantic coast, […]
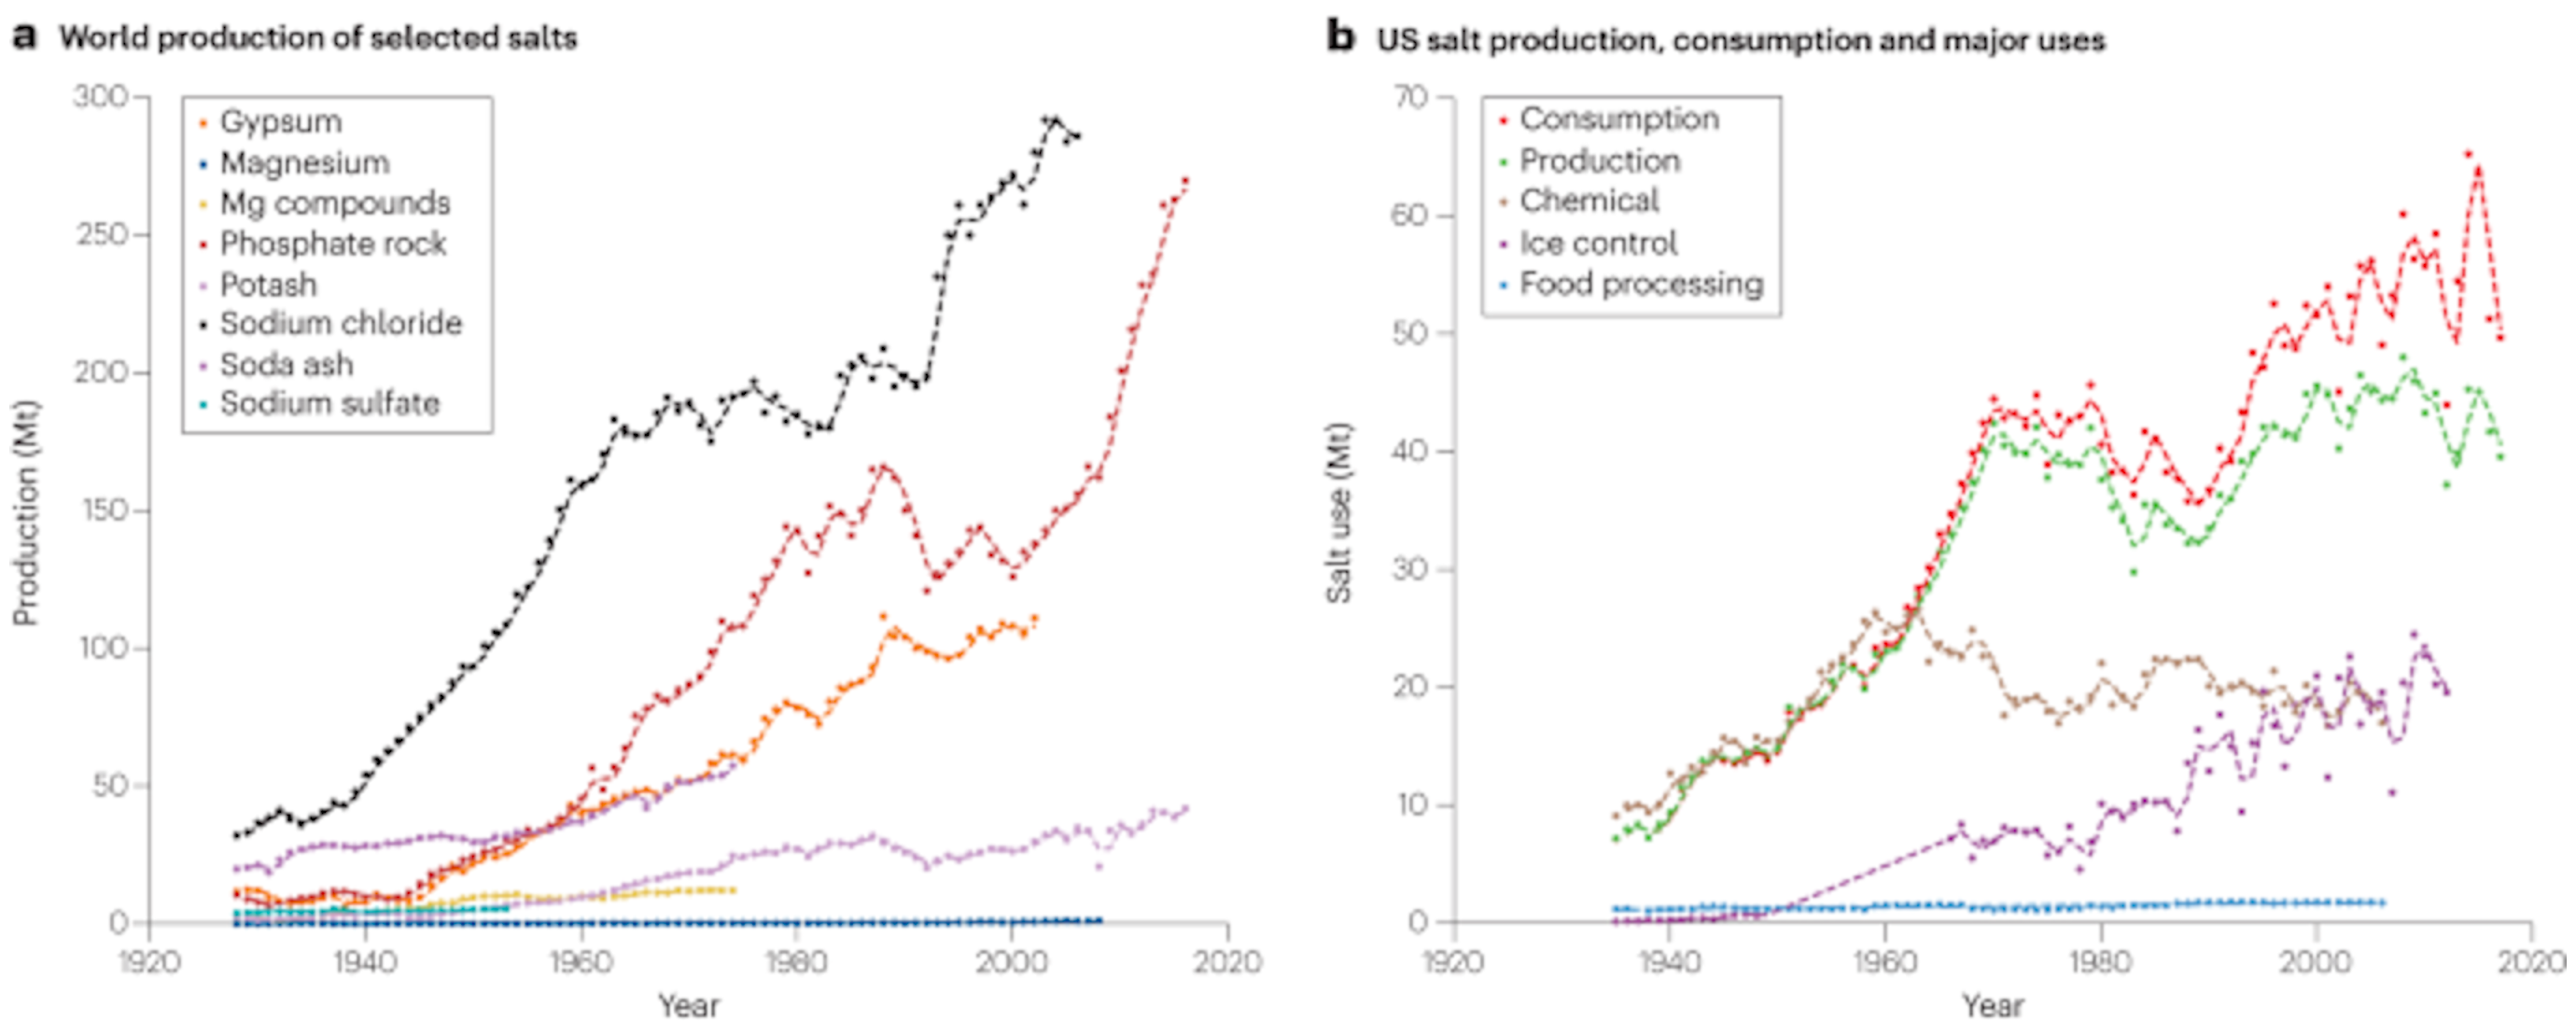
31 October 2023 (University of Maryland) – The influx of salt in streams and rivers is an ‘existential threat,’ according to a research team led by a UMD geologist. The planet’s demand for salt comes at a cost to the environment and human health, according to a new scientific review led by University of Maryland Geology Professor Sujay Kaushal. Published […]
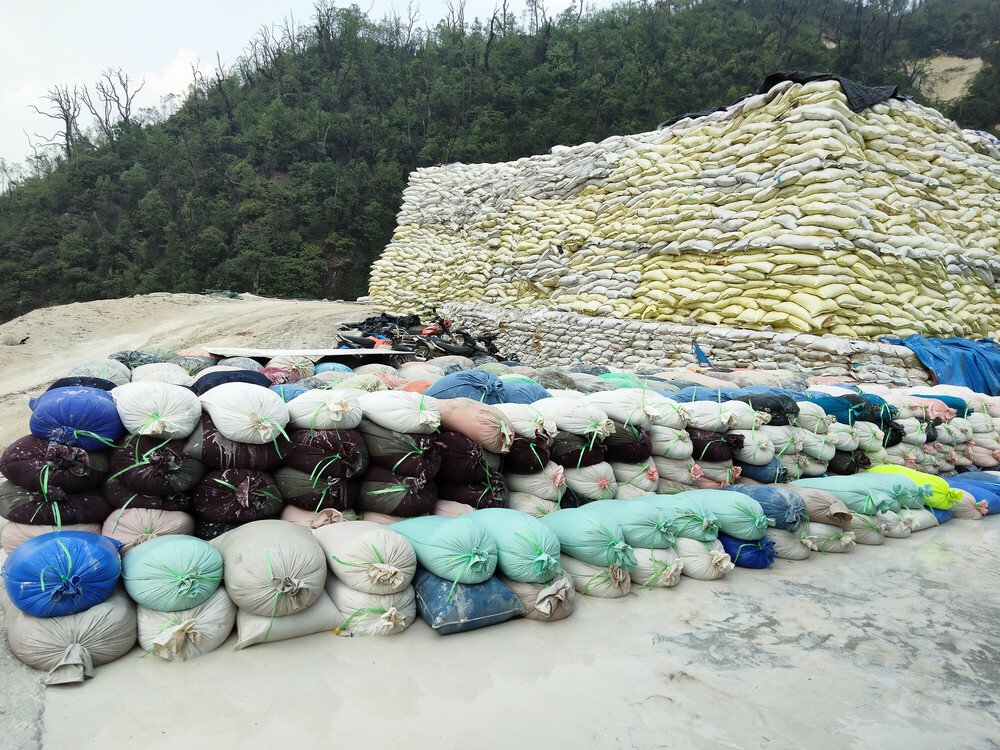
10 July 2024 (Global Witness) – Renewable energy is often hailed as a panacea for the energy crisis. But without better consultation and regulation, plans to expand mining for minerals central to the energy transition could be disastrous for people and the planet. To tackle the climate crisis, we need to transition away from fossil […]
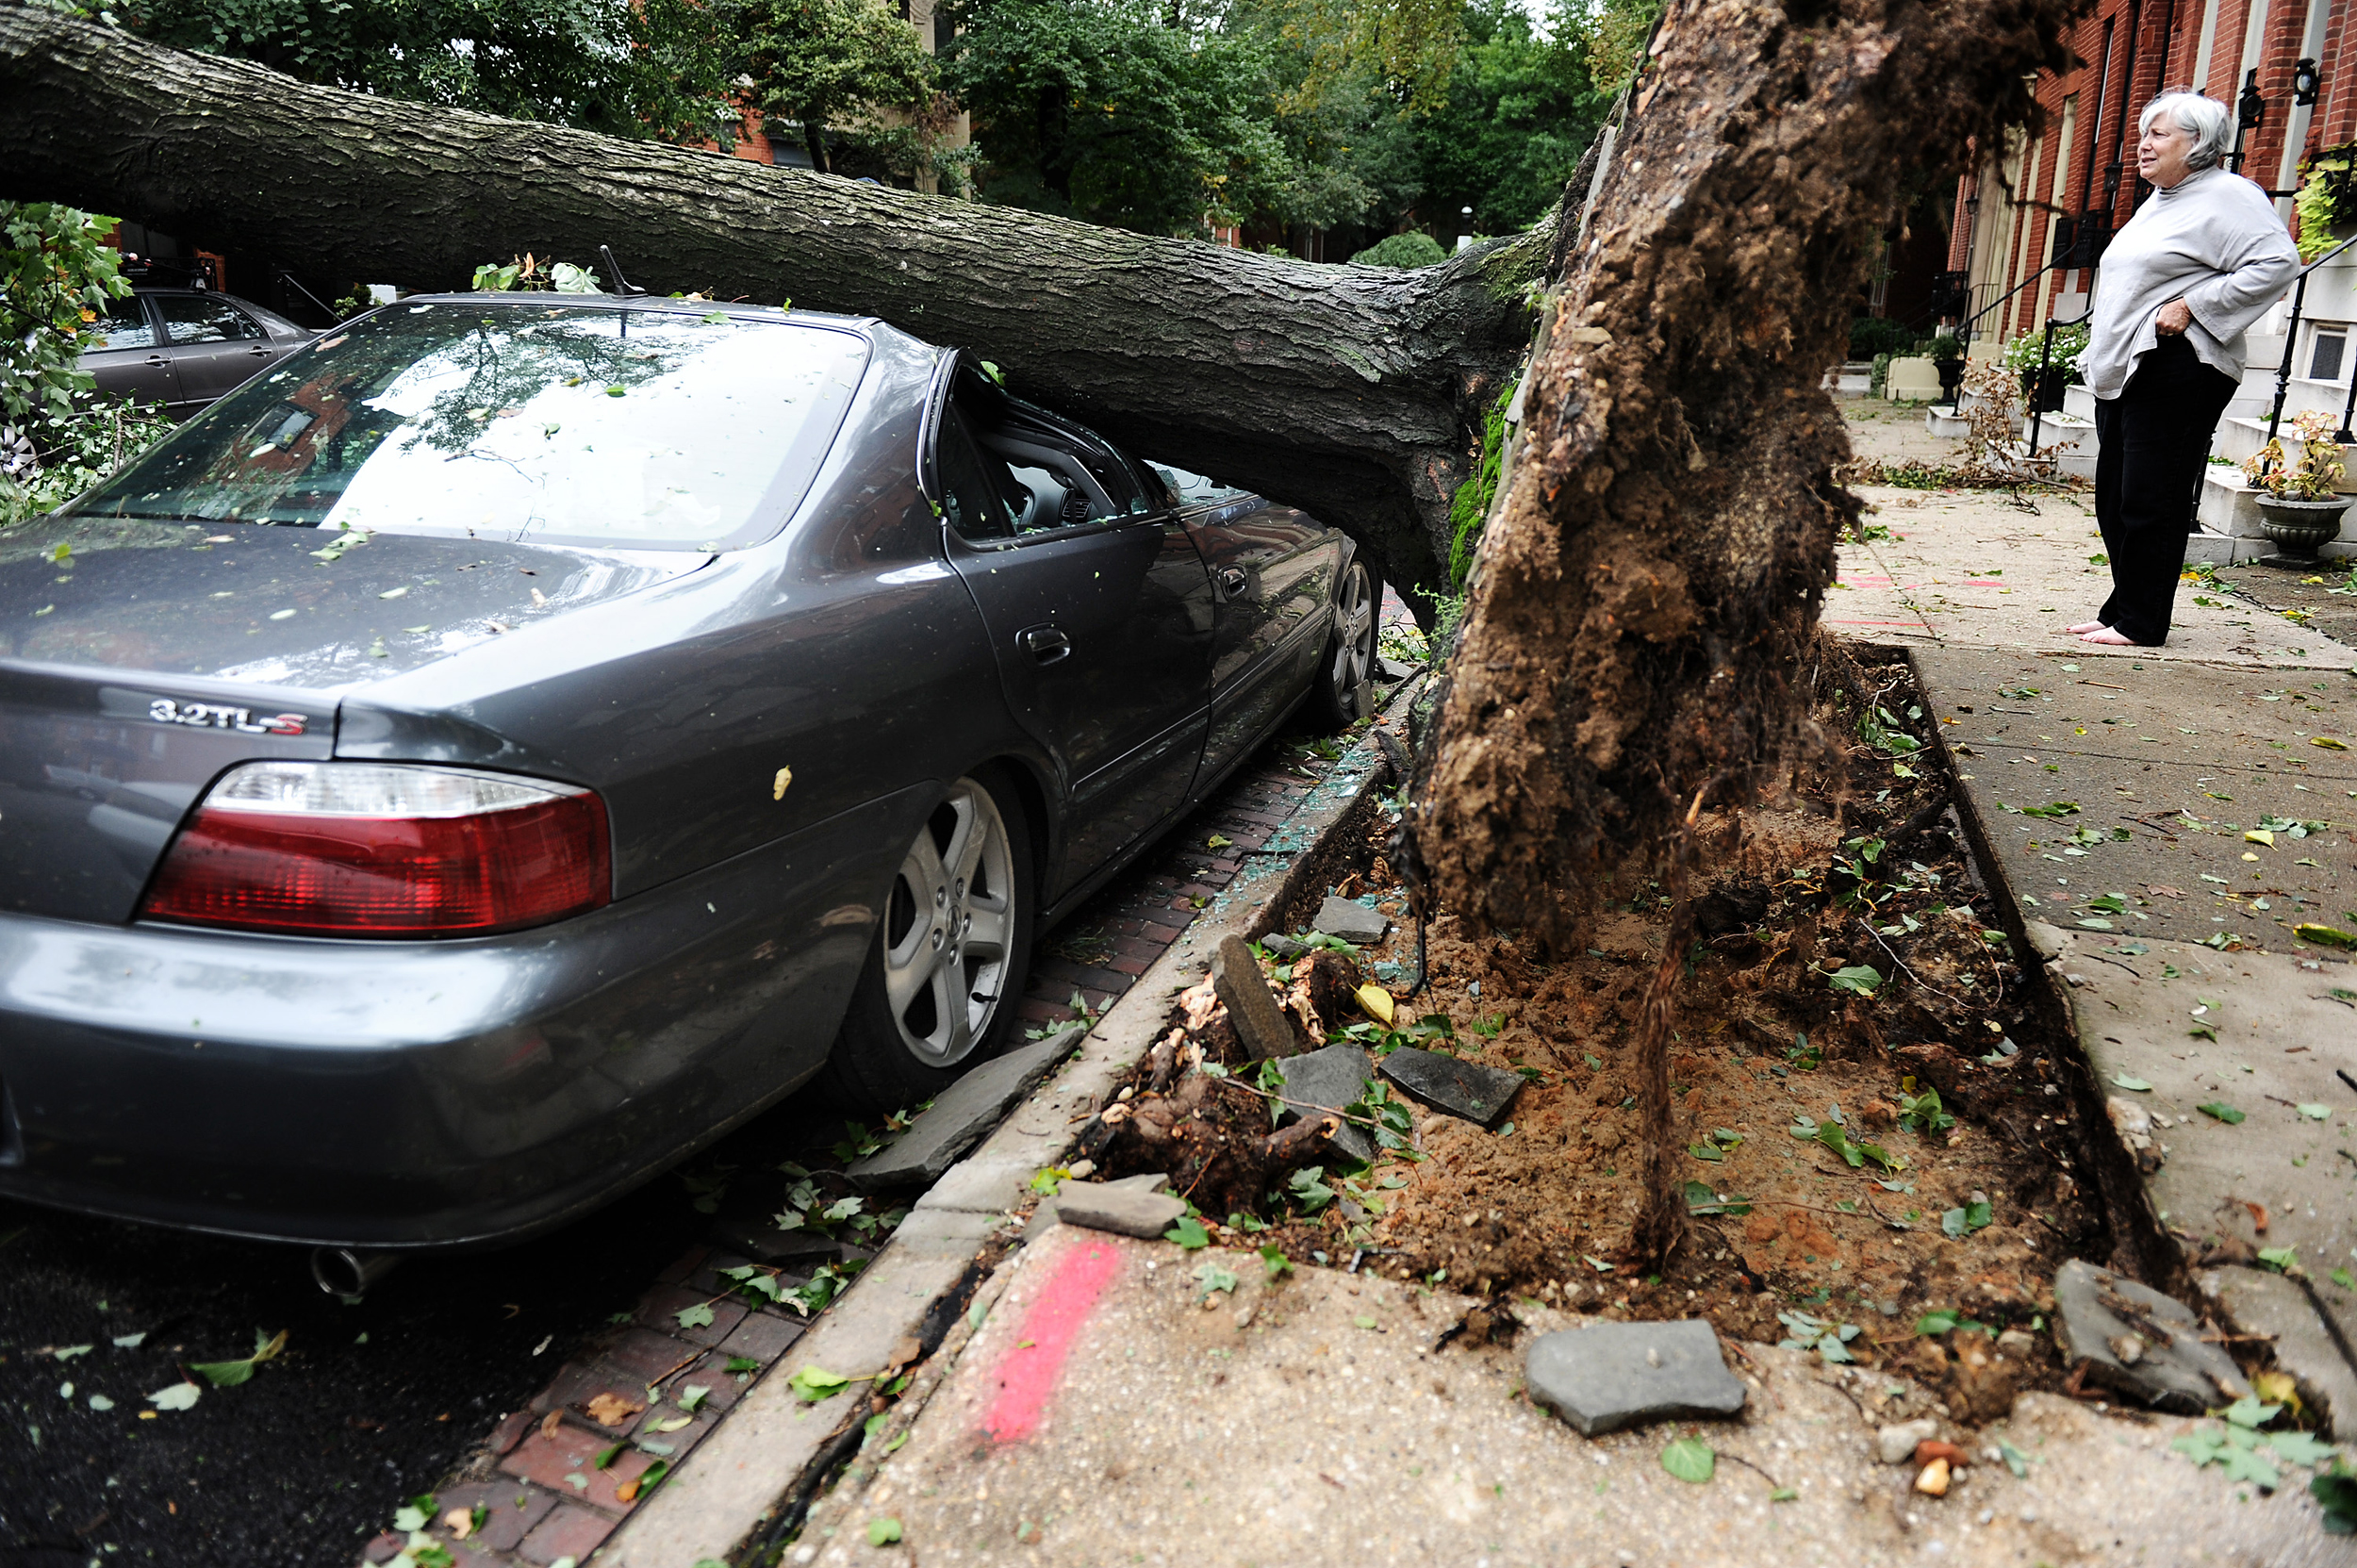
By Jules Feeney 27 July 2024 LOS ANGELES (The Guardian) – Oregon’s wildfire season is off to an explosive start with more than 1 million acres charred in less than a month, as experts warn that extreme heat and unusual lightning strikes are creating “catastrophic conditions” for fires to ignite and spread. The state is currently […]
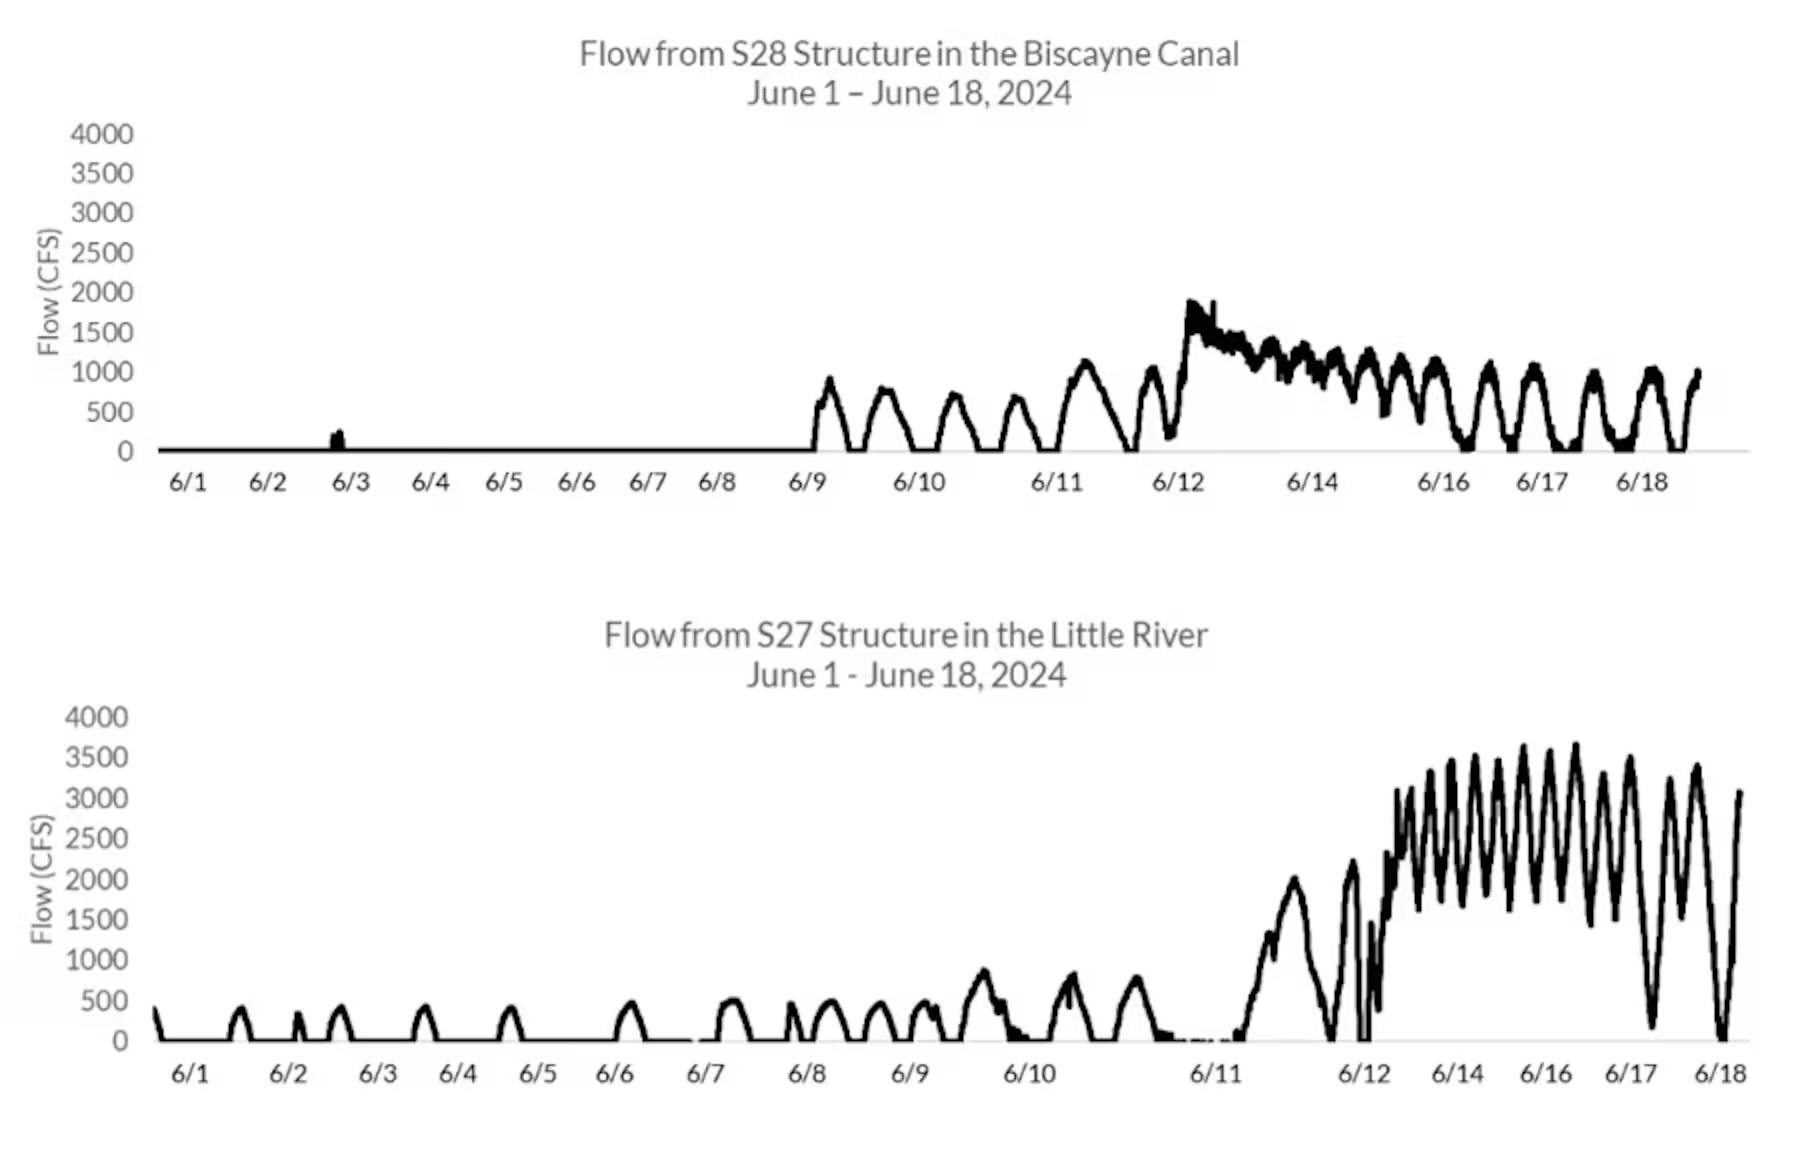
By Margaret Wong 23 July 2024 (The Cool Down) – Biscayne Bay is reeling from its fourth major fish kill in as many years, triggered by recent record flooding in South Florida. What’s happening? Torrential rains have inundated the region, causing a significant influx of freshwater into the bay, which has led to low salinity […]
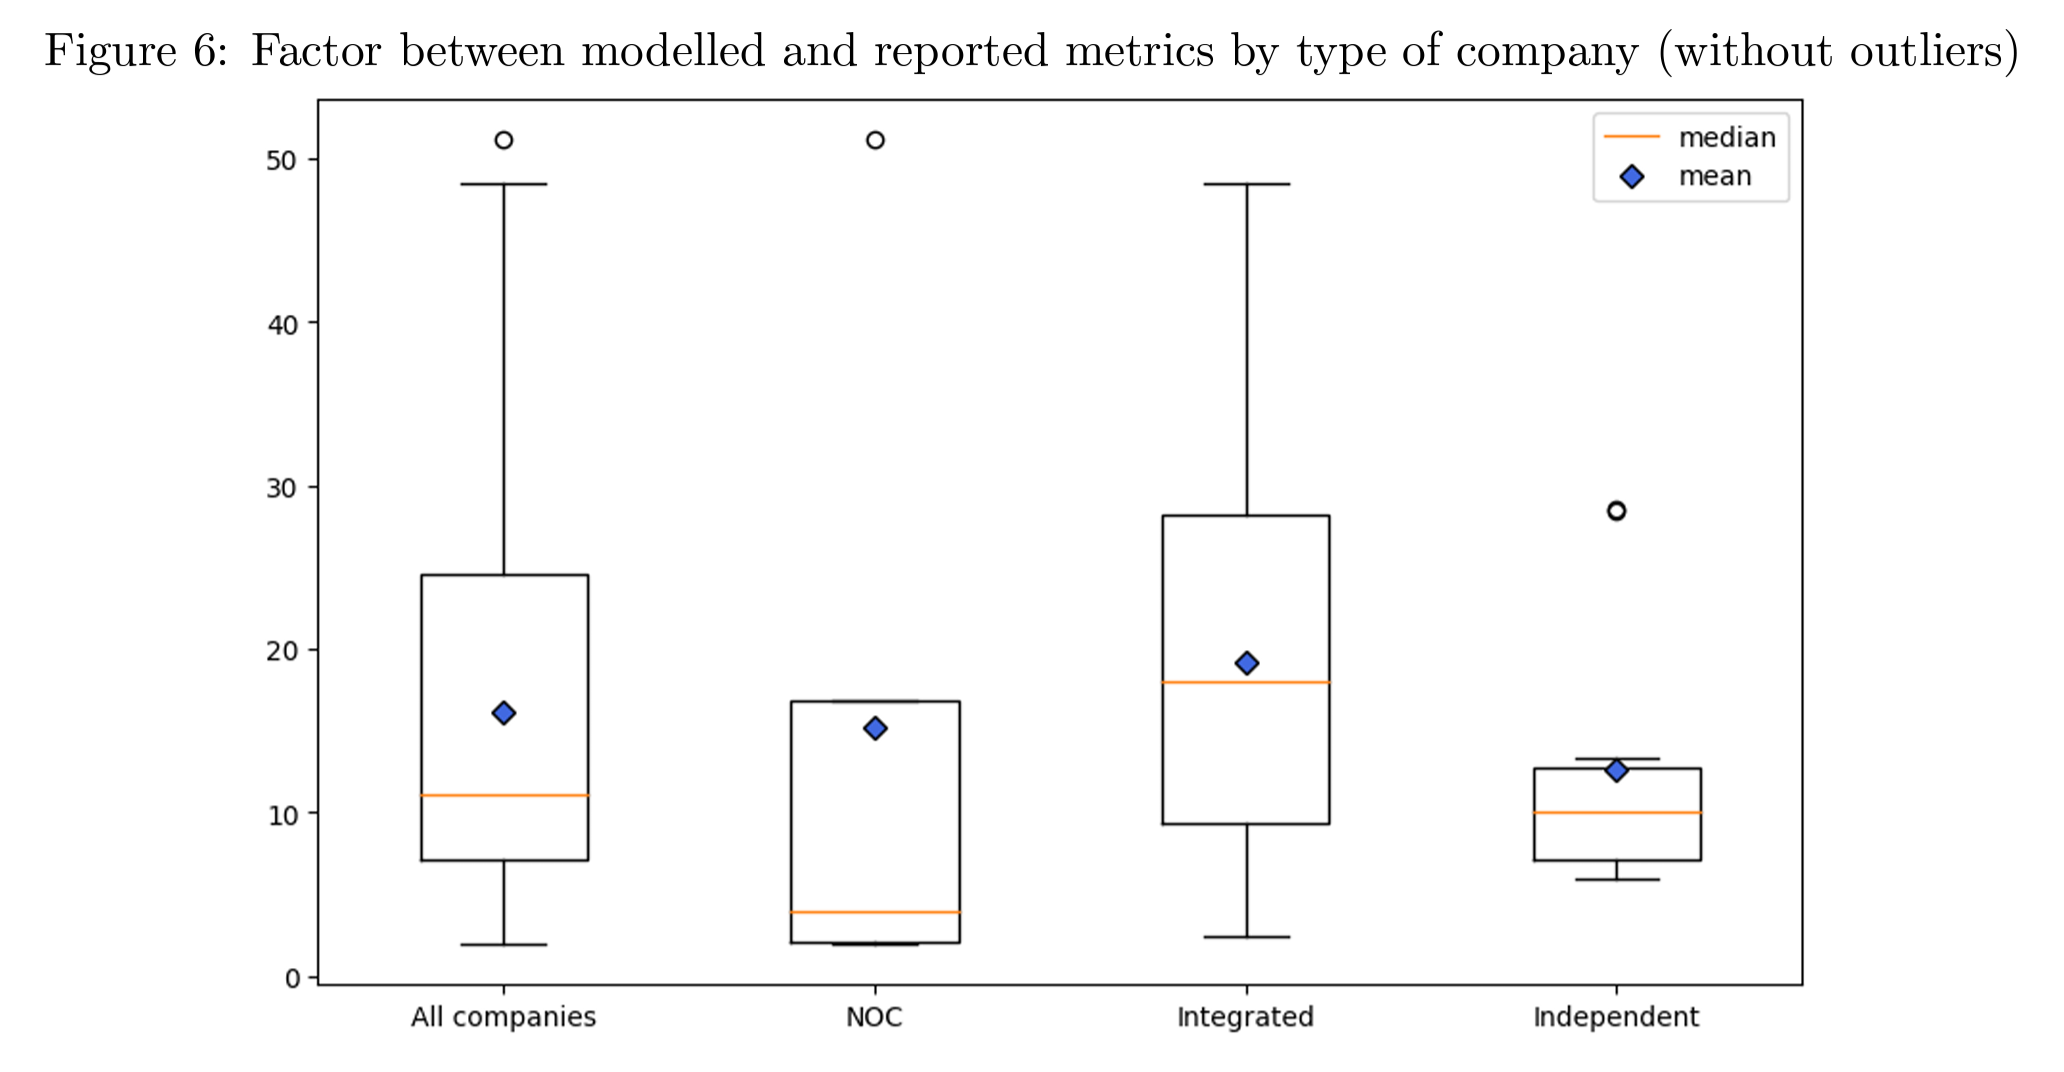
By Antoine Rostand 17 July 2024 (Fortune) – Committing countries or companies to climate pledges doesn’t guarantee that those pledges will be honored. After all, the planet is getting a great deal hotter every year, with the record-breaking temperature in India in May just the latest example. If companies and countries were fully honoring their […]
By Aman Azhar 13 July 2024 (Inside Climate News) – In a first of its kind decision, a Maryland judge on Wednesday tossed Baltimore City’s climate suit against major oil giants on the grounds that it is not the role of the state courts to address a global issue like climate change. Originally filed in […]
By Zack Budryk and Rachel Frazin 13 July 2025 (The Hill) – Project 2025, a controversial conservative roadmap that aims to guide the next Republican administration, calls for the elimination of multiple energy- and environment-related offices and rules — moves that would restrict the government’s ability to combat climate change and pollution. Policies promoted under the plan […]
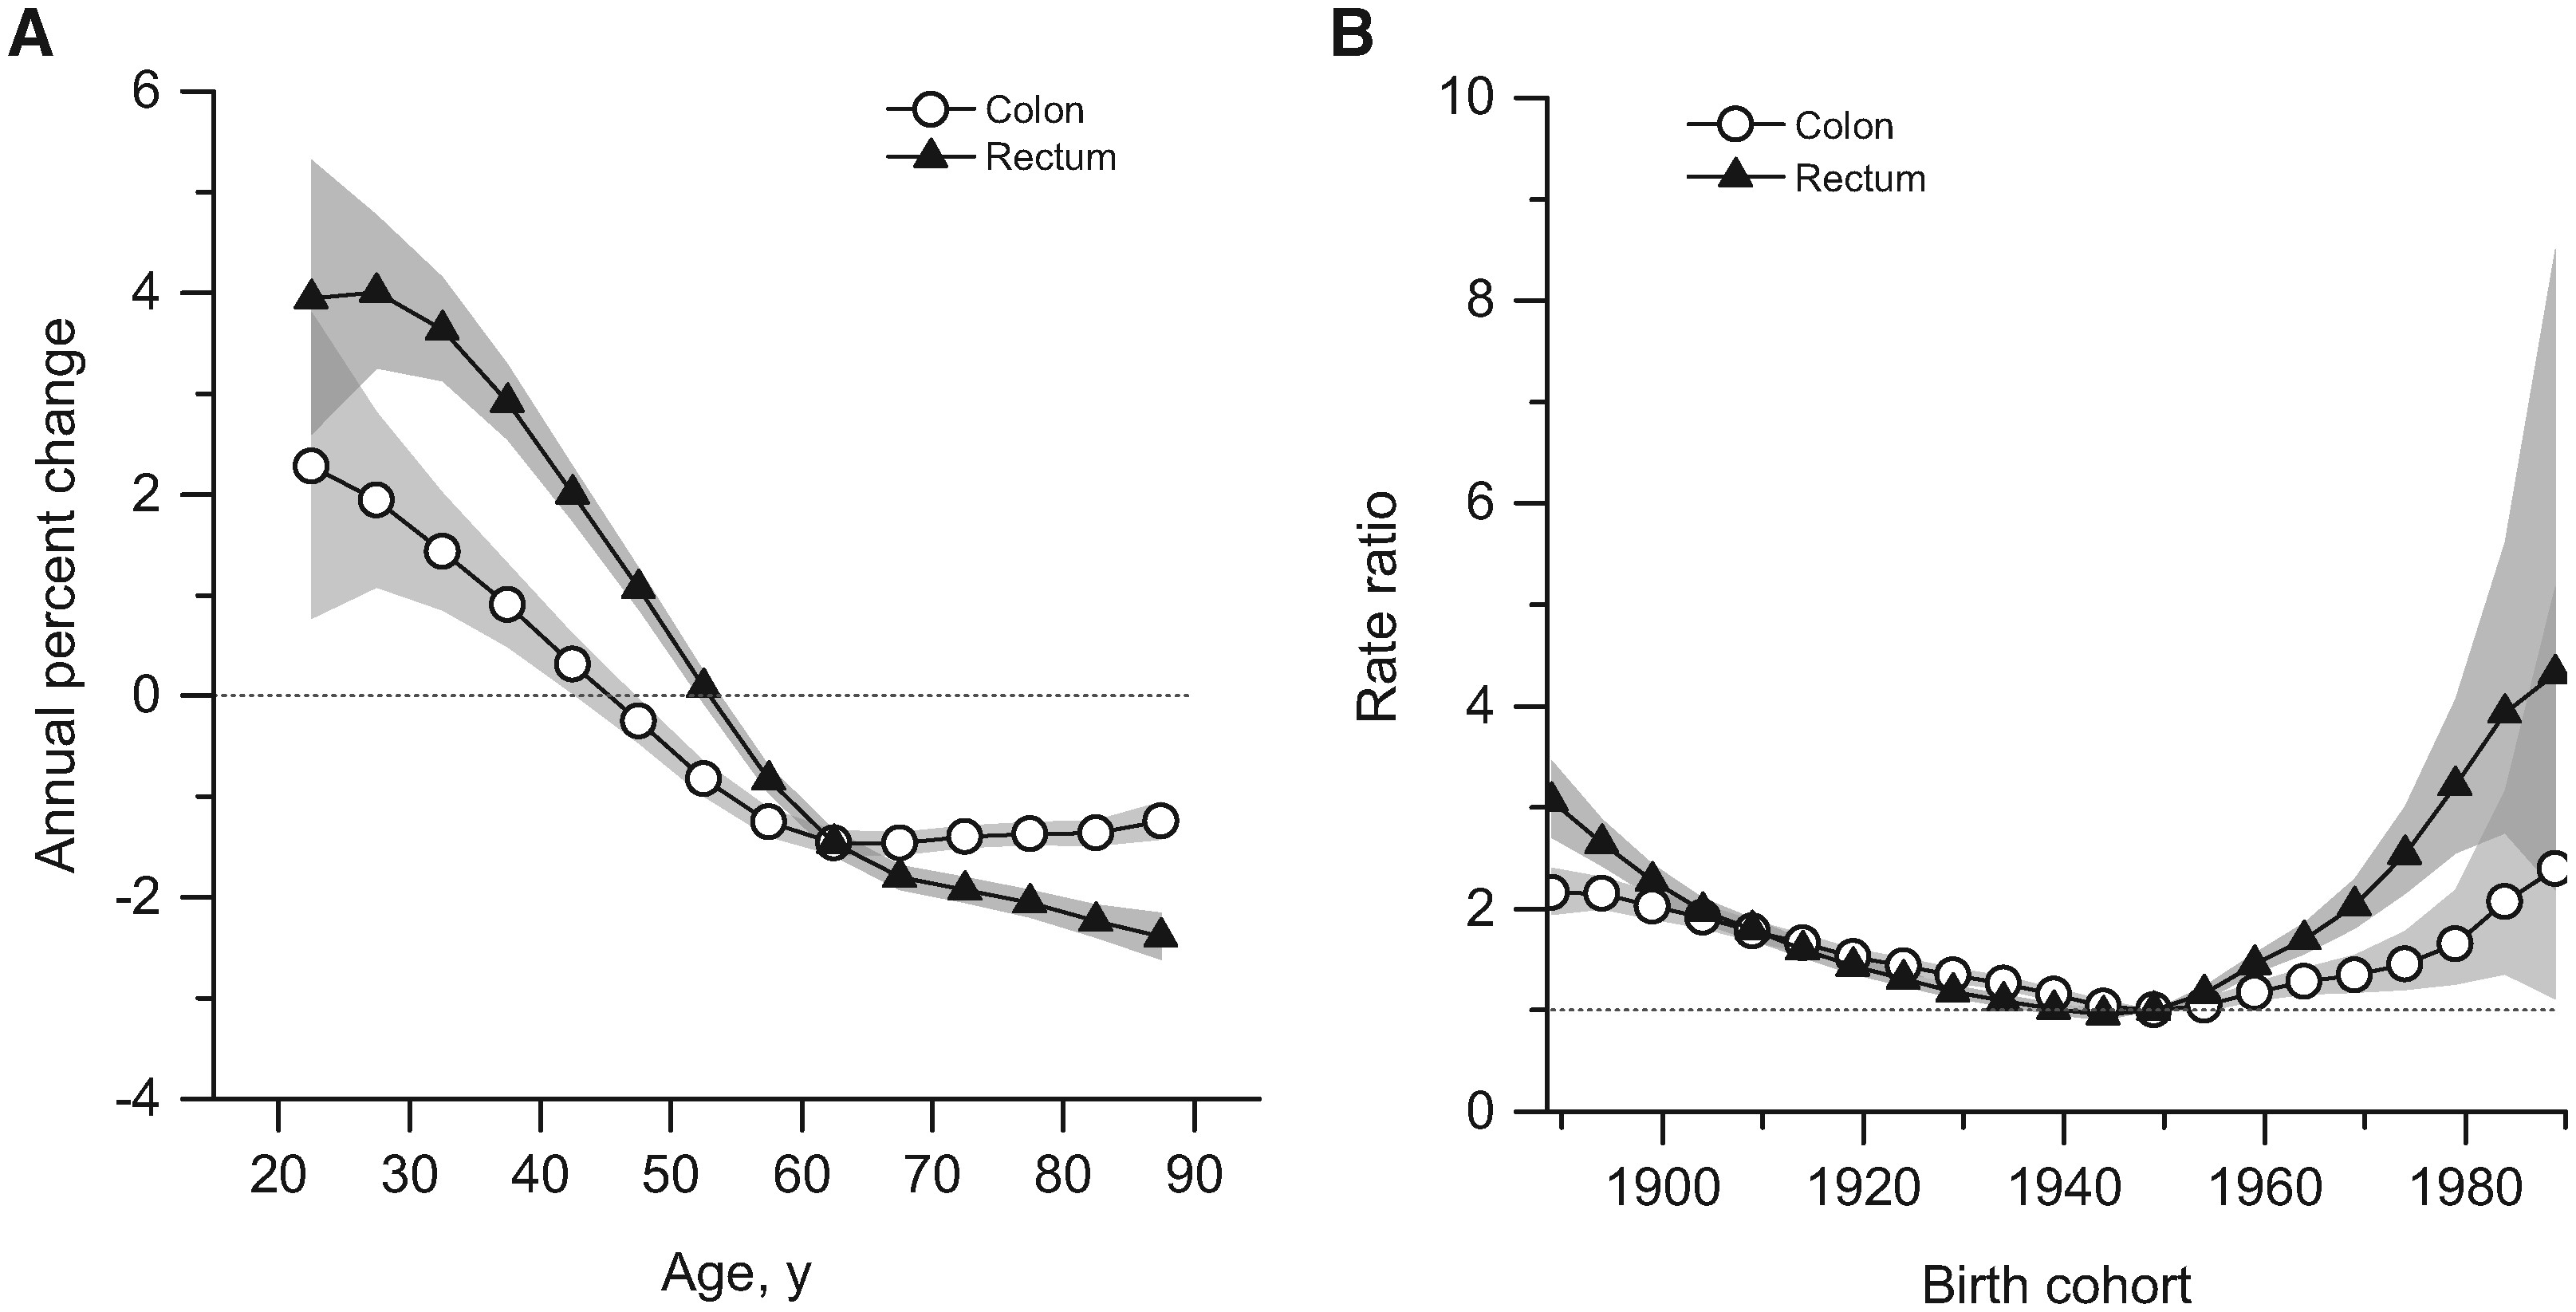
By Brianna Abbott 11 January 2024 (The Wall Street Journal) – Meilin Keen was studying for the bar exam and preparing to move to New York City last June when she started throwing up blood. Keen, 27 years old, learned days later that she has gastric cancer. She postponed the bar exam. Brain fog from […]
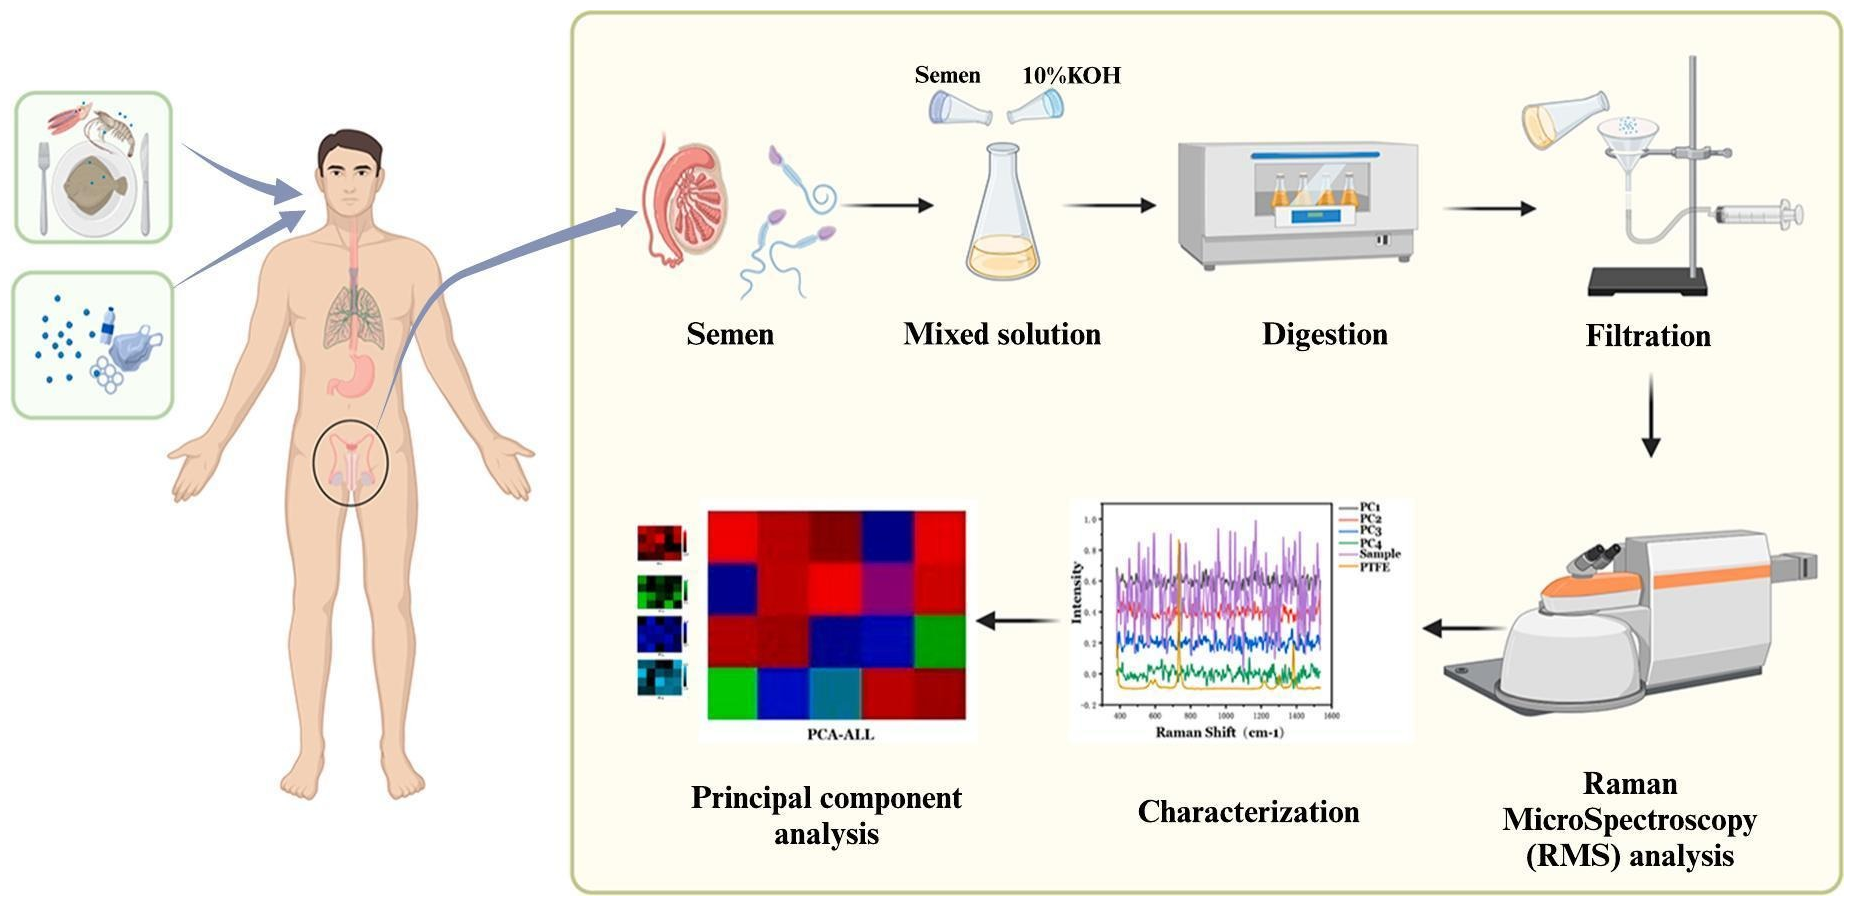
By Damian Carrington 10 June 2024 (The Guardian) – Microplastic pollution has been found in all human semen samples tested in a study, and researchers say further research on the potential harm to reproduction is “imperative”. Sperm counts in men have been falling for decades and 40% of low counts remain unexplained, although chemical pollution has been implicated by many […]