By William Joy 25 August 2021 BURLESON, Texas (WFAA) – Inside 731 Farm Store in Burleson, Matt Meredith has taped up a warning from the FDA about ivermectin. “Not for human consumption. It says it on the bottle,” Meredith said. “It’s for deworming cattle, deworming horses.” Many people have started taking it to treat or […]
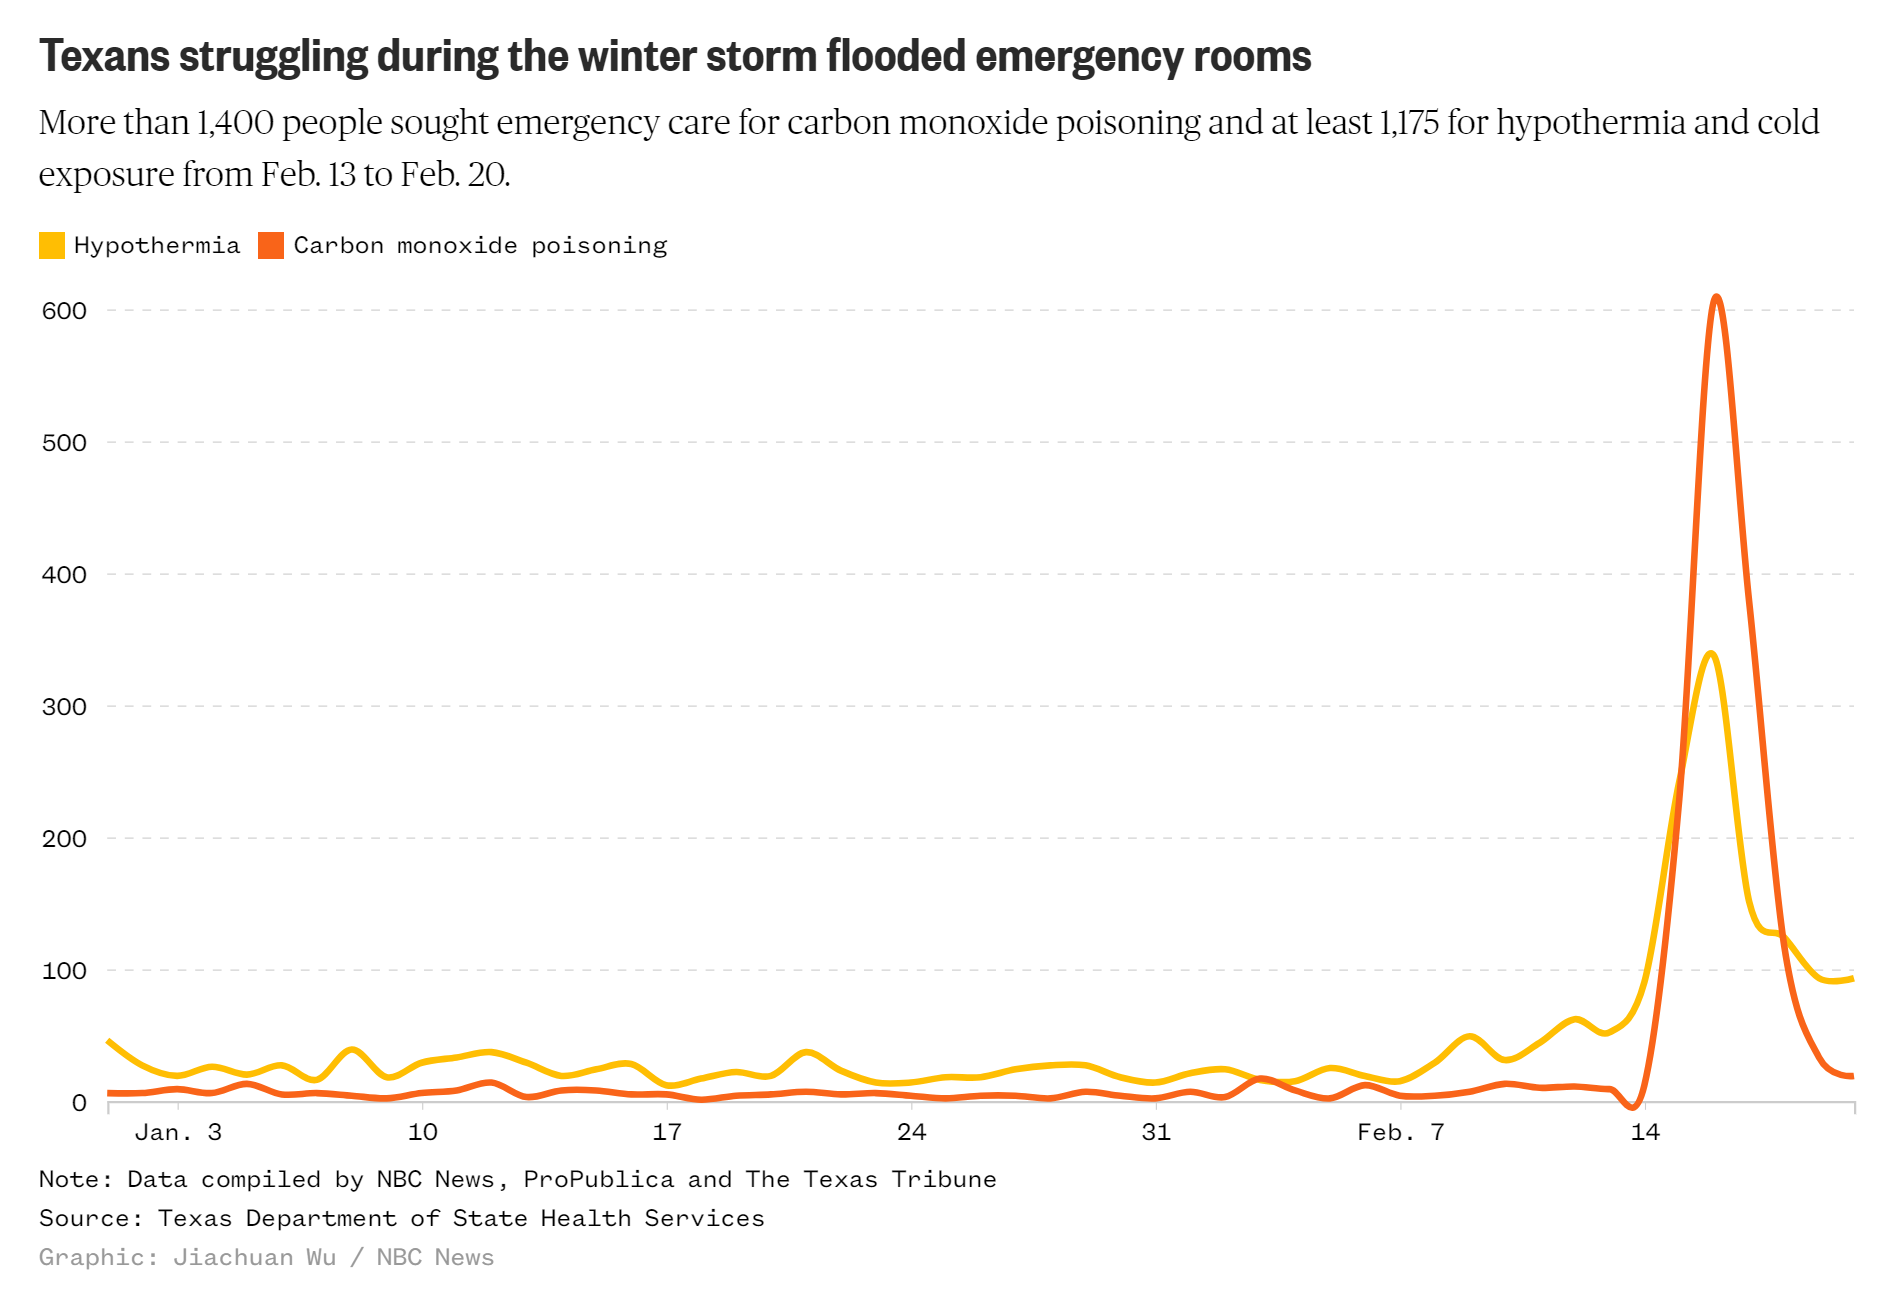
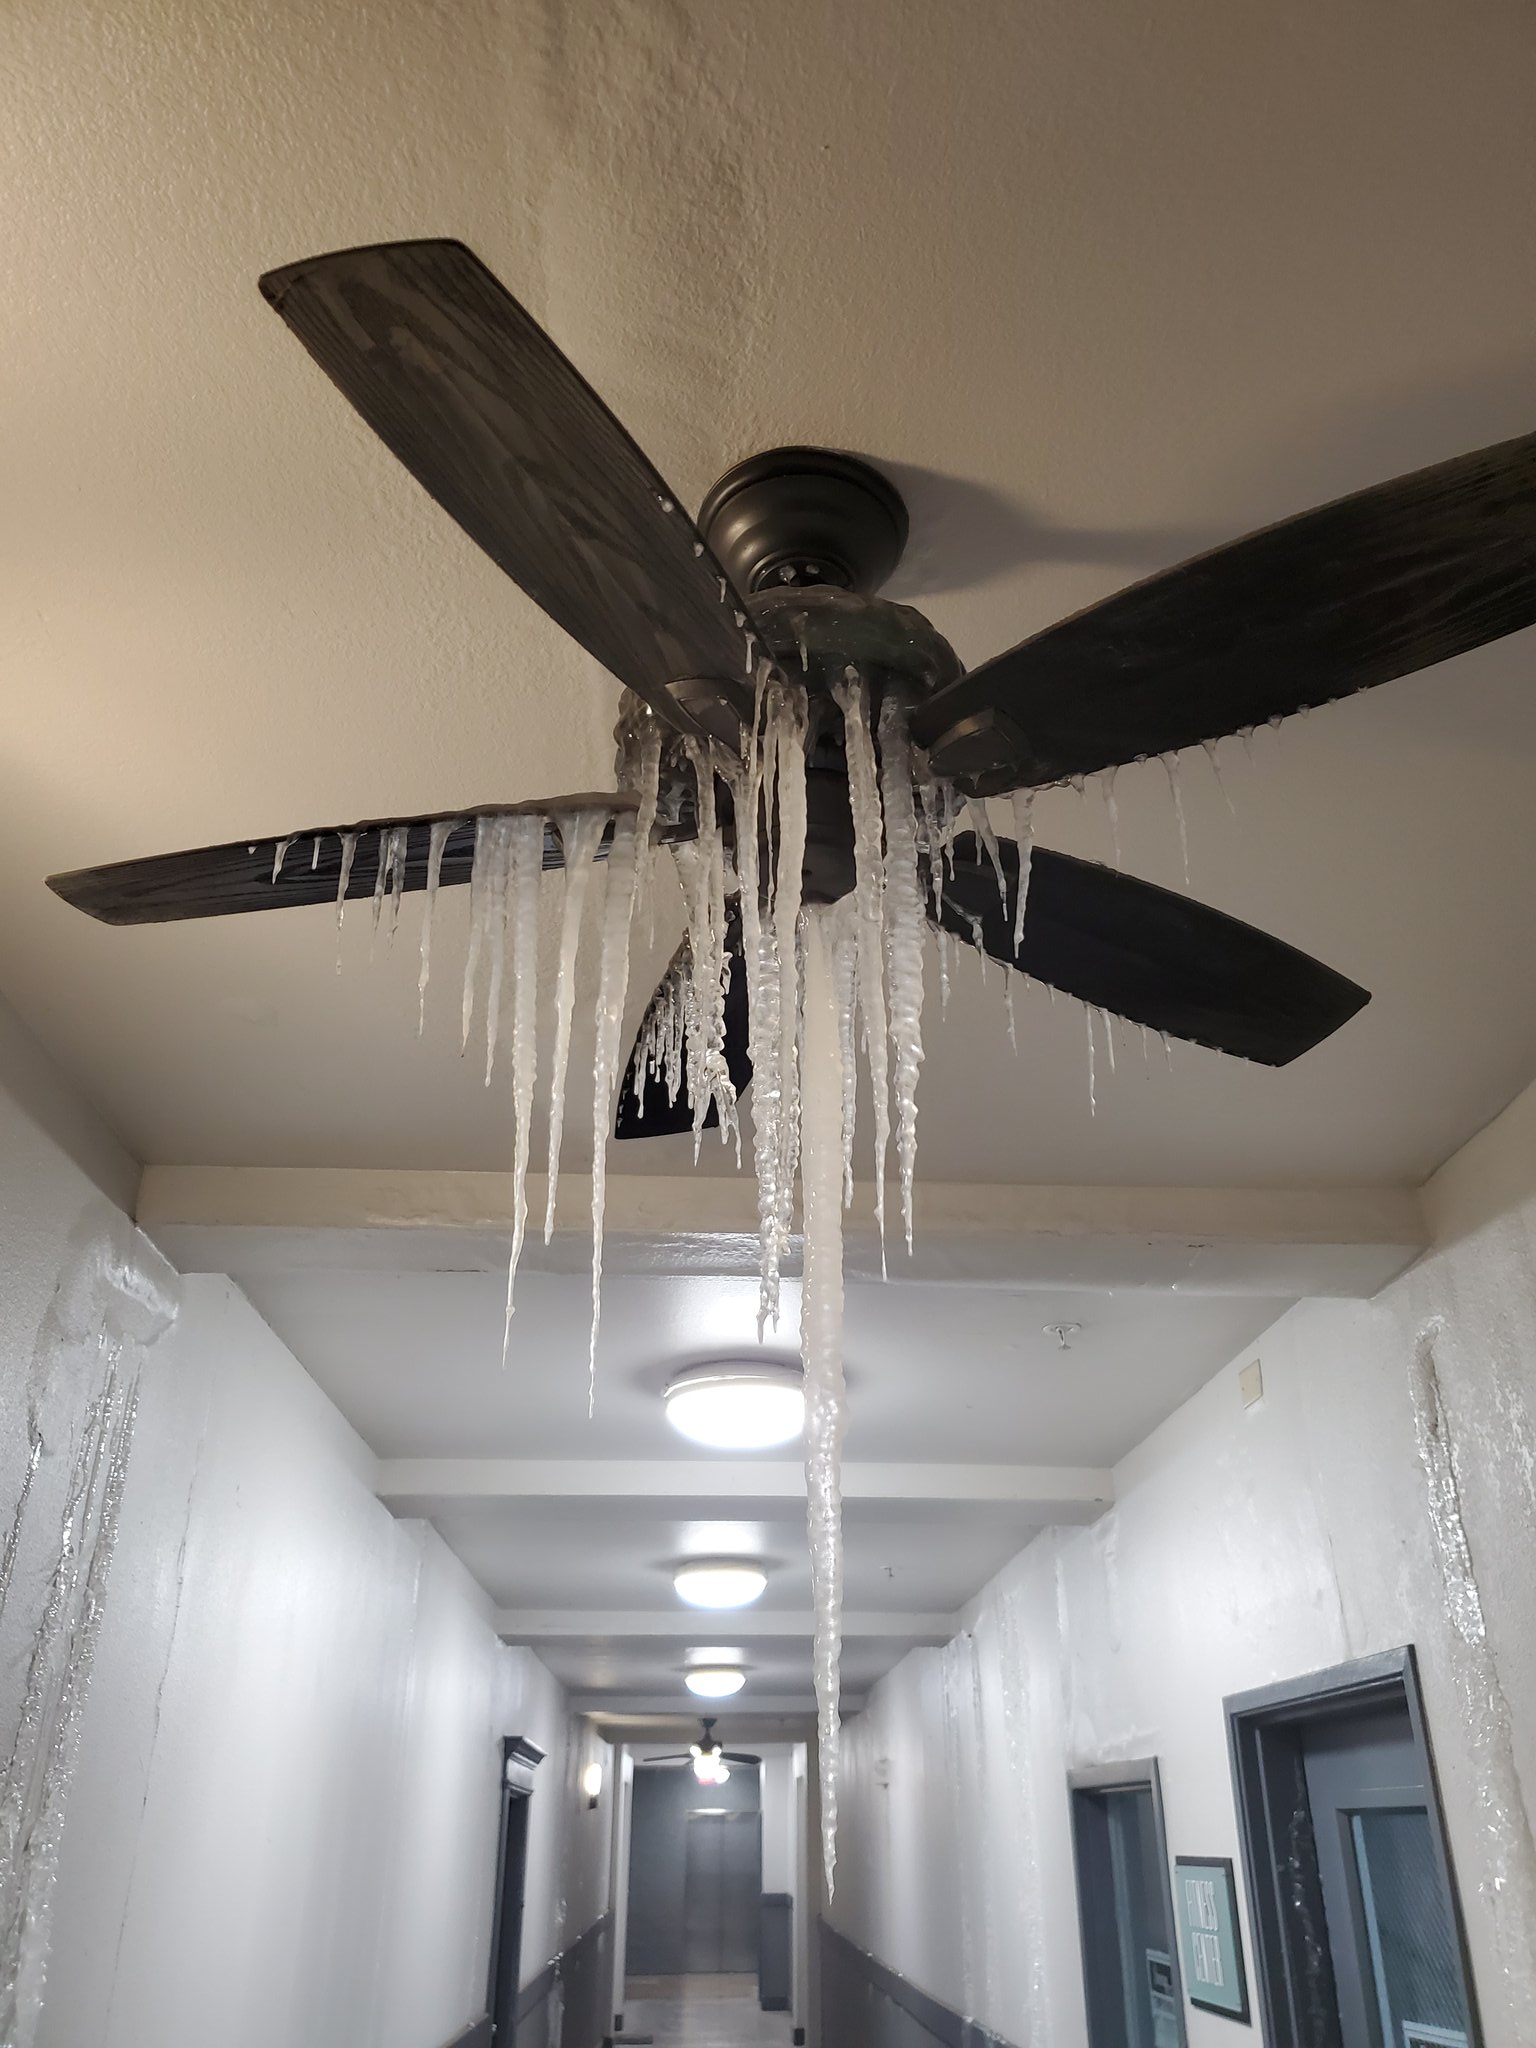
By Mike Hixenbaugh, Suzy Khimm, Perla Trevizo, , Ren Larson, and Lexi Churchill 29 April 2021 HOUSTON (The Texas Tribune) – When Shalemu Bekele awoke on the morning of 15 February 2021, the townhouse he shared with his wife and two children was so cold, his fingers felt numb. After bundling up in extra layers, […]
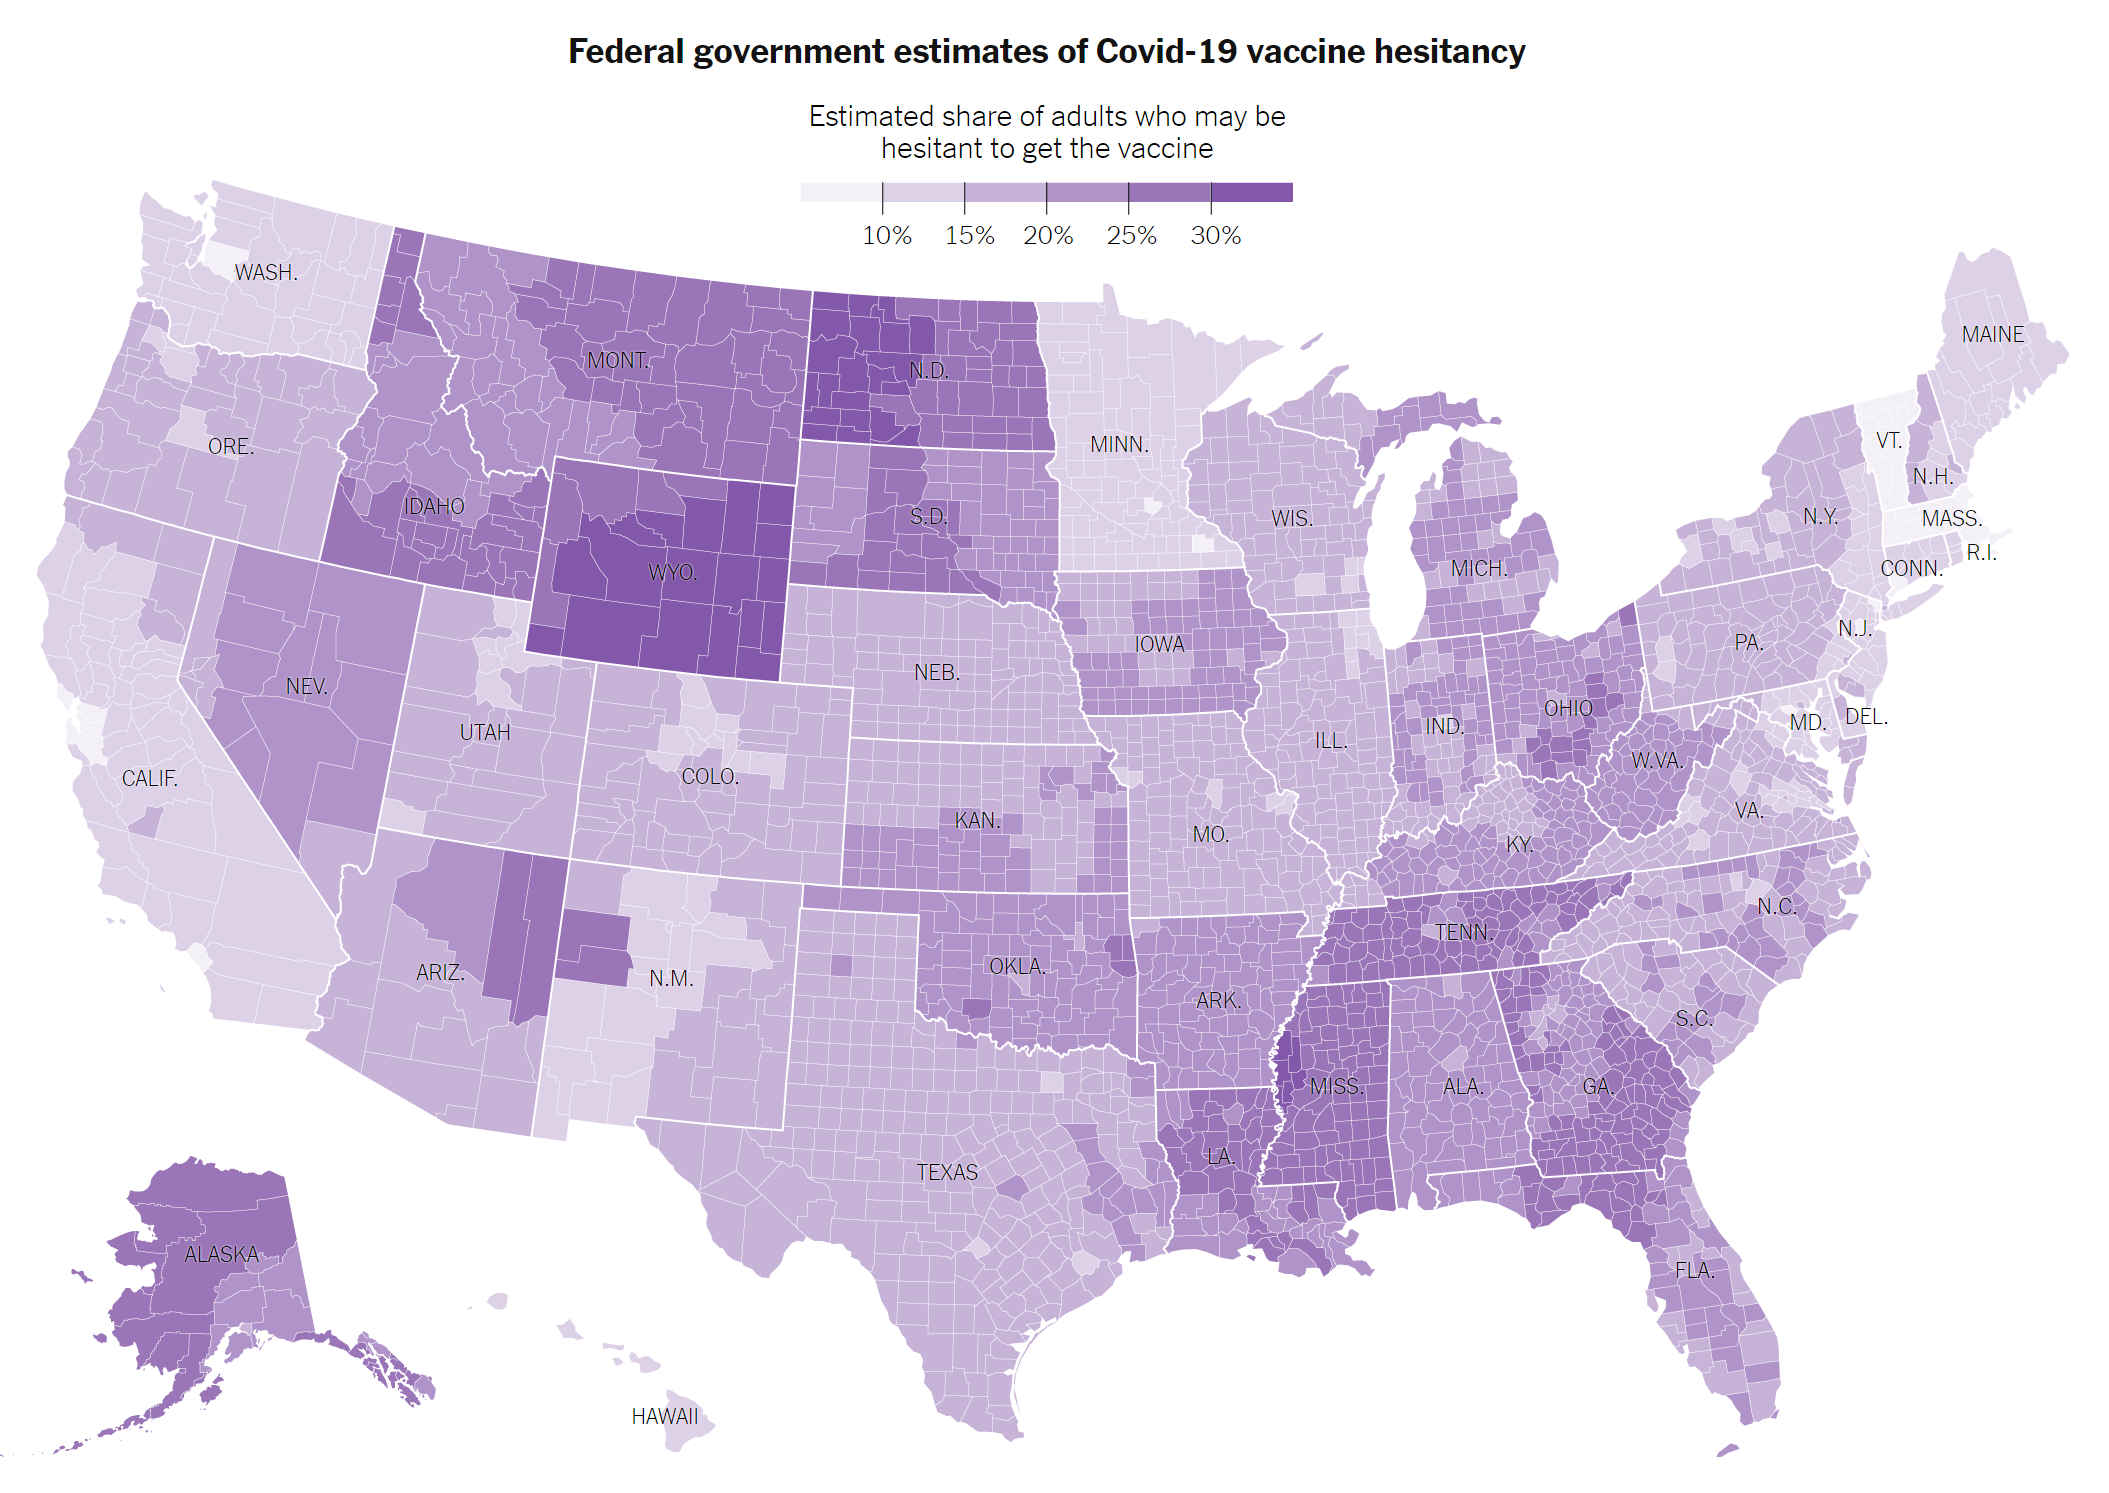
By Danielle Ivory, Lauren Leatherby, and Robert Gebeloff 17 April 2021 (The New York Times) – About 31 percent of adults in the United States have now been fully vaccinated. Scientists have estimated that 70 to 90 percent of the total population must acquire resistance to the virus to reach herd immunity. But in hundreds […]
By Karen Attiah 5 March 2021 DALLAS, Texas (The Washington Post) – As spring makes inroads down here in North Texas, the impending reopening of the state feels ominously like a death trap. At a Mexican restaurant in Lubbock this week, Gov. Greg Abbott (R)proclaimed that he would issue an executive order to open Texas up “100 […]
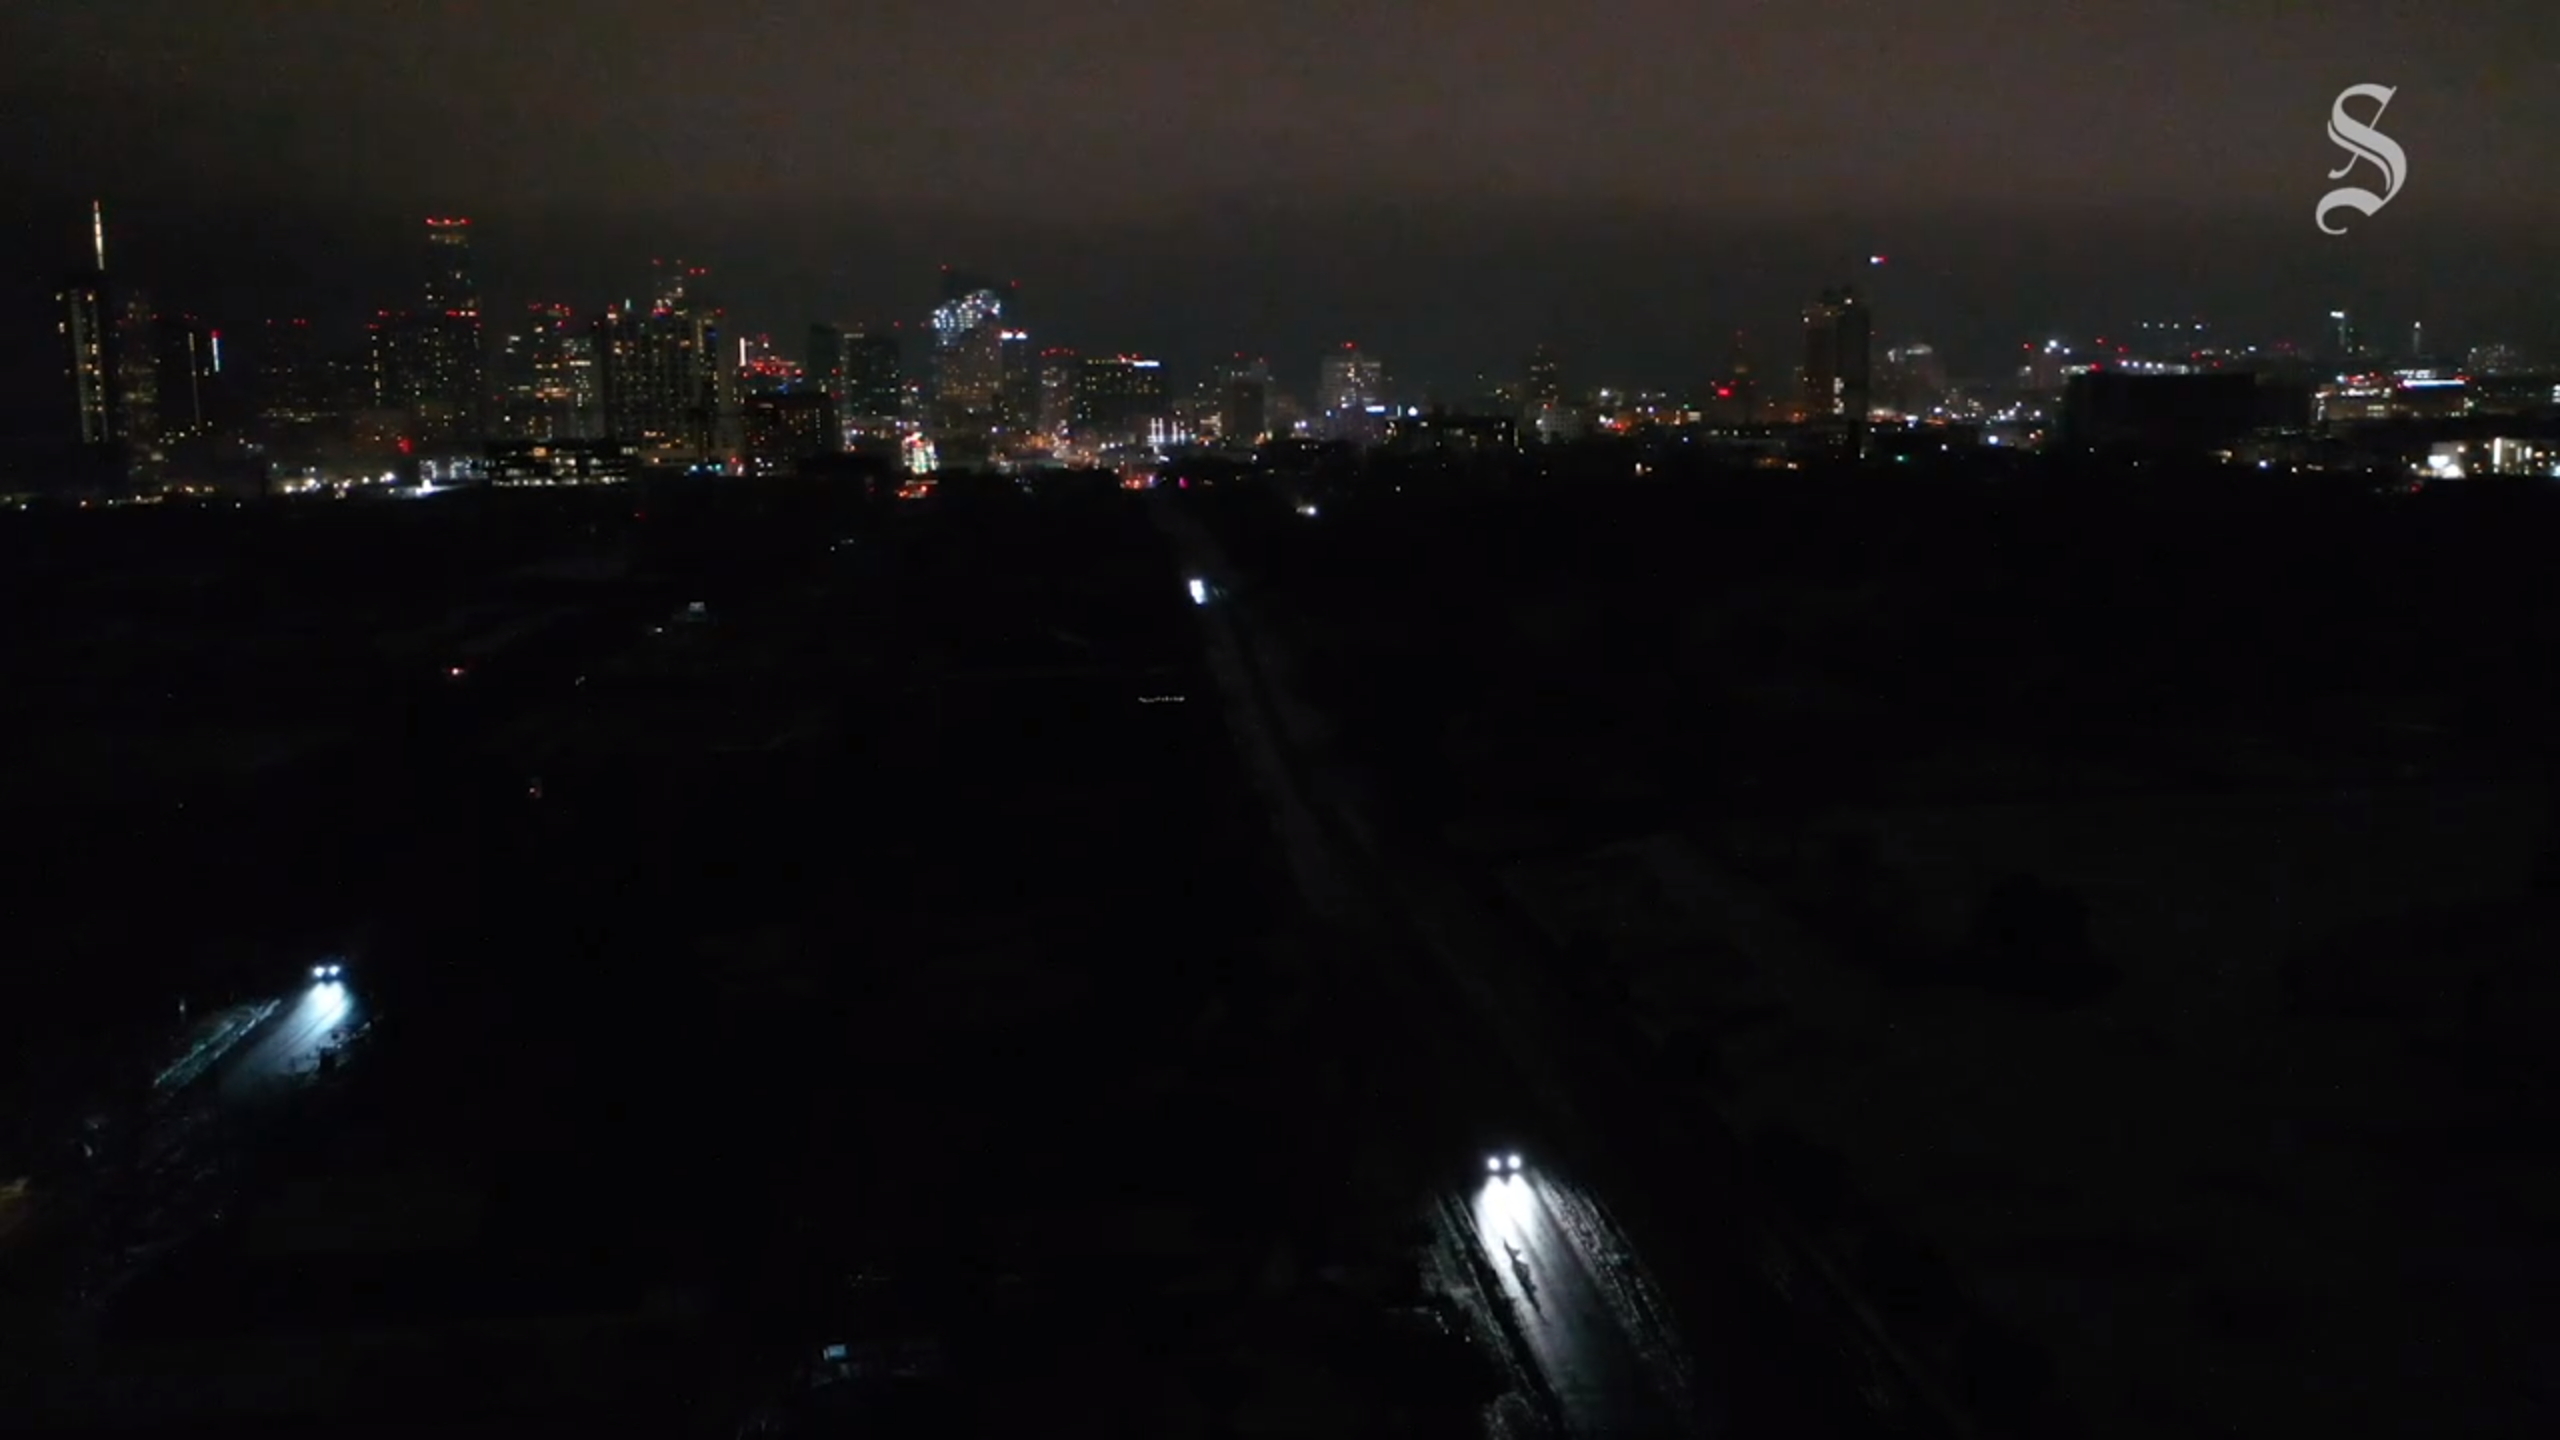
By Tom McGinty and Scott Patterson 24 February 2021 (The Wall Street Journal) – Texas’s deregulated electricity market, which was supposed to provide reliable power at a lower price, left millions in the dark last week. For two decades, its customers have paid more for electricity than state residents who are served by traditional utilities, a Wall […]
By Michelle Chapman and David Koenig 1 March 2021 (AP) – The largest and oldest power cooperative in Texas is filing for bankruptcy protection, citing last month’s winter storm that left millions without power, and it is unlikely to be the last utility to seek shelter in the courts. Brazos Electric Power Cooperative serves distributors […]
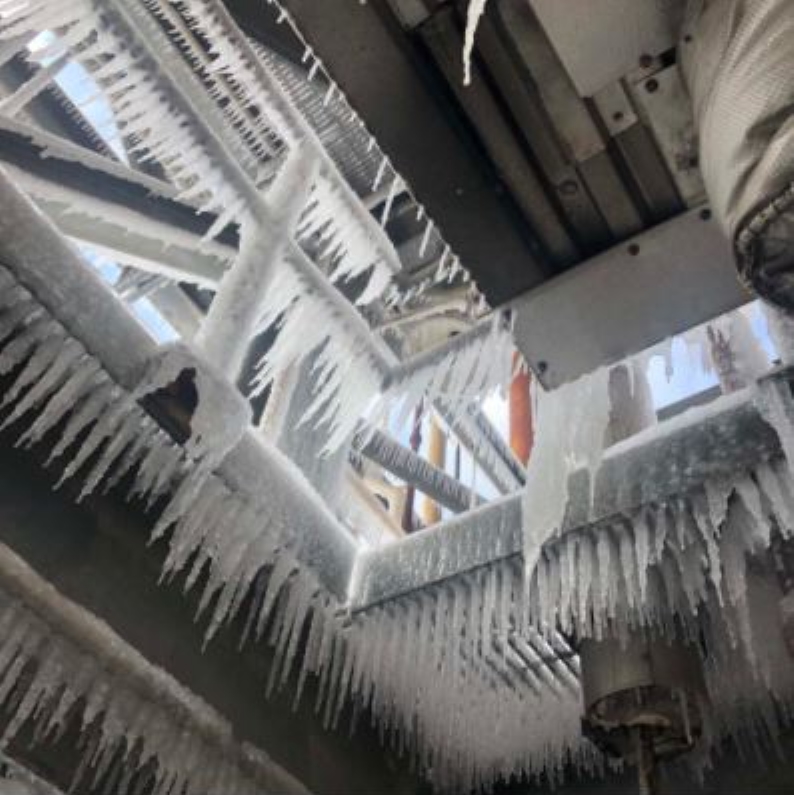
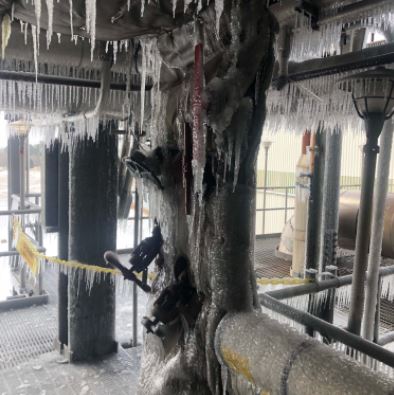
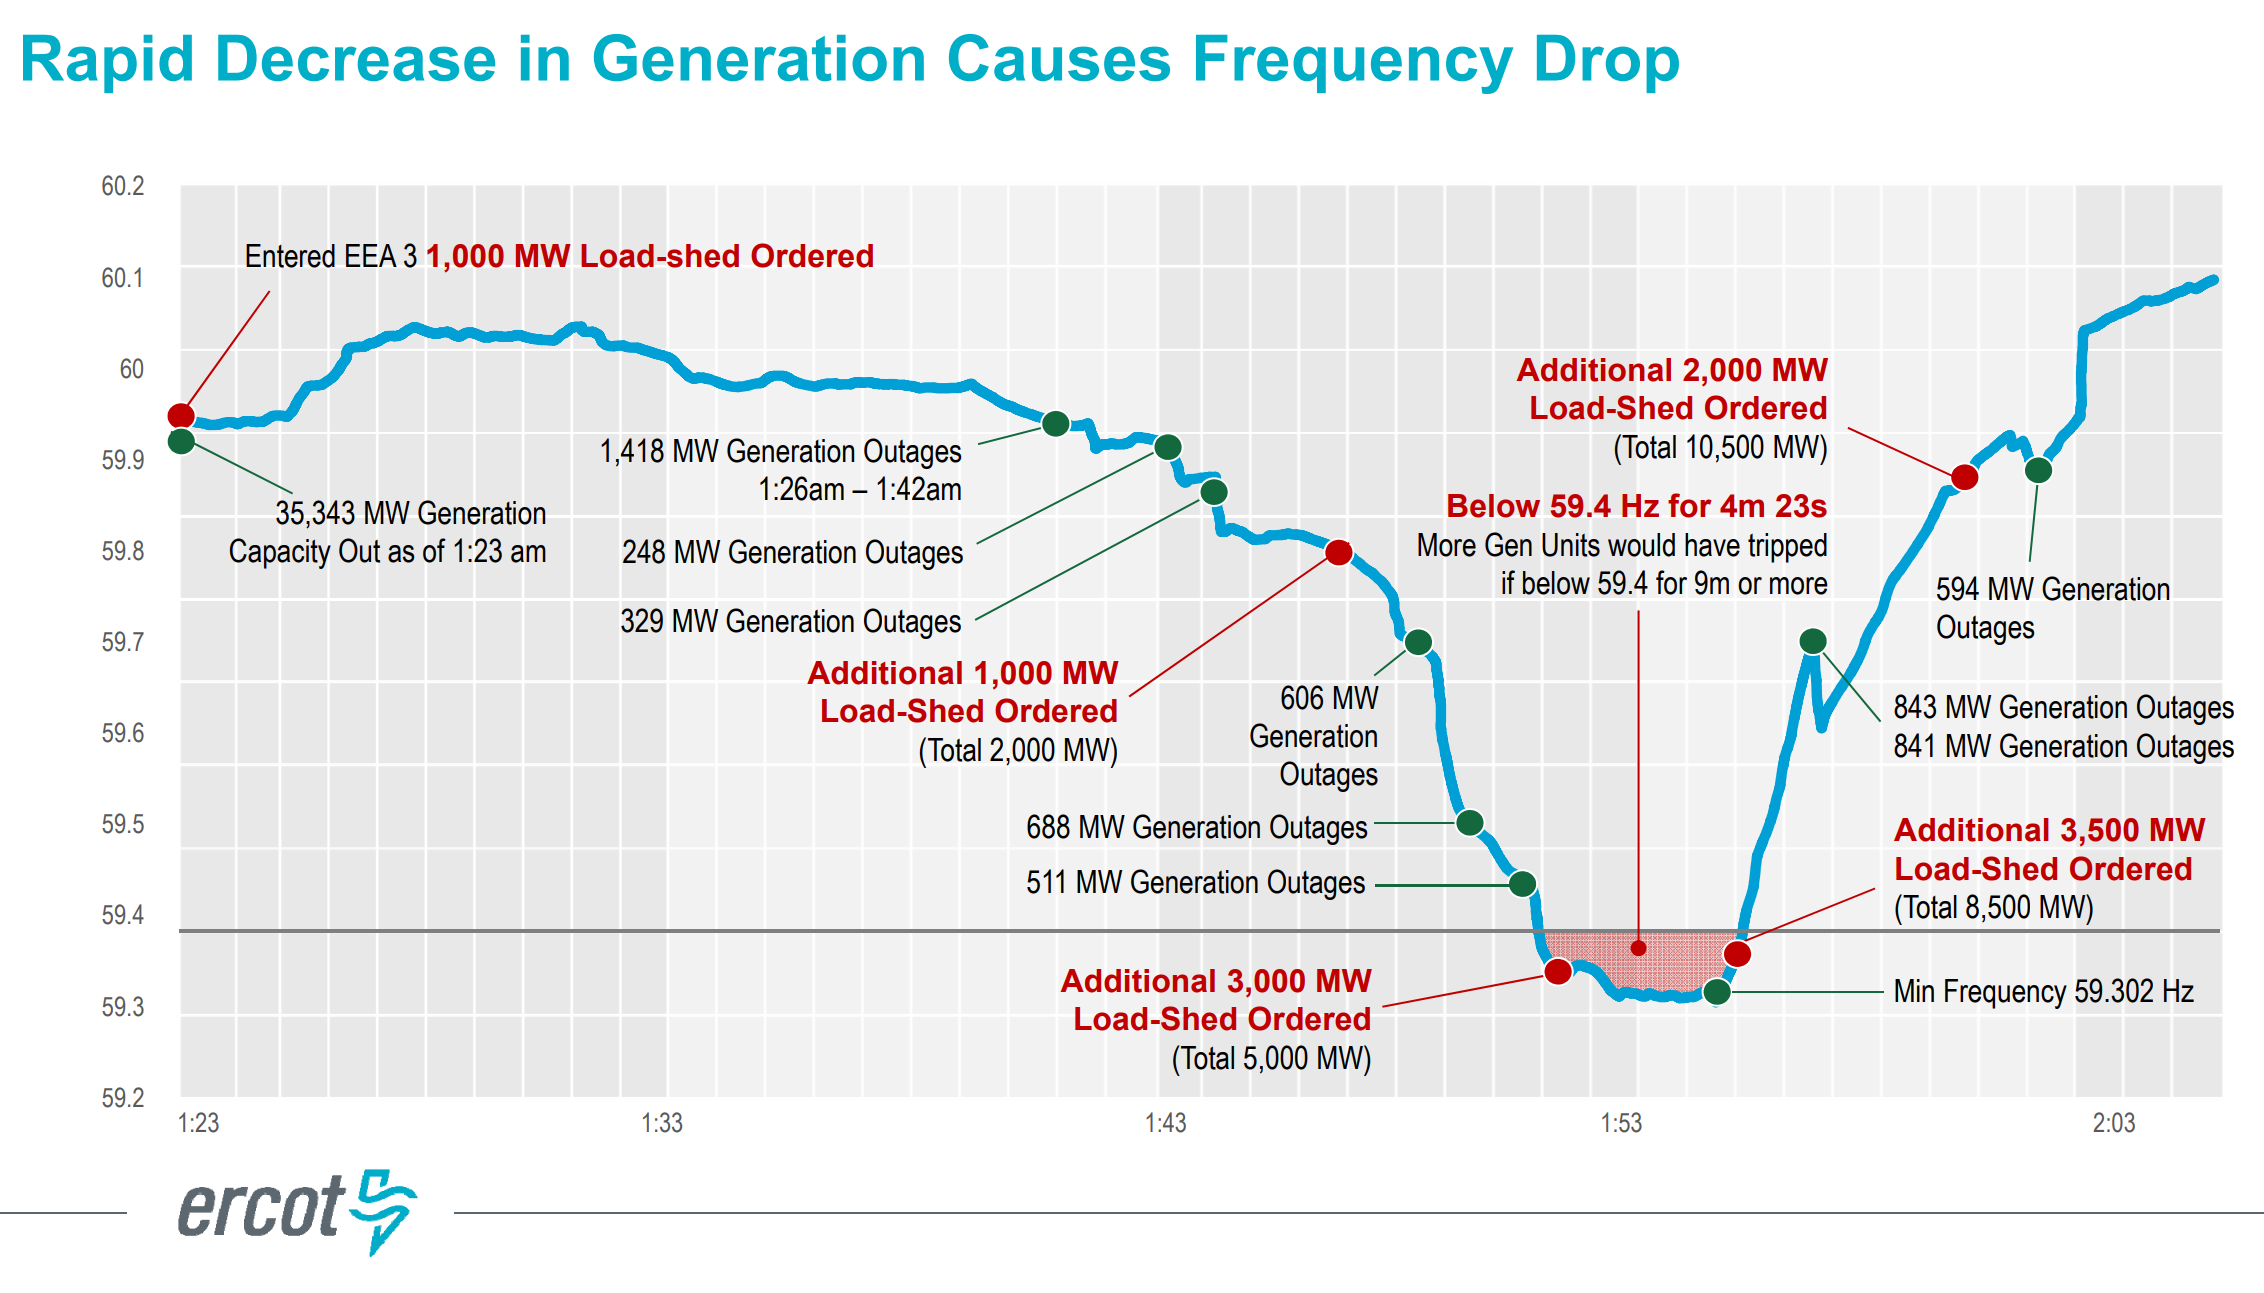
25 February 2021 (ERCOT) – [The following report is excerpted from the ERCOT slide presentation, Review of February 2021 Extreme Cold Weather Event (pdf), presented by ERCOT CEO Bill Magness to the Texas Senate Business and Commerce Committee House Joint Committee on State Affairs and Energy Resources on 25 February 2021. –Des] Overview of Cold […]
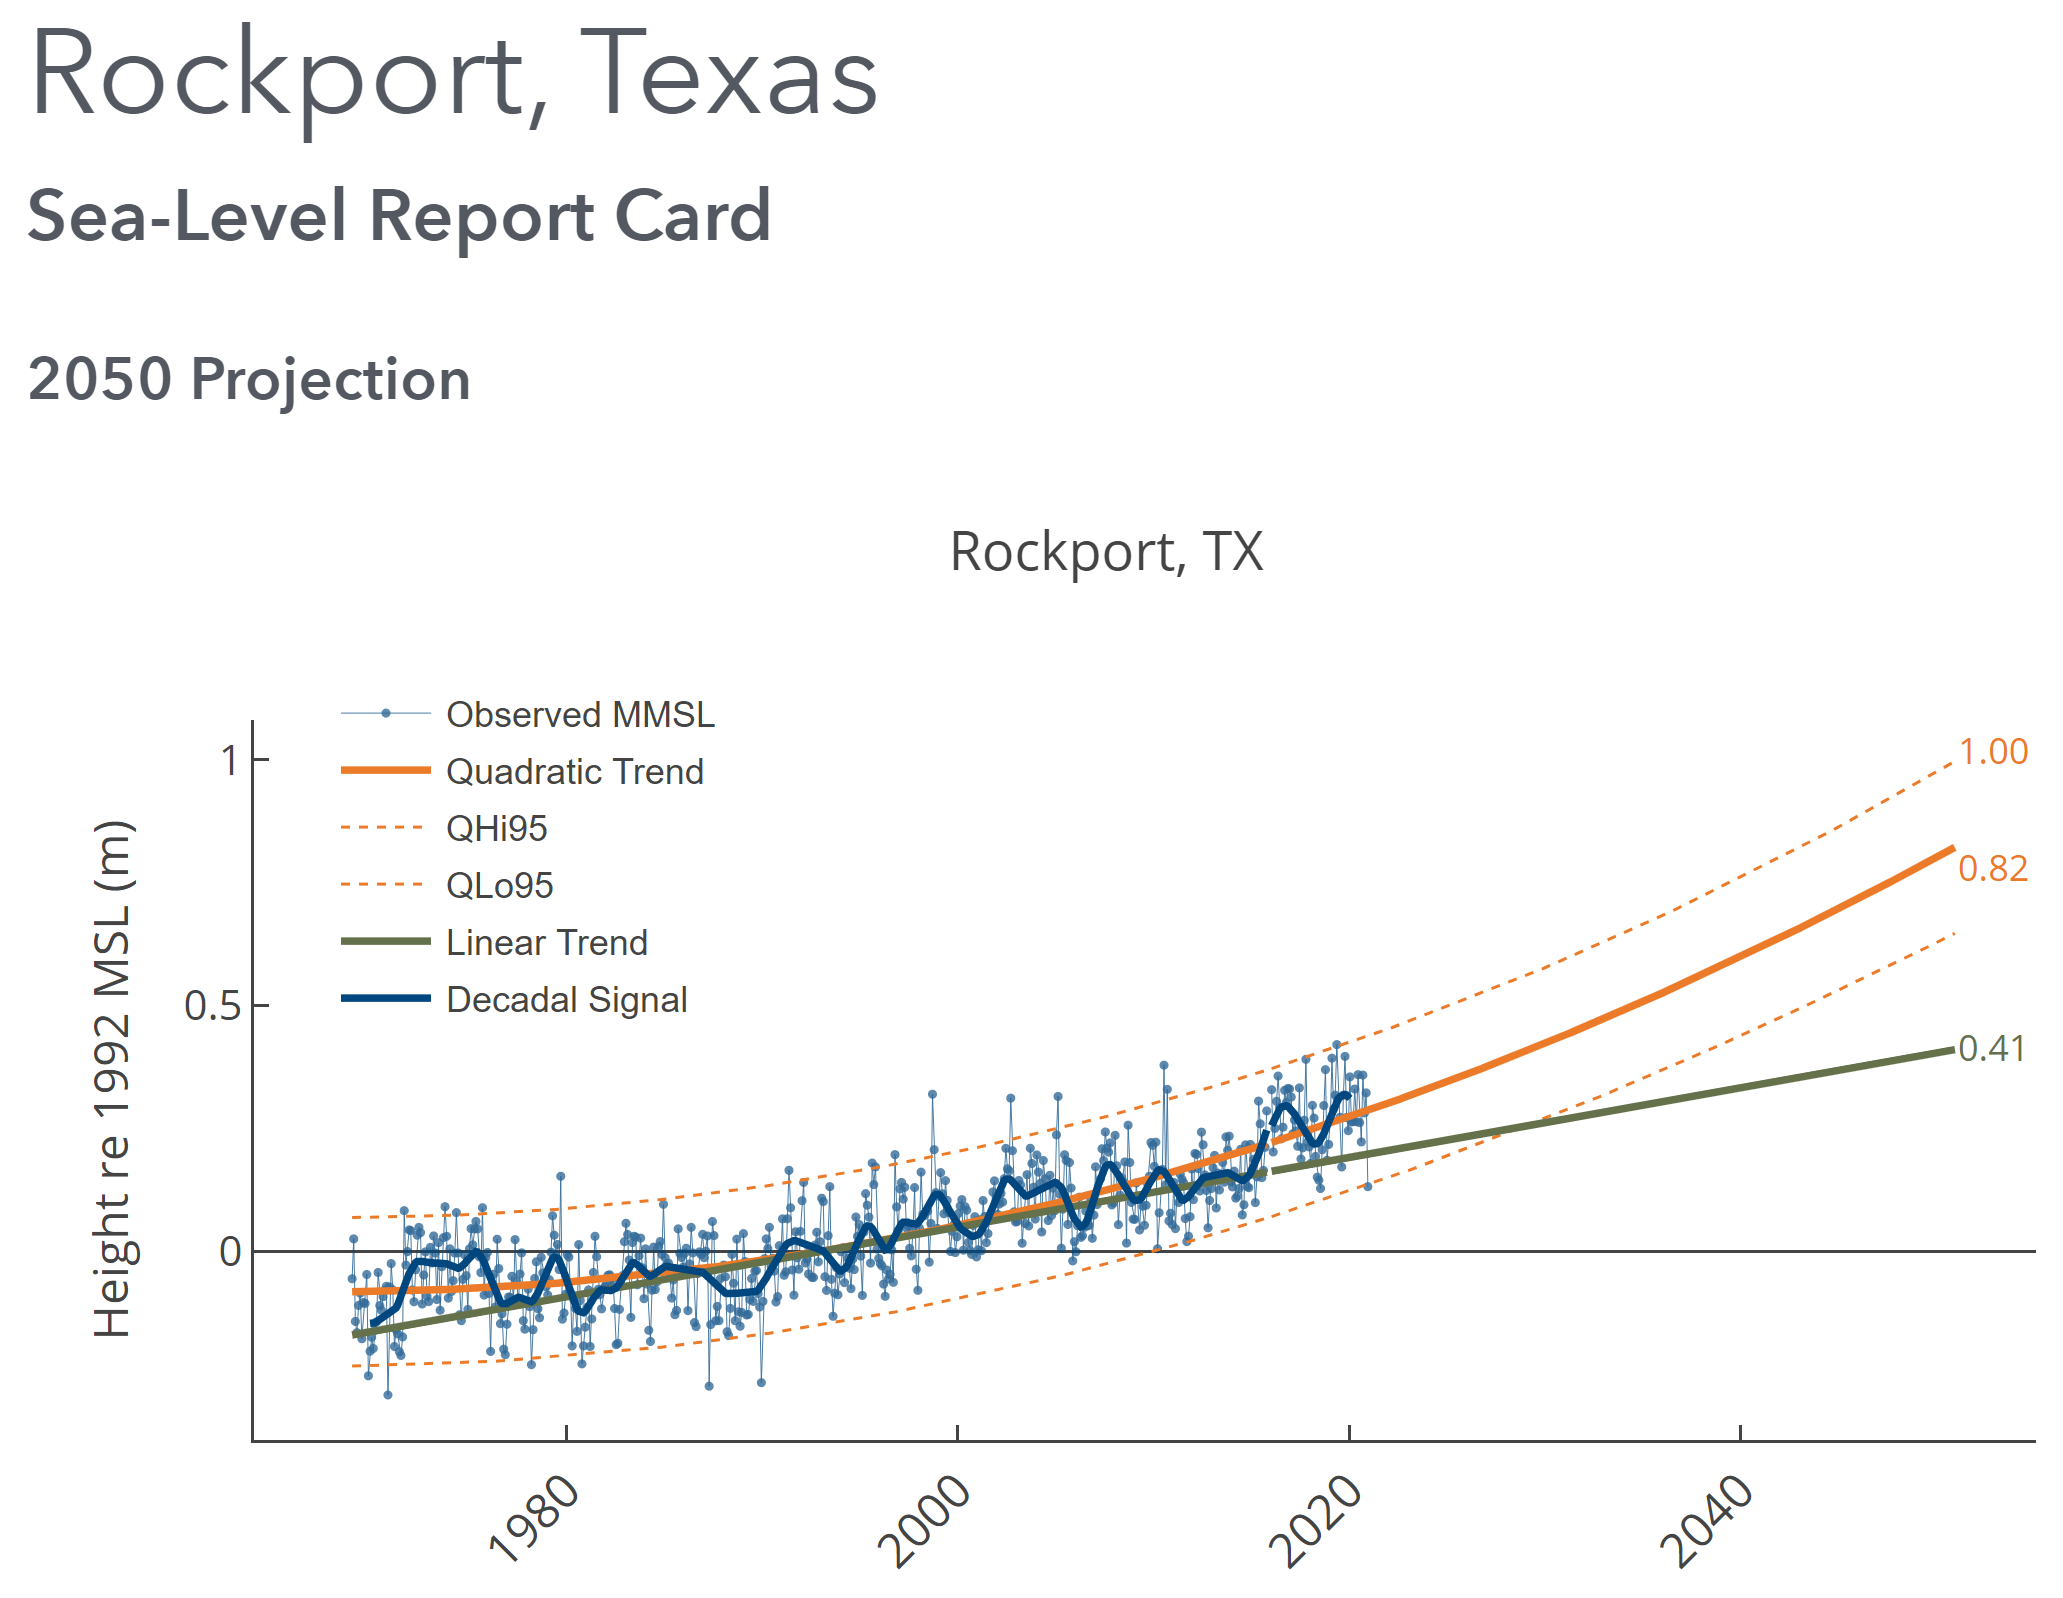
By David Malmquist 24 January 2021 (VIMS) – Sea level “report cards” issued annually by researchers at William & Mary’s Virginia Institute of Marine Science add further evidence of an accelerating rate of sea-level rise during 2020 at nearly all tidal stations along the U.S. coastline. The team’s web-based report cards project sea level to […]
By Suzanne Gamboa and Corky Siemaszko 25 February 2021 SAN ANTONIO (NBC News) – The number of Texans who were boiling their water to make it safe to drink plunged to 3 million Wednesday from 8 million the day before as platoons of plumbers and engineers worked around the clock to repair the countless homes […]
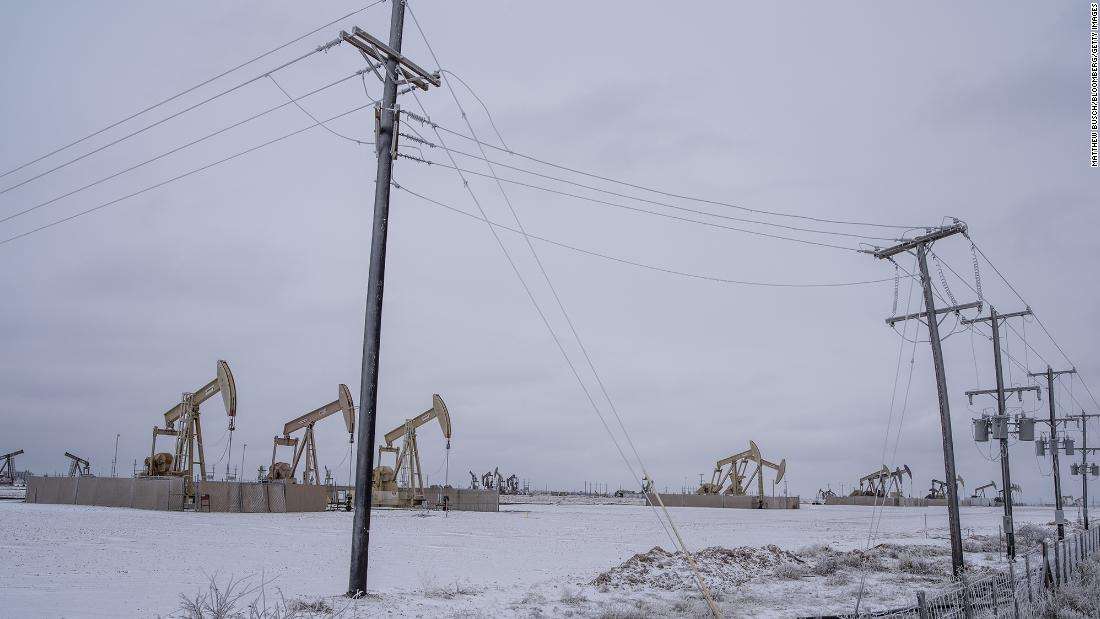
By Laura Sanicola and Erwin Seba 21 February 2021 NEW YORK/HOUSTON (Reuters) – The largest U.S. oil refiners released tons of air pollutants into the skies over Texas this past week, according to figures provided to the state, as refineries and petrochemical plants in the region scrambled to shut production during frigid weather. An arctic […]