By Julia Jacobo 28 May 2019 (ABC News) – The last male Sumatran rhinoceros in Malaysia has died, eliminating the likelihood of saving the species in the country, according to animal conservationists. Less than 100 Sumatran rhinos are left in the world, according to the Borneo Rhino Alliance (BORA). They are scattered across the wild in Indonesia […]
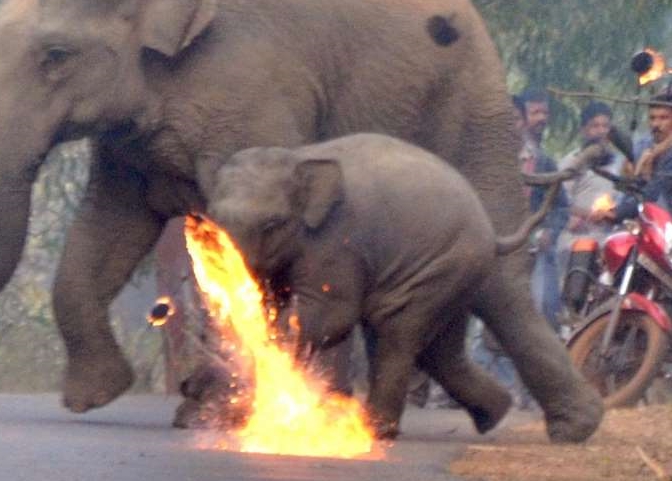
26 April 2019 (The Science News Reporter) – Due to the deforestation across India, numerous elephants can be seen wandering in the villages and communities. [Sadly, this is very common, cf. Photo of baby elephant on fire after being attacked by mob wins international award – “The calf screams in confusion and fear as the […]
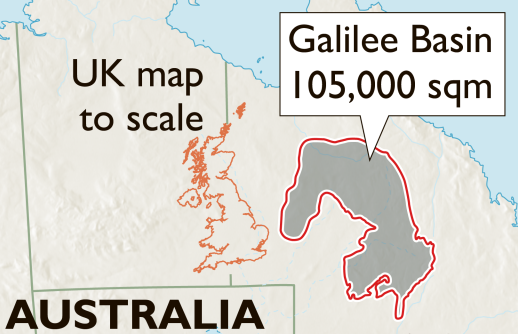
By Bernard Lagan 25 May 2019 SYDNEY (The Times) – Climate change was supposed to have won the Labor Party the Australian election. But yesterday, after having been routed by voters, its panicked leaders backed the mining of a coalfield bigger than the UK. Fearing a wipeout in state elections next year amid a rise in […]
29 April 2019 (PIK) – Record breaking heatwaves and droughts in North America and Western Europe, torrential rainfalls and floods in South-East Europe and Japan – the summer of 2018 brought a series of extreme weather events that occurred almost simultaneously around the Northern Hemisphere in June and July. These extremes had something in common, […]
By Natasha Gilbert 26 May 2019 (The Guardian) — Hundreds of rivers around the world from the Thames to the Tigris are awash with dangerously high levels of antibiotics, the largest global study on the subject has found. Antibiotic pollution is one of the key routes by which bacteria are able develop resistance to the […]
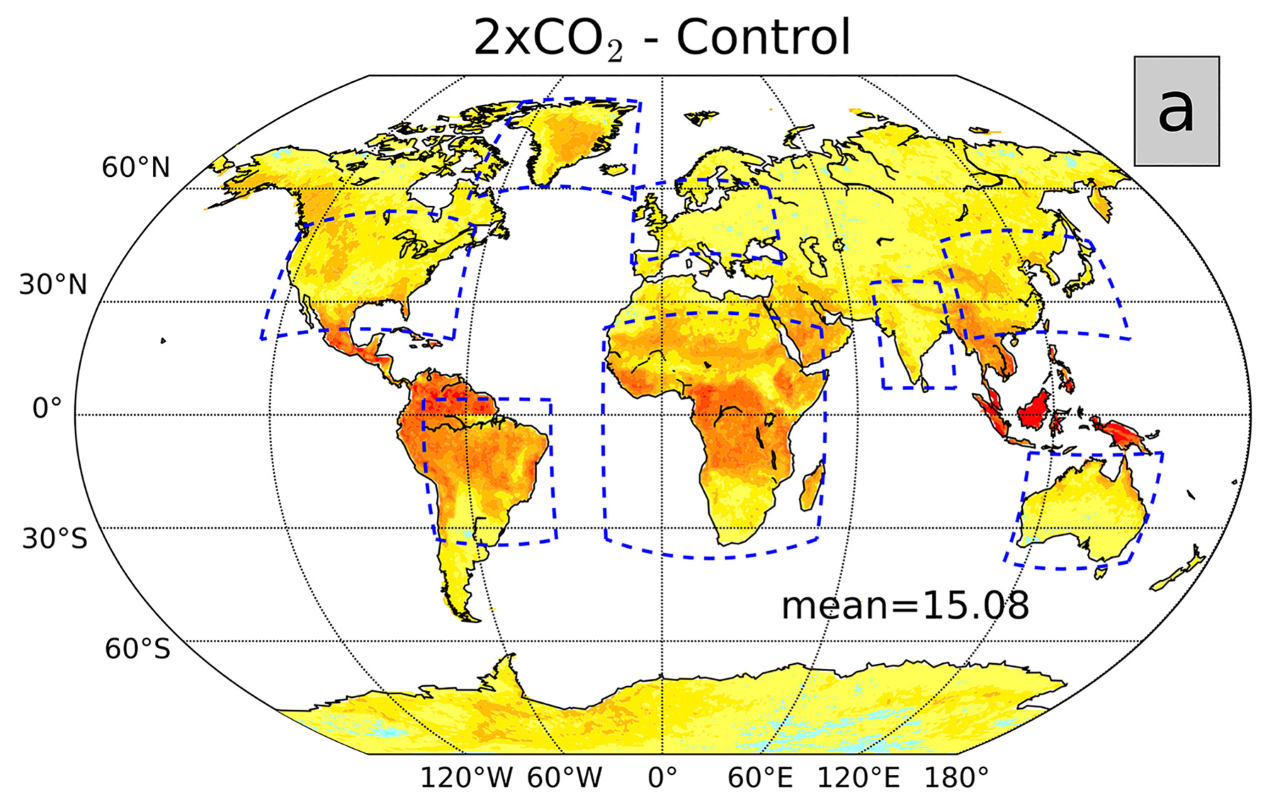
By Joseph Albanese 8 May 2019 (Princeton Environmental Institute) – As the planet continues to warm, multi-day heat waves are projected to increase in frequency, length and intensity. The additive effects of these extreme heat events overwhelm emergency service providers and hospital staff with heat-related maladies, disrupt the electrical grid and can even cause delays […]
By Nick Cunningham 12 May 2019 (OilPrice.com) – The world spent a staggering $4.7 trillion and $5.2 trillion on fossil fuel subsidies in 2015 and 2017, respectively, according to a new report [pdf] from the International Monetary Fund. That means that in 2017 the world spent a whopping 6.5 percent of global GDP just to subsidize the […]
By Josie Garthwaite 22 April 2019 (Stanford University) – A new Stanford University study shows global warming has increased economic inequality since the 1960s. Temperature changes caused by growing concentrations of greenhouse gases in Earth’s atmosphere have enriched cool countries like Norway and Sweden, while dragging down economic growth in warm countries such as India and Nigeria. […]
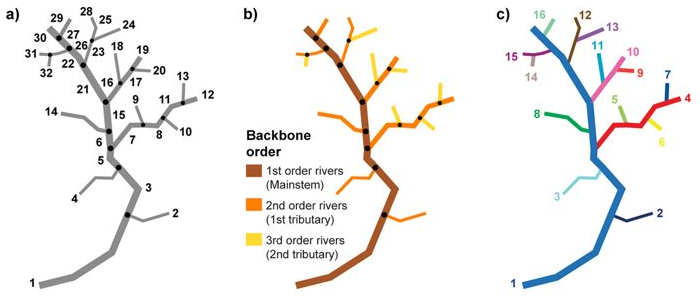
8 May 2019 (McGill University) – Just over one-third (37%) of the world’s 246 longest rivers remain free-flowing, according to a new study published in the scientific journal Nature. Dams and reservoirs are drastically reducing the diverse benefits that healthy rivers provide to people and nature across the globe. A team of 34 international researchers from McGill University, […]
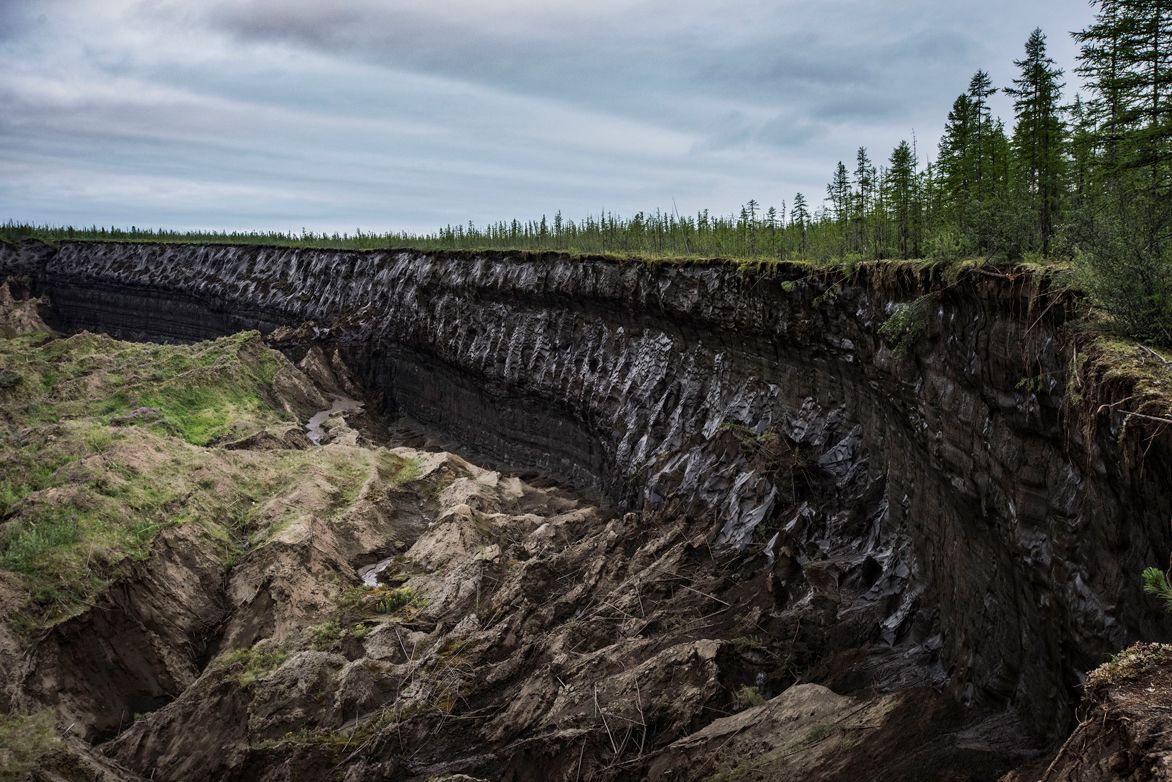
30 April 2019 (University of Guelph) – A “sleeping giant” hidden in permafrost soils in Canada and other northern regions worldwide will have important consequences for global warming, says a new report led by University of Guelph scientist Merritt Turetsky. Scientists have long studied how gradual permafrost thaw occurring over decades in centimetres of surface […]