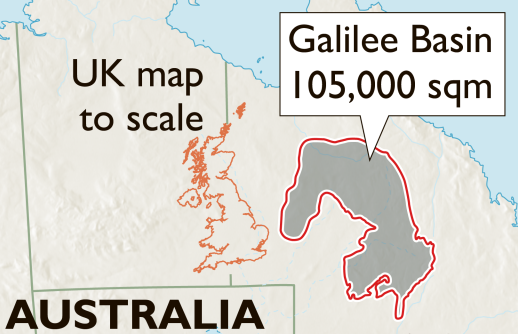
By Andrew Beatty 13 June 2019 (AFP) – Australia approved Thursday the construction of a controversial coal mine near the Great Barrier Reef, paving the way for a dramatic and unfashionable increase in coal exports. Queensland’s government said it had accepted a groundwater management plan for the Indian-owned Adani Carmichael mine—the last major legal hurdle […]
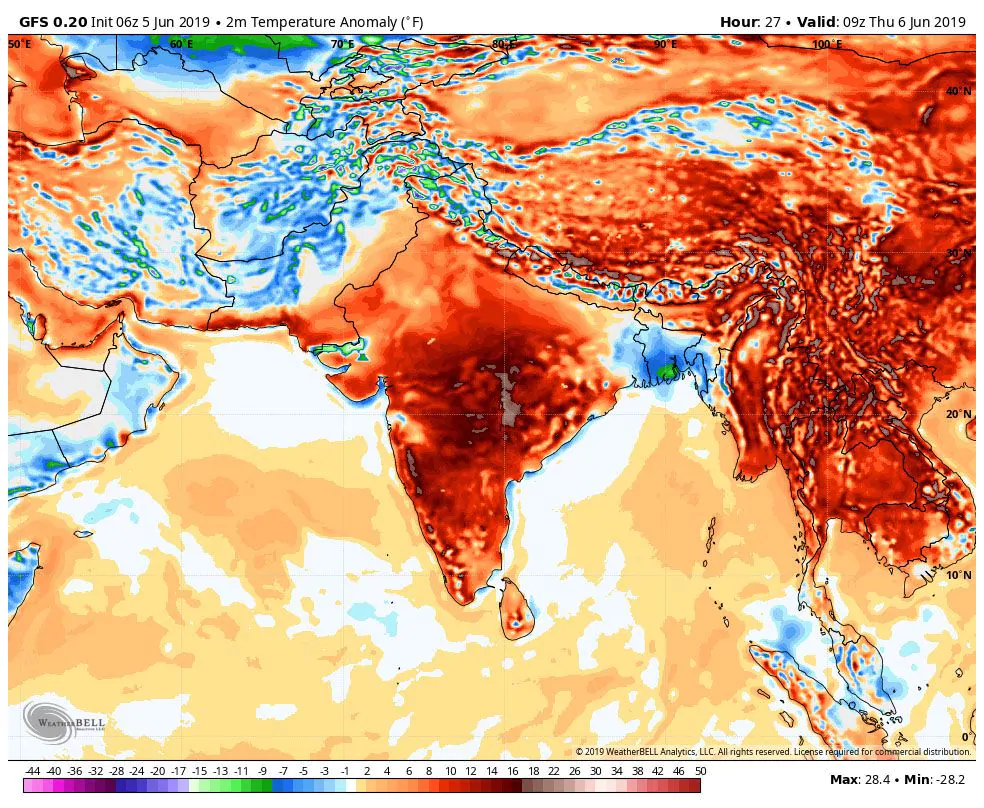
By Sam Relph 11 June 2019 DELHI (The Guardian) – Hundreds of Indian villages have been evacuated as a historic drought forces families to abandon their homes in search of water. The country has seen extremely high temperatures in recent weeks. On Monday the capital, Delhi, saw its highest ever June temperature of 48C. In Rajasthan, […]
By Amanda Gonzalez Bengtsson 11 June 2019 (Stockholm University) – For the first time ever, scientists at the Royal Botanic Gardens, Kew and Stockholm University, have compiled a global analysis of all plant extinction records documented from across the world. This unique dataset published today in leading journal, Nature Ecology & Evolution, brings together data […]
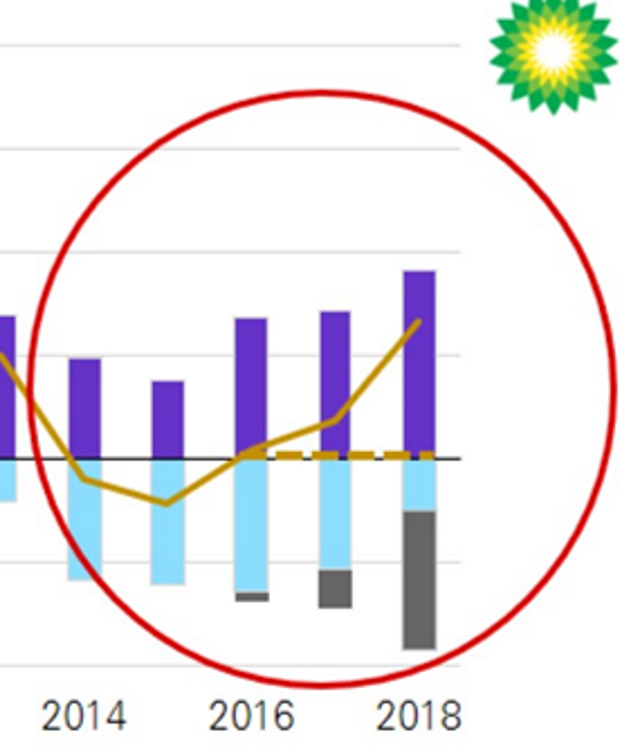
By Spencer Dale 11 June 2019 (BP) – The Statistical Review of World Energy has been providing timely and objective energy data for the past 68 years. In addition to the raw data, the Statistical Review also provides a record of key energy developments and events through time. My guess is that when our successors […]
By Dr. Jeff Masters 6 June 2019 (Weather Underground) – In early 2018, a three-year drought pushed Cape Town, South Africa, within weeks of experiencing “Day Zero”—the day when the city would run out of water and the taps be shut off. Fortunately, extreme water conservation efforts and the arrival of timely rains pushed “Day […]
5 June 2019 (AFP) – India’s tallest rubbish mountain in New Delhi is on course to rise higher than the Taj Mahal in the next year, becoming a fetid symbol for what the UN considers the world’s most polluted capital. Hawks and other birds of prey hover around the towering Ghazipur landfill on the eastern […]
5 June 2019 (AFP) – The noxious air hanging over India’s towns and cities kills more than 100,000 children under five every year, a damning study published Wednesday for World Environment Day found. India has repeatedly failed to address environmental concerns. Last year a UN report found 14 of the world’s 15 most polluted cities […]
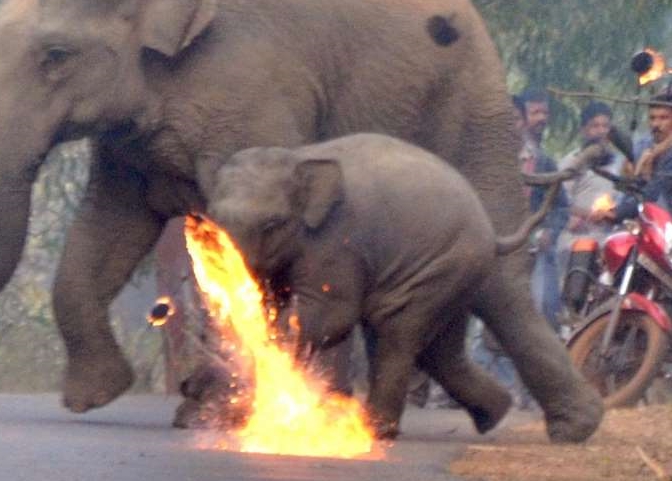
26 April 2019 (The Science News Reporter) – Due to the deforestation across India, numerous elephants can be seen wandering in the villages and communities. [Sadly, this is very common, cf. Photo of baby elephant on fire after being attacked by mob wins international award – “The calf screams in confusion and fear as the […]
By Bernard Lagan 25 May 2019 SYDNEY (The Times) – Climate change was supposed to have won the Labor Party the Australian election. But yesterday, after having been routed by voters, its panicked leaders backed the mining of a coalfield bigger than the UK. Fearing a wipeout in state elections next year amid a rise in […]
BOSTON, Massachusetts, 27 August 2018 (Harvard T.H. Chan School of Public Health) – Rising levels of carbon dioxide (CO2) from human activity are making staple crops such as rice and wheat less nutritious and could result in 175 million people becoming zinc deficient and 122 million people becoming protein deficient by 2050, according to new […]