BP Statistical Review of World Energy 2019: “A growing mismatch between hopes and reality”

By Spencer Dale
11 June 2019
(BP) – The Statistical Review of World Energy has been providing timely and objective energy data for the past 68 years. In addition to the raw data, the Statistical Review also provides a record of key energy developments and events through time.
My guess is that when our successors look back at Statistical Reviews from around this period, they will observe a world in which there was growing societal awareness and demands for urgent action on climate change, but where the actual energy data continued to move stubbornly in the wrong direction.
A growing mismatch between hopes and reality. In that context, I fear – or perhaps hope – that 2018 will represent the year in which this mismatch peaked.
Key features of 2018
The headline numbers are the rapid growth in energy demand and carbon emissions. Global primary energy grew by 2.9% in 2018 – the fastest growth seen since 2010. This occurred despite a backdrop of modest GDP growth and strengthening energy prices.
At the same time, carbon emissions from energy use grew by 2.0%, again the fastest expansion for many years, with emissions increasing by around 0.6 gigatonnes. That’s roughly equivalent to the carbon emissions associated with increasing the number of passenger cars on the planet by a third.
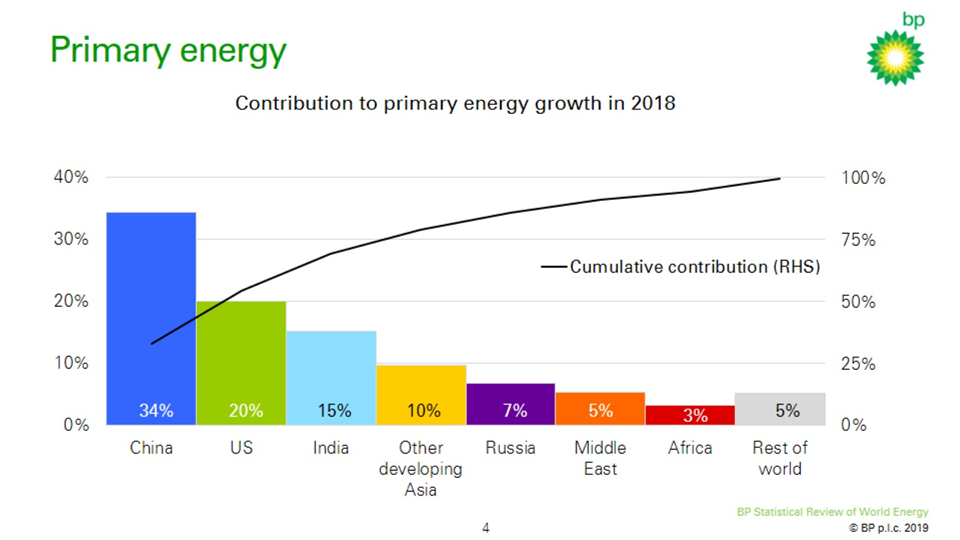
What drove these increases in 2018? And how worried should we be? Starting first with energy consumption. As I said, energy demand grew by 2.9% last year. This growth was largely driven by China, US and India which together accounted for around two thirds of the growth. Relative to recent historical averages, the most striking growth was in the US, where energy consumption increased by a whopping 3.5%, the fastest growth seen for 30 years and in sharp contrast to the trend decline seen over the previous 10 years.
The strength in energy consumption was pretty much reflected across all the fuels, most of which grew more strongly than their historical averages. This acceleration was particularly pronounced in natural gas demand, which increased 5.3%, one of its strongest growth rates for over 30 years, accounting for almost 45% of the entire growth in global energy consumption. Coal demand (1.4%) also increased for the second consecutive year, following three years of declines. Growth in renewable energy (14.5%) eased back slightly relative to past trends although remained by far the world’s fastest growing energy source.
To give a sense of the challenge posed by the strength of growth in power demand: if we focus solely on renewable energy, given the profile of demand growth, to maintain the level of carbon emissions from the power sector at its 2015 level, renewable generation would have needed to grow more than twice as quickly than it actually did: by over 1800 TWh over the past three years, rather than its actual growth of a little over 800 TWh. A staggering number: that additional renewable generation of around 1000 TWh is roughly equivalent to the entire renewable generation of China and the US combined in 2018.
Spencer Dale, BP group chief economist
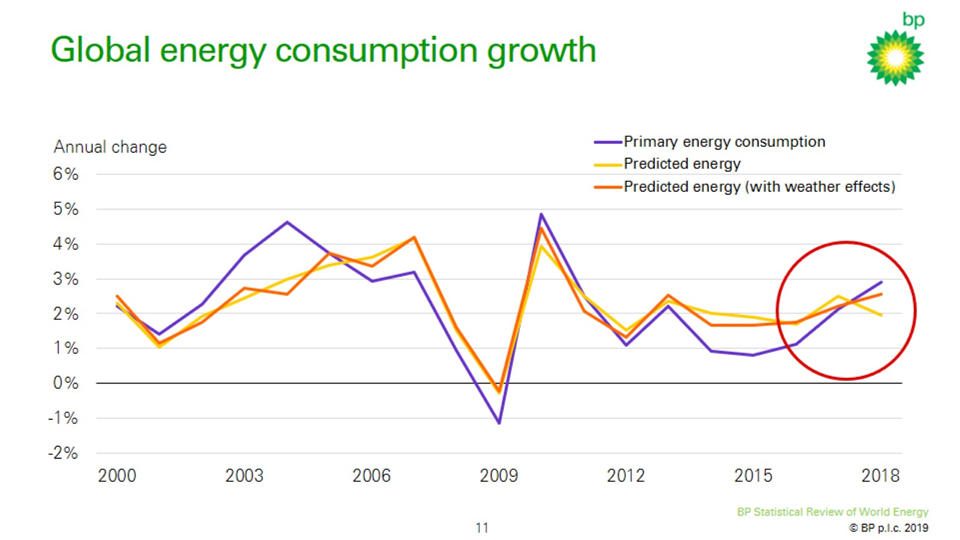
In terms of why the growth in energy demand was so strong: a simple model provides a way of gauging the extent of the surprise in this year’s energy data. The model uses GDP growth and oil prices (as a proxy for energy prices) to predict primary energy growth at a country level and then aggregates to global energy. Although very simple, the framework is able to explain much of the broad contours in energy demand over the past 20 years or so. This framework predicts that the growth in energy demand should have slowed a little last year, reflecting the slightly weaker economic backdrop and the strengthening in energy prices. Instead, energy demand picked up quite markedly.
Digging into the data further, it seems that much of the surprising strength in energy consumption in 2018 may be related to weather effects. In particular, there was an unusually large number of hot and cold days across many of the world’s major demand centres last year, particularly in the US, China and Russia, with the increased demand for cooling and heating services helping to explain the strong growth in energy consumption in each of these countries.
In the US, unusually, there was an increase in both heating and cooling days (as defined by the National Oceanic and Atmospheric Administration); in past years, high numbers of heating days have tended to coincide with low numbers of cooling days or vice versa. As a result, the increase in the combined number of US heating and cooling days last year was its highest since the 1950s, boosting US energy demand.
If we augment our framework to include a measure of heating and cooling days for those countries for which data are available, this greatly reduces the extent of the surprise in last year’s energy growth. Once these weather effects are included, the growth in energy demand in 2018 still looks a little stronger than expected, but more striking is the surprising weakness of demand growth in the period 2014-16, which is far lower than the framework predicts.
Energy demand and carbon emissions
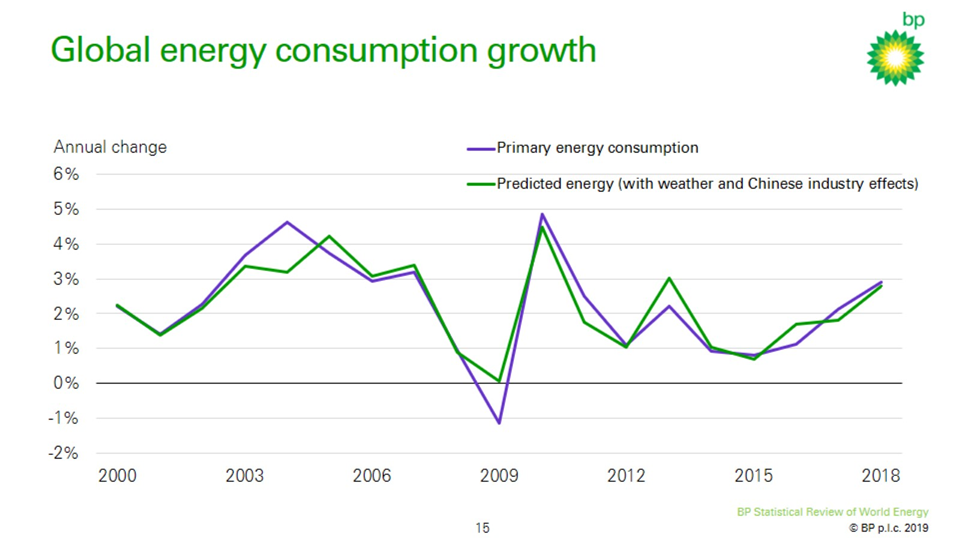
As discussed in previous Statistical Reviews, much of this weakness appears to stem from the pattern of Chinese economic growth during this period, in particular the pronounced weakness of some of China’s most energy-intensive sectors – iron, steel and cement – which account for around a quarter of China’s energy consumption and greatly dampened overall energy growth. At the time, I speculated that some of the slowing in these sectors reflected the structural rebalancing of the Chinese economy towards more consumer and service-facing sectors and so was likely to persist. But I also noted that the scale of the slowdown suggested that some of it was likely to be cyclical and would reverse over time. And indeed, that is what began to happen in iron and steel in 2017 and gathered pace last year. If we adjust the framework to also take account of movements in these key Chinese industrial sectors, the over-prediction of energy growth in 2014-16 is greatly reduced, as is the remaining ‘unexplained’ strength of energy demand in 2018. So, in answer to the question of why energy demand was so strong in 2018: it appears that the strength was largely due to weather-related effects – especially in the US, China and Russia – together with a further unwinding of cyclical factors in China.
How does this growth in energy demand relate to the worrying acceleration in carbon emissions?
Electrification without decarbonizing power is of little use.
Spencer Dale, BP group chief economist
To a very large extent, the growth in carbon emissions is simply a direct consequence of the increase in energy growth. Relative to the average of the previous five years, growth in energy demand was 1.5 percentage points higher in 2018 and the growth in carbon emissions was 1.4 percentage points higher. One led to the other as the improvement in the carbon intensity of the fuel mix was similar to its recent average.
Finally, in terms of the headline data, what signal might the 2018 data contain for the future?
I think this depends in large part on how you interpret the increasing number of heating and cooling days last year. If this was just random variation, we might expect weather effects in the future to revert to more normal levels, allowing the growth in energy demand and carbon emissions to fall back. On the other hand, if there is a link between the growing levels of carbon in the atmosphere and the types of weather patterns observed in 2018 this would raise the possibility of a worrying vicious cycle: increasing levels of carbon leading to more extreme weather patterns, which in turn trigger stronger growth in energy (and carbon emissions) as households and businesses seek to offset their effects.
There are many people better qualified than I to make judgements on this. But even if these weather effects are short lived, such that the growth in energy demand and carbon emissions slow over the next few years, the recent trends still feel very distant from the types of transition paths consistent with meeting the Paris climate goals.
Hopes and reality.
So, in that sense, there are grounds for us to be worried.
Oil
2018 was another rollercoaster year for oil markets, with prices starting the year on a steady upward trend, reaching the dizzying heights of $85/bbl in October, before plunging in the final quarter to end the year at close to $50/bbl.
Oil demand provided a relatively stable backdrop, continuing to grow robustly, increasing 1.4 Mb/d last year. In an absolute sense, the growth in demand was dominated by the developing world, with China (0.7 Mb/d]) and India (0.3 Mb/d) accounting for almost two thirds of the global increase. But relative to the past 10 years or so, the big outlier was the US, where oil demand grew by 0.5 Mb/d in 2018, its largest increase for well over 10 years, boosted by increased demand for ethane as new production capacity came on stream.
The increased importance of petrochemicals in driving oil demand growth was also evident in the global product breakdown, with products most closely related to petrochemicals (ethane, LPG and naphtha) accounting for around half of the overall growth in demand last year.
Against this backdrop of steady demand growth, all the excitement came from the supply side, where global production grew by a whopping 2.2 Mb/d, more than double its historical average. The vast majority of this growth was driven by US production, which grew by 2.2 Mb/d – the largest ever annual increase by a single country. Since 2012 and the onset of the tight oil revolution, US production (including NGLs) has increased by over 7 Mb/d – broadly equivalent to Saudi Arabia’s crude oil exports – an astonishing increase which has transformed both the structure of the US economy and global oil market dynamics. Largely as a consequence, US net oil imports shrunk to less than 3 Mb/d last year, compared with over 12 Mb/d in 2005.
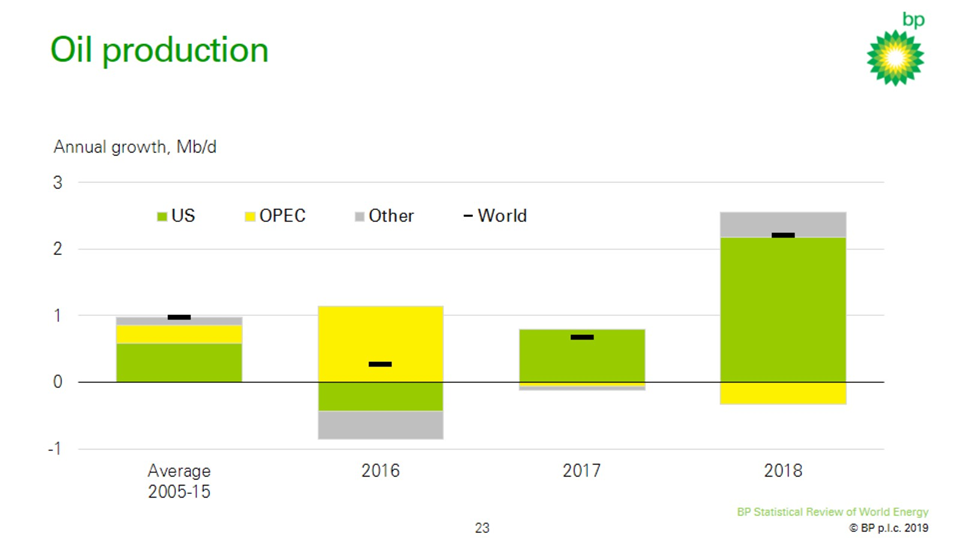
OPEC production fell by 0.3 Mb/d in 2018, with a marked increase in Saudi Arabian production (0.4 Mb/d) offset by falls in Venezuela (-0.6 Mb/d) and Iran (-0.3 Mb/d). But this year-on-year comparison doesn’t do justice to the intra-year twists and turns in OPEC production.
The ride began in the first half of 2018 with the continuation of the OPEC+ agreement from December 2016. The OPEC+ group consistently overshot their agreed production cuts during 2017 and this overshooting increased further during the first half of 2018, largely reflecting continuing falls in Venezuelan output. These production cuts helped push OECD inventories below their five year moving average for the first time since the collapse in oil prices in 2014.
The first major twist came in the middle of 2018: in response to falling Venezuelan production and the US announcing in May its intention to impose sanctions on all Iranian oil exports, the OPEC+ group in June committed to achieving 100% compliance of their production cuts for the group as a whole.
This commitment contained two important signals. First, given the extent to which production was below the target level, it signalled the prospect of an immediate increase in production. Second, it helped reduce the uncertainty associated with the possibility of future disruptions to either Iranian and Venezuelan production since the commitment to maintain “100% compliance” in essence signalled the willingness of other members of the OPEC+ group to offset any lost production.
As a result, between May and November of last year, net production by the OPEC+ group increased by 900 Kb/d, despite Iranian and Venezuelan production falling by a further 1 Mb/d. Job done. Or was it?
The problem with trying to stabilize oil markets is that there is always some other pesky development that you hadn’t expected. Oil production by Libya and Nigeria – neither of which were part of the OPEC+ agreement – increased by more than 500 Kb/d between June and November of last year. As a result, OECD inventories started to grow again. The growing sense of excess supply was compounded by the US announcing in November that it would grant temporary waivers for some imports of Iranian oil.
This triggered another twist: a new OPEC+ group was formed in December of last year – this time excluding Iran and Venezuela, as well as Libya, but including Nigeria – with a commitment to reduce production by 1.2 Mb/d relative to October 2018 levels. After a slow start, by the spring of this year, inventories have fallen back to around their five year average once again.
It’s tempting to interpret these twists and turns as indicative of OPEC’s waning powers. But I’m not sure that’s the correct interpretation. The role that OPEC+ played in more than offsetting the falls in Iranian and Venezuelan output last year was very significant. For me, the twists and turns simply reflect the difficulty of market management, especially in a world of record supply growth in one part of the world and heightened geopolitical tensions in others. It feels like the rollercoaster will run for some time to come.
Natural gas
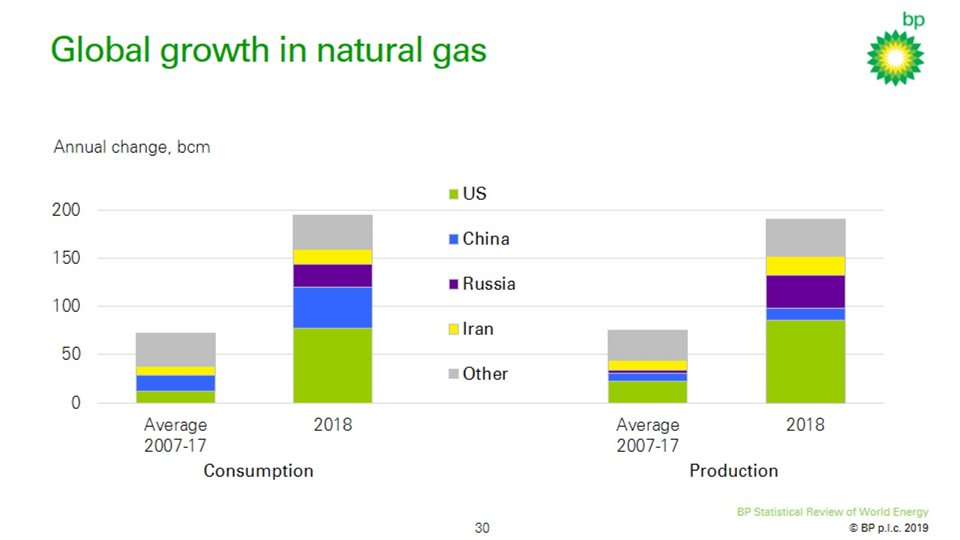
2018 was a bonanza year for natural gas, with both global consumption and production increasing by over 5%, one of the strongest growth rates in either gas demand or output for over 30 years. The main actor here was the US, accounting for almost 40% of global demand growth and over 45% of the increase in production.
US gas production increased by 86 bcm, an increase of almost 12%, driven by shale gas plays in Marcellus, Haynesville and Permian. Indeed, the US achieved a unique double first last year, recording the single largest-ever annual increases by any country in both oil and gas production – in case there was any doubt: the US shale revolution is alive and kicking. The gains in global gas production were supported by Russia (34 bcm), Iran (19 bcm) and Australia (17 bcm).
Although some of the increase in US gas supplies was used to feed the three new US LNG trains which came on stream last year, the majority was used to quench the thirst of domestic demand. US gas consumption increased by 78 bcm last year – roughly the same growth as the country achieved over the previous six years. This exceptional strength appears to be largely driven by the same weather-related effects, with rising demand for space heating and cooling fuelling increased gas consumption, both directly, and, more importantly, indirectly via growing power demand. The expansion of gas consumption within the US power sector was further boosted by almost 15 gigawatts of coal-fired generation capacity being retired last year.
Outside of the US, the growth in global gas demand was relatively concentrated across three other countries: China (43 bcm), Russia (23 bcm) and Iran (16 bcm), which together with the US, accounted for 80% of global growth.
China gas consumption grew by an astonishing 18% last year. This strength stemmed largely from a continuation of environmental policies encouraging coal-to-gas switching in industry and buildings in order to improve local air quality, together with robust growth in industrial activity during the first half of the year.
Global LNG supplies continued their rapid expansion last year, increasing by almost 10% (37 bcm) as a number of new liquefaction plants in Australia, US and Russia were either started or ramped up. For much of the year, the strength of Asian gas demand, led by China, was sufficient to absorb these increasing supplies. But a waning in the strength of Asian demand towards the end of the year, combined with a mini-surge in LNG exports, caused prices to fall back and the differential between Asian and European spot prices to narrow significantly.
Asian prices have fallen further in the first part of this year, towards the bottom of the price band defined by US exporters’ full-cycle and operating costs. The prospect of further rapid increases in LNG supplies this year means there is a possibility of a first meaningful curtailment of some LNG supply capacity. The extent of any eventual shut-in will depend importantly on the European market, which acts as the de facto ‘market of last resort’ for LNG supplies.
Europe’s gas demand contracted by a little over 2% (11 bcm) last year, but this fall in demand was more than matched (-13 bcm) by continuing declines in Europe’s ageing gas fields. The small increase in European gas imports was largely met by LNG cargos diverted from Asia towards the end of the year as the Asian premium over European prices almost disappeared.
Russian pipeline exports to Europe were largely unchanged on the year, maintaining the record levels built up in recent years, although with a slight decline in their share of Europe’s gas imports. A key factor determining the role that Europe will play in balancing the global LNG market over coming years will be the extent to which Russia seeks to maintain its market share.
Coal
2018 saw a further bounce back in coal – building on the slight pickup seen in the previous year – with both consumption (1.4%) and production (4.3%) increasing at their fastest rates for five years. This strength was concentrated in Asia, with India and China together accounting for the vast majority of the gains in both consumption and production.
The growth in coal demand was the second consecutive year of increases, following three years of falling consumption. As a result, the peak in global coal consumption which many had thought had occurred in 2013 now looks less certain: another couple of years of increases close to that seen last year would take global consumption comfortably above 2013 levels.
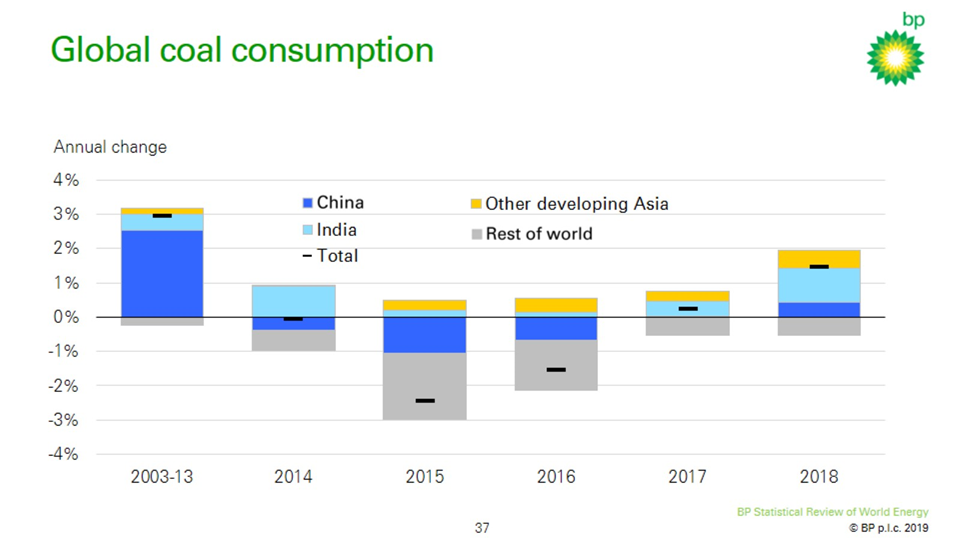
The growth in coal consumption was more than accounted for by increasing use in the power sector. This is despite continuing strong growth in renewables: renewable energy increased by over 25% in both India and China last year, which together accounted for around half of the global growth in renewable energy. But even this was not sufficient to keep pace with the strong gains in power demand, with coal being sucked into the power sector as the balancing fuel.
This highlights an obvious but important point: even if renewables are growing at truly exceptional rates, the pace of growth of power demand, particularly in developing Asia, limits the pace at which the power sector can decarbonize.
Power sector and renewable energy
The power sector needs to play a central role in any transition to a low carbon energy system: it is the single largest source of carbon emissions within the energy system; and it is where much of the lowest-hanging fruit lie for reducing carbon emissions over the next 20 years. So, what happened last year?
Global power demand grew by 3.7%, which is one of the strongest growth rates seen for 20 years, absorbing around half of the growth in primary energy. The developing world continued to drive the vast majority (81%) of this growth, led by China and India who together accounted for around two thirds of the increase in power demand. But the particularly strong growth of power demand in 2018 owed much to the US, where power demand grew by a bumper 3.7%, boosted by those weather effects.
On the supply side, the growth in power generation was led by renewable energy, which grew by 14.5%, contributing around a third of the growth; followed by coal (3.0%) and natural gas (3.9%). China continued to lead the way in renewables growth, accounting for 45% of the global growth in renewable power generation, more than the entire OECD combined.
Renewable energy appears to be coming of age, but to repeat a point I made last year, despite the increasing penetration of renewable power, the fuel mix in the global power system remains depressingly flat, with the shares of both non-fossil fuels (36%) and coal (38%) in 2018 unchanged from their levels 20 years ago.
The general point here is that the robust growth in power demand, particularly in the developing world, greatly adds to the difficulty of decarbonizing the power sector. You have to run very fast just to stand still.
Spencer Dale, BP group chief economist
This persistence in the fuel mix highlights a point that the International Energy Agency (IEA) and others have stressed recently; namely that a shift towards greater electrification helps as a pathway to a lower carbon energy system only if it goes hand-in-hand with a decarbonization of the power sector. Electrification without decarbonizing power is of little use.
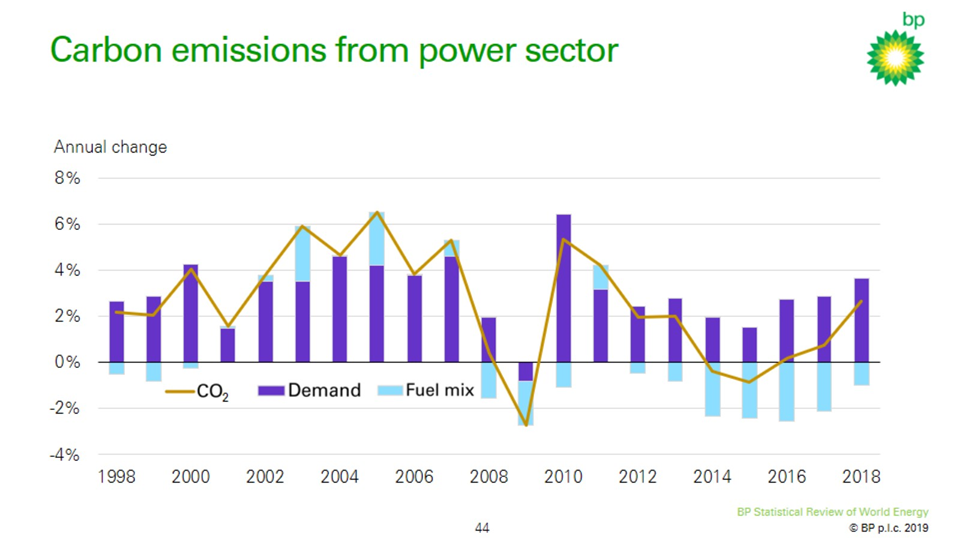
In that vein, carbon emissions from the power sector are estimated to have increased by 2.7% in 2018, their highest rate of growth for seven years, accounting for around half of the growth in global carbon emissions. For much of the past 20 years, changes in the carbon intensity of the power sector have been relatively small (or even perverse), such that increases in power demand fed through directly into higher carbon emissions. Electrification without decarbonization.
Over the past five years or so, the rapid growth in renewable energy, together with an edging down in the coal share, has led to a more sustained improvement in the carbon intensity of the power sector, such that the impact of increasing power demand on carbon emissions has been partially offset. But it’s still only partial: despite the rapid gains in renewable energy, the pace of growth in power demand has meant that overall carbon emissions from the power sector have increased substantially over the past three years. It hasn’t been possible to decarbonize the power sector quickly enough to offset the growth in demand.
To give a sense of the challenge posed by the strength of growth in power demand: if we focus solely on renewable energy, given the profile of demand growth, to maintain the level of carbon emissions from the power sector at its 2015 level, renewable generation would have needed to grow more than twice as quickly than it actually did: by over 1800 TWh over the past three years, rather than its actual growth of a little over 800 TWh.
A staggering number: that additional renewable generation of around 1000 TWh is roughly equivalent to the entire renewable generation of China and the US combined in 2018.
Alternatively, the same outcome for carbon emissions could have been achieved by replacing around 10% of coal in the power sector with natural gas. The intuition is that renewables are still a relatively small share of power generation relative to coal, and so the proportional movements in coal are a lot smaller.
As I mentioned, the general point here is that the robust growth in power demand, particularly in the developing world, greatly adds to the difficulty of decarbonizing the power sector. You have to run very fast just to stand still.
This highlights the importance of adopting a range of technologies and fuels; rather than just relying on renewables.
Rapid growth in renewable energy is essential but it’s unlikely to be sufficient. To win the race to Paris, the world is likely to require many fuels and technologies for many years to come.
Conclusion
At a time when society is increasing its demands for an accelerated transition to a low carbon energy system, the energy data for 2018 paint a worrying picture, with both energy demand and carbon emissions growing at the fastest rates seen for years.
As I explained, in a statistical sense, it’s possible to explain this acceleration in terms of a combination of weather-related effects and an unwinding of cyclical movements in China’s pattern of growth. What is less clear is how much comfort we can take from this explanation.
What does seem fairly clear is that the underlying picture is one in which the actual pace of progress is falling well short of the accelerated transition envisaged by the Paris climate goals.
Last year’s developments sound yet another warning alarm that the world is on an unsustainable path.