Airborne nitrogen dioxide plummets over China as quarantine shuts down industry

By Kasha Patel
28 February 2020
(NASA) – NASA and European Space Agency (ESA) pollution monitoring satellites have detected significant decreases in nitrogen dioxide (NO2) over China. There is evidence that the change is at least partly related to the economic slowdown following the outbreak of coronavirus.
At the end of 2019, medical professionals in Wuhan, China, were treating dozens of pneumonia cases that had an unknown source. Days later, researchers confirmed the illnesses were caused by a new coronavirus (COVID-19). By 23 January 2020, Chinese authorities had shut down transportation going into and out of Wuhan, as well as local businesses, in order to reduce the spread of the disease. It was the first of several quarantines set up in the country and around the world.
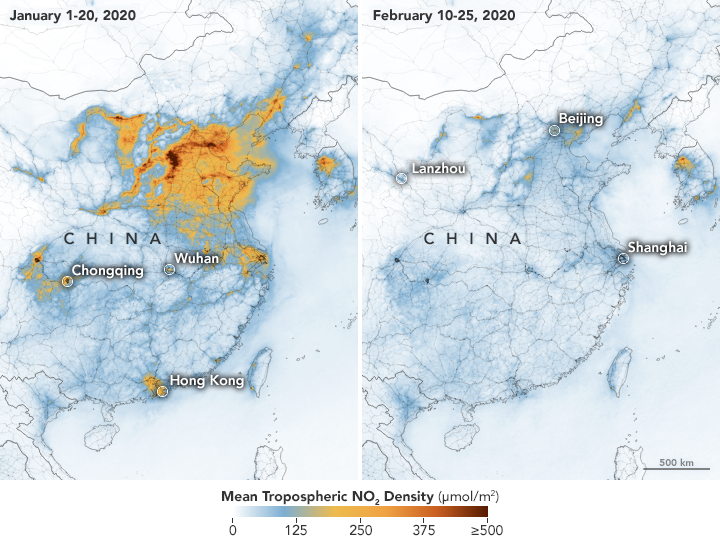
The maps on this page show concentrations of nitrogen dioxide, a noxious gas emitted by motor vehicles, power plants, and industrial facilities. The maps above show NO2 values across China from 1-20 January 2020 (before the quarantine) and 10-25 February 2020 (during the quarantine). The data were collected by the Tropospheric Monitoring Instrument (TROPOMI) on ESA’s Sentinel-5 satellite. A related sensor, the Ozone Monitoring Instrument (OMI) on NASA’s Aura satellite, has been making similar measurements.
According to NASA scientists, the reduction in NO2 pollution was first apparent near Wuhan, but eventually spread across the country. Millions of people have been quarantined in one of the largest such actions in human history. As of February 28, 2020, the virus had been detected in at least 56 countries.
“This is the first time I have seen such a dramatic drop-off over such a wide area for a specific event,” said Fei Liu, an air quality researcher at NASA’s Goddard Space Flight Center. Liu recalls seeing a drop in NO2 over several countries during the economic recession that began in 2008, but the decrease was gradual. Scientists also observed a significant reduction around Beijing during the 2008 Olympics, but the effect was mostly localized around that city, and pollution levels rose again once the Olympics ended.

The drop in nitrogen dioxide in 2020 also coincided with Lunar New Year celebrations in China and much of Asia. Generally, businesses and factories close from the last week in January into early February to celebrate the festival. Past observations have shown that air pollution usually decreases during this period and then increases once the celebration is over.
“There is always this general slowdown around this time of the year,” said Barry Lefer, an air quality scientist at NASA. “Our long-term OMI data allows us to see if these amounts are abnormal and why.” Launched in 2004, OMI has been collecting global data on NO2 and various air pollutants for more than 15 years.
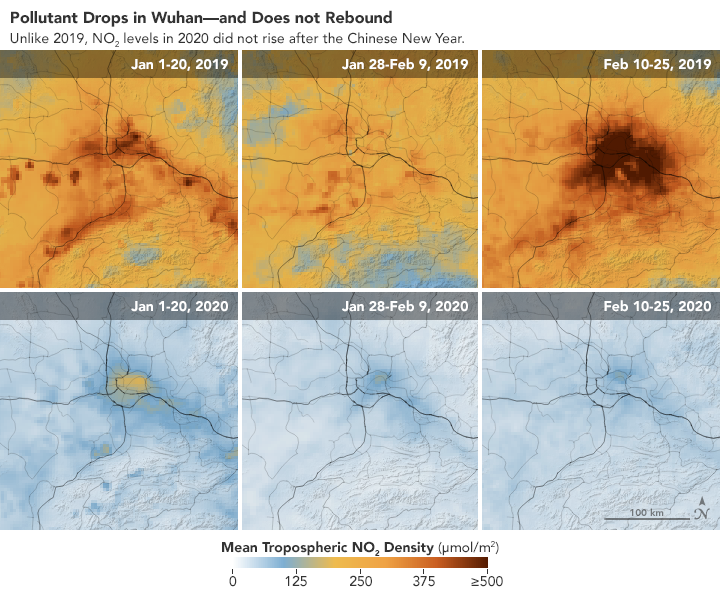
The maps above show NO2 values over three periods in 2020: January 1-20 (before Lunar New Year), January 28-February 9 (around New Year celebrations), and February 10-25 (after the event). The 2020 values are compared to the same periods in 2019 for reference. Lefer noted that the overall values in 2020 were lower than 2019 due to new environmental regulations that China has enforced over the past few years.
While the Lunar New Year may have played a role in the recent dropoff, researchers believe the decrease is more than a holiday effect or weather-related variation. In a preliminary analysis, NASA researchers compared NO2 values detected by OMI in 2020 with the average amounts detected at this time of year from 2005-2019. In 2020, NO2 values in eastern and central China were significantly lower (from 10 to 30 percent lower) than what is normally observed for this time period.
Additionally, Liu and colleagues have not seen a rebound in NO2 after the holiday. “This year, the reduction rate is more significant than in past years and it has lasted longer,” she said. “I am not surprised because many cities nationwide have taken measures to minimize spread of the virus.”


