Study finds Black and Hispanic Americans are disproportionately exposed to wider temperature swings
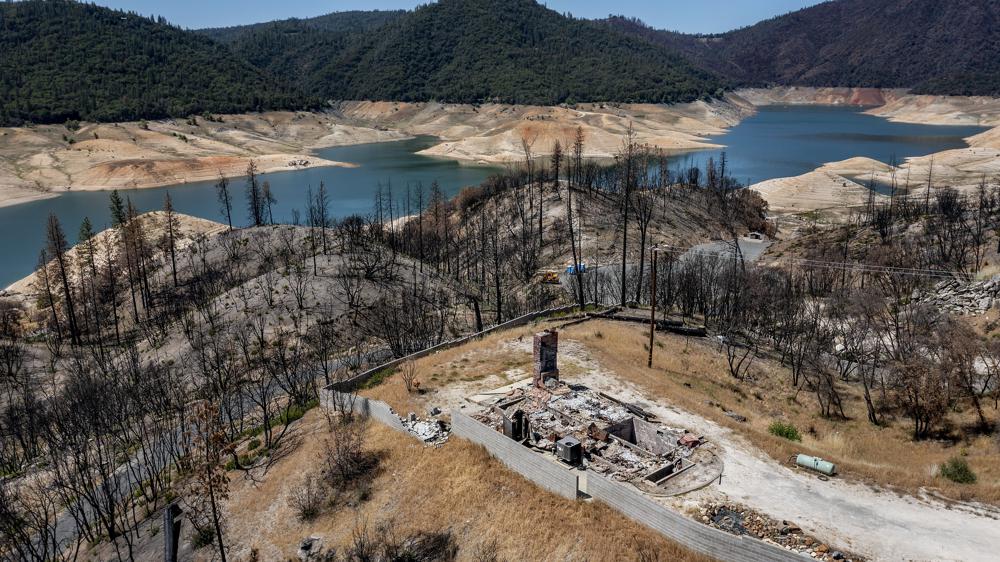
22 May 2024 (PNAS Nexus) – Extreme heat can harm human health, but so can extreme temperature swings. Large daily temperature variation (DTV) has been associated with elevated mortality in studies around the world. Trees and other vegetation can lower DTV, as trees reduce temperature through transpiration during the day and also trap long-wave radiation in the atmosphere under the canopy at night, increasing temperature.
But green space is not equally distributed in most cities. Shengjie Liu and Emily Smith-Greenaway examined inequality in DTV exposure in the US, using monthly nighttime and daytime land surface temperature data from satellites. The authors find that exposure to large DTV differs significantly between white and non-white populations at the census tract level. The work was published in PNAS Nexus.
Specifically, the authors note larger DTV exposure among Black and Hispanic populations, who experience temperature swings of up to 3 degrees Celsius larger than white census tracts. Unequal exposure to DTV is also observed between low-income and high-income populations, though to a lesser degree.
The differences in DTV seem to be driven by green space in the urban environment, although the inequalities in this case are larger than the inequalities in experiencing the urban heat island effect, a more well-known consequence of the different urban fabrics that comprise different American neighborhoods. According to the authors, DTV should be considered a fundamental source of climate-induced health disparities.
Study finds Black and Hispanic Americans are disproportionately exposed to wider temperature swings
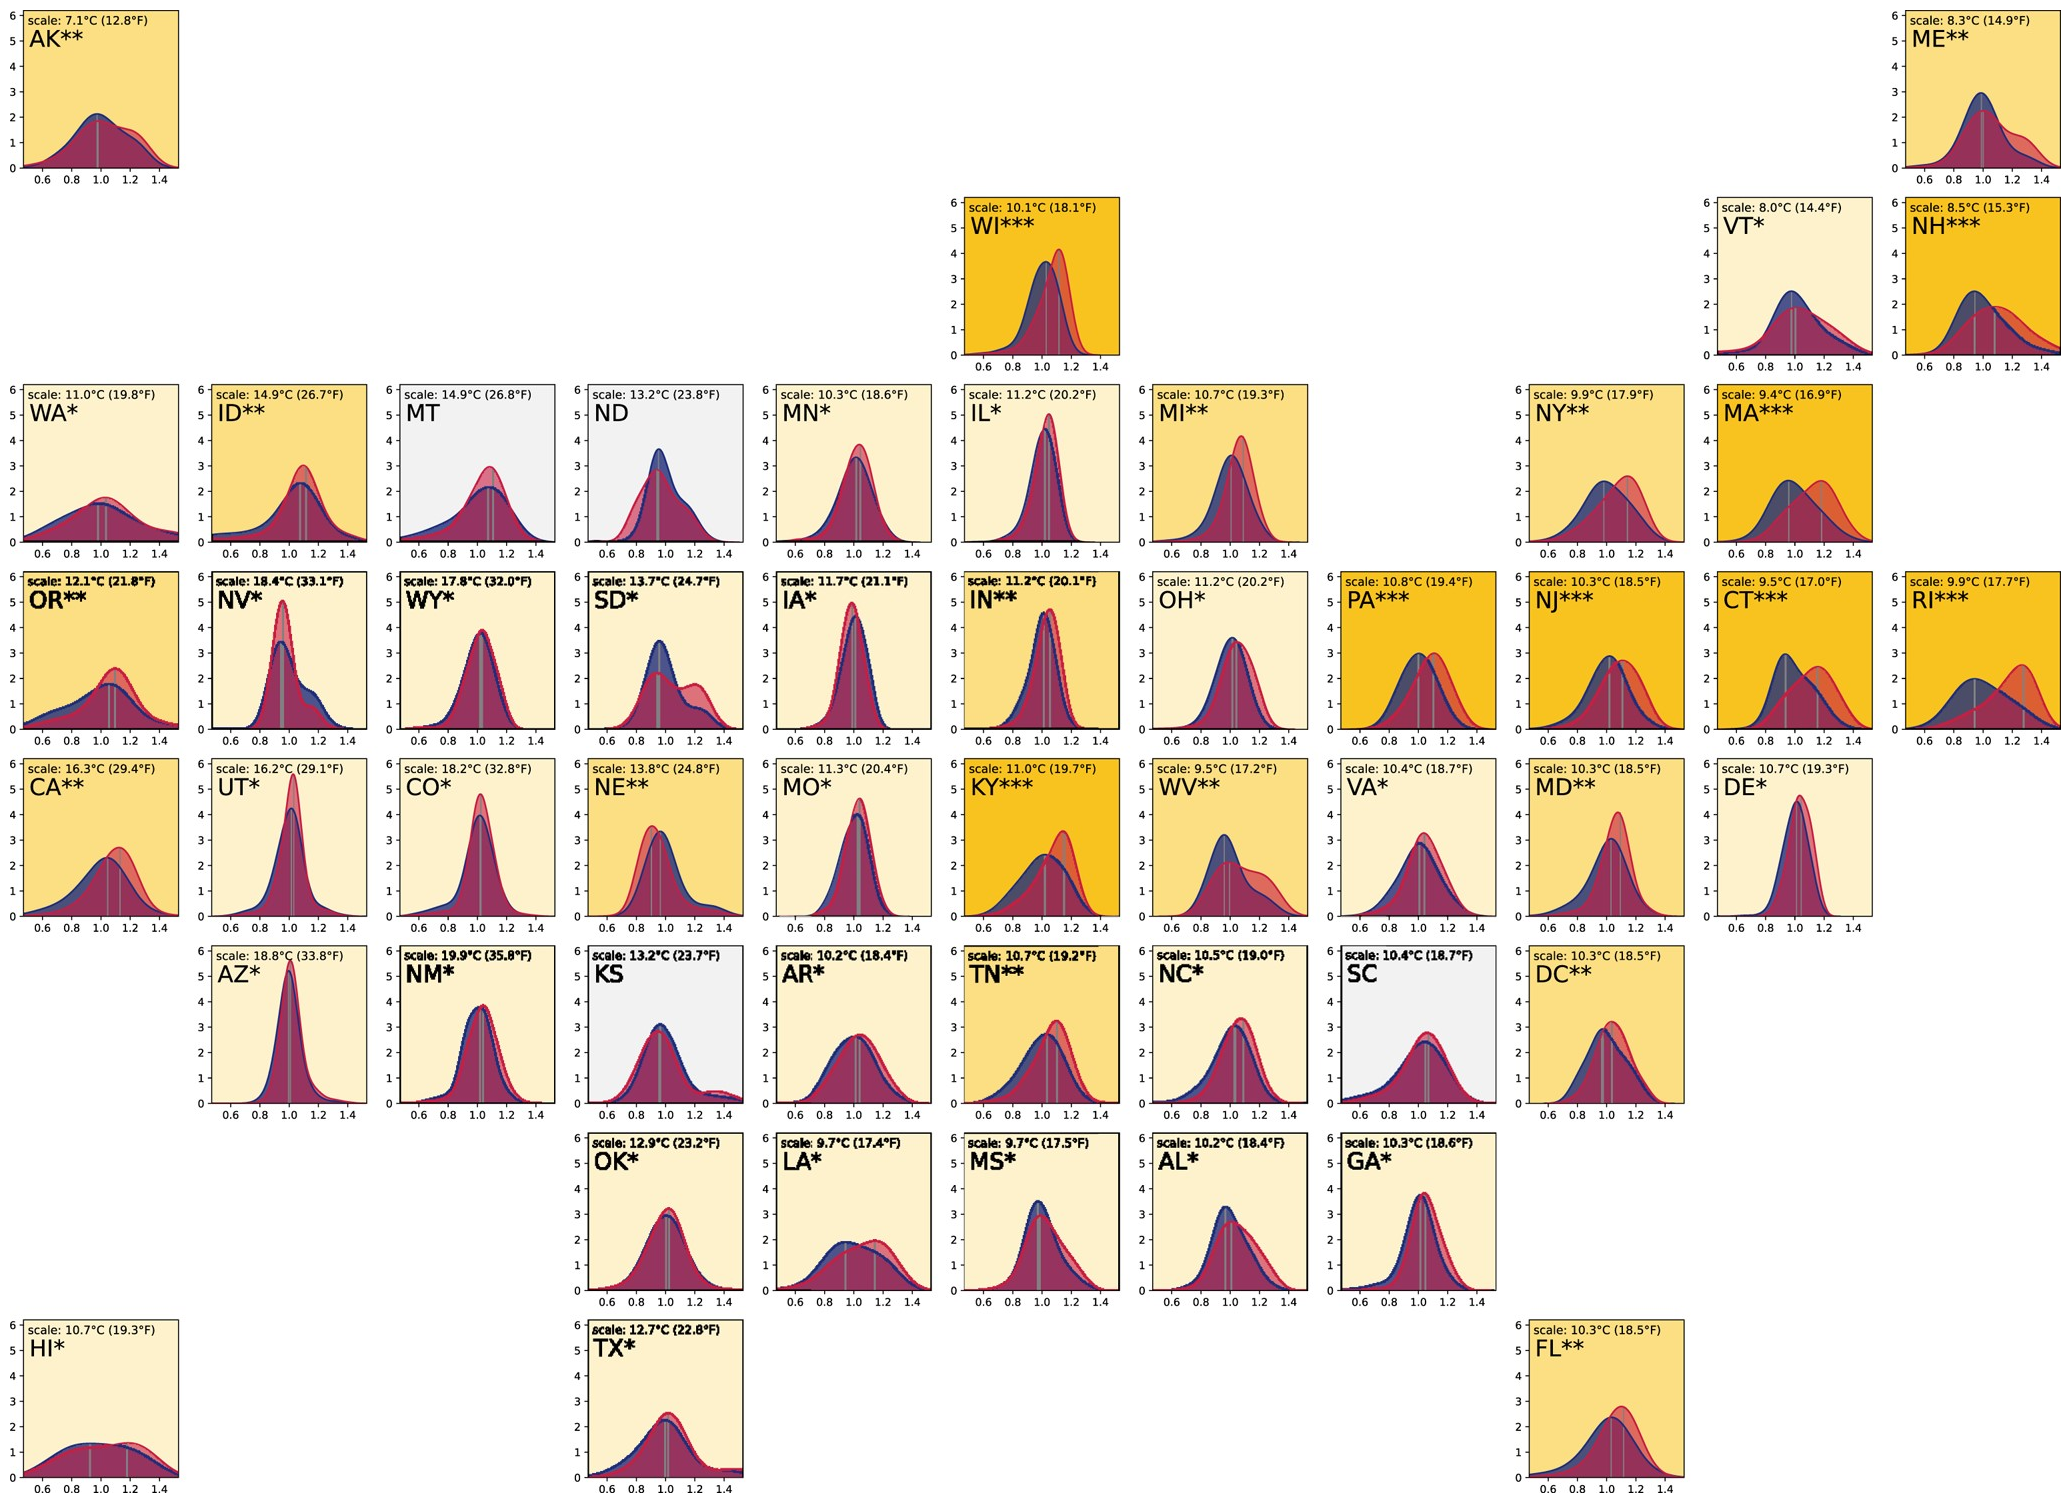
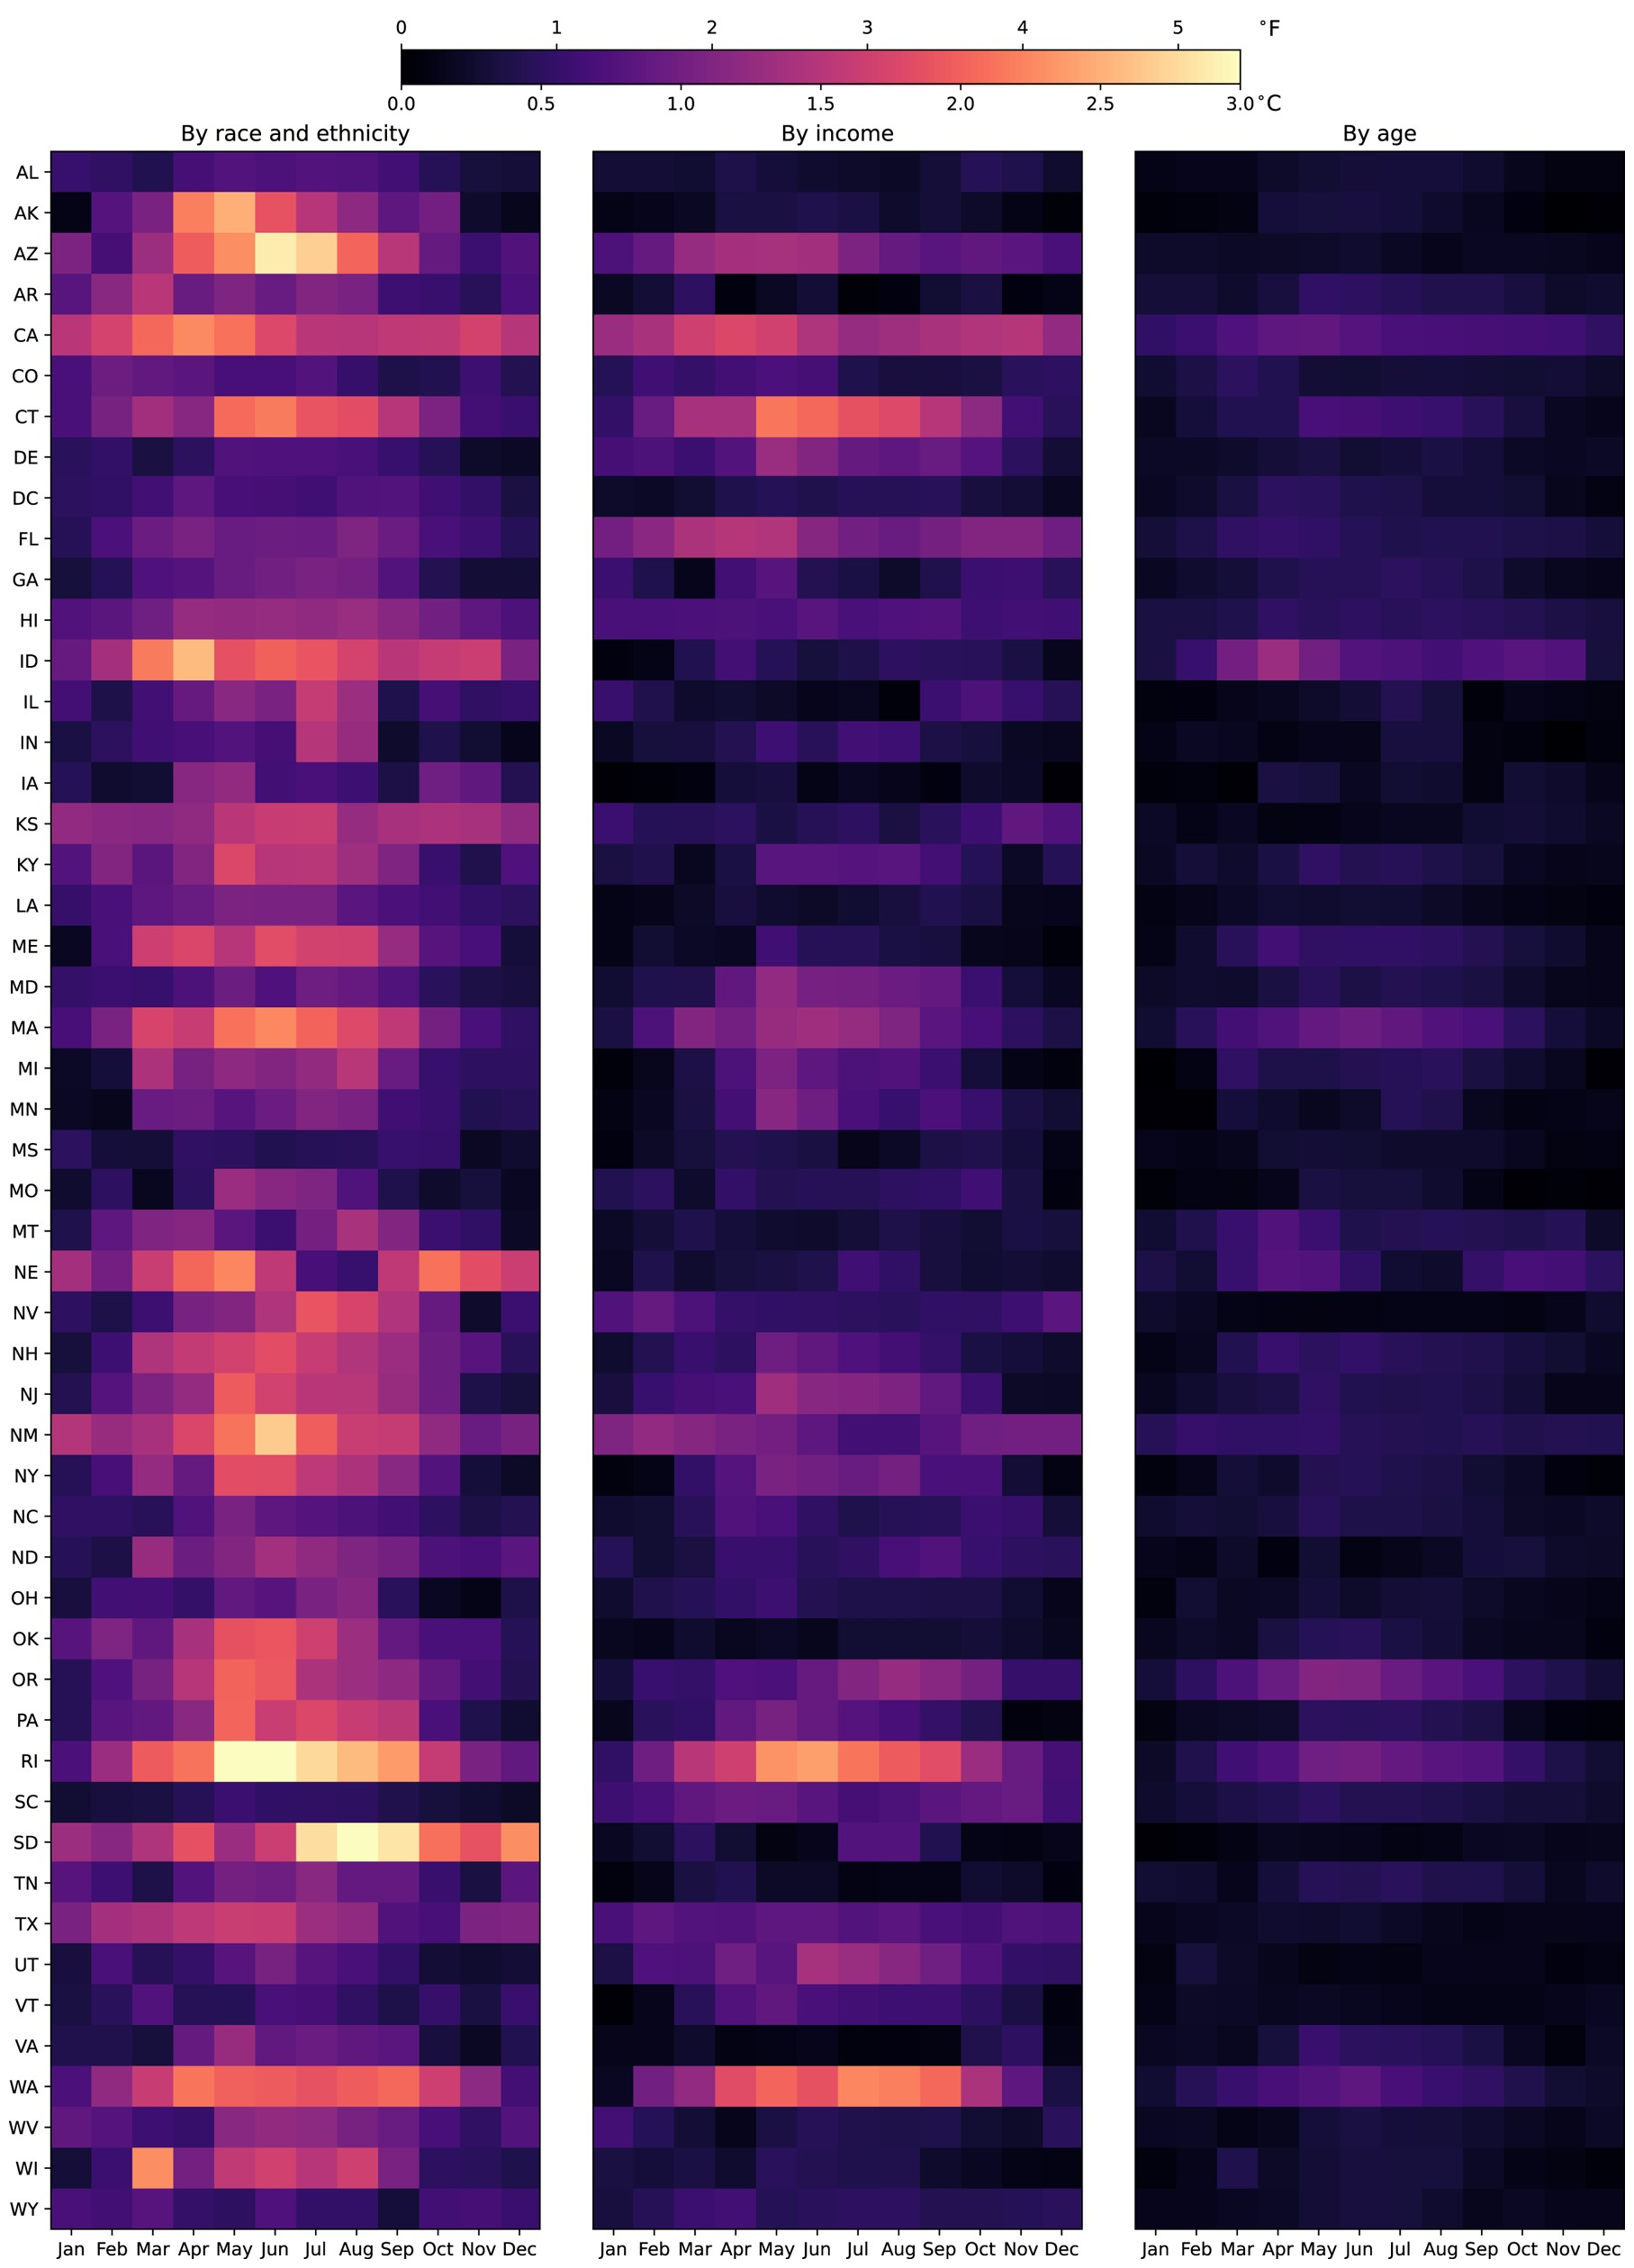
 ); distance ≥0.2: state abbreviation marked with ** (background in moderate yellow
  ); distance ≥0.3: state abbreviation marked with *** (background in yellow
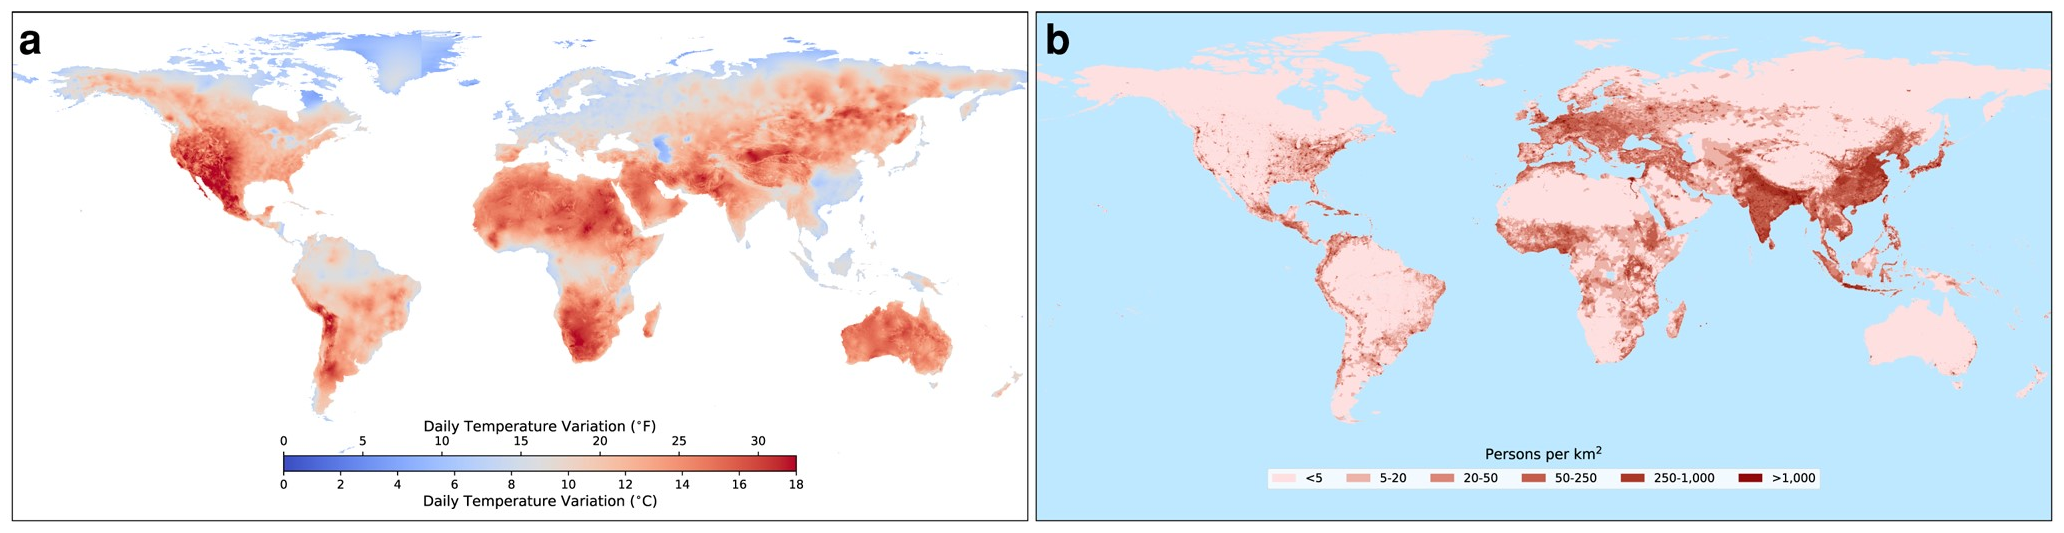
  ). Figure S5 shows a more detailed comparison using the four racial and ethnic groups, which shows that Black and Hispanic populations are exposed to generally higher DTV than the Asian population, yet the Asian population exposure is also higher than the White population. As such, the non-White and White comparisons showcased here would be even more dramatic if studying only Black and Hispanic populations to their White counterparts. Graphic: Liu and Smith-Greenaway, 2024 / PNAS Nexus
Racial and ethnic minorities disproportionately exposed to extreme daily temperature variation in the United States
ABSTRACT: In the history of Homo sapiens, well-populated habitats have featured relatively stable temperatures with generally small daily variations. As the global population is increasingly residing in highly disparate climates, a burgeoning literature has documented the adverse health effects of single-day and day-to-day variation in temperature, raising questions of inequality in exposure to this environmental health risk. Yet, we continue to lack understanding of inequality in exposure to daily temperature variation (DTV) in the highly unequal United States. Using nighttime and daytime land surface temperature data between 2000 and 2017, this study analyzes population exposure to long-term DTV by race and ethnicity, income, and age for the 50 states and the District of Columbia. The analysis is based on population-weighted exposure at the census-tract level. We find that, on average, non-White (especially Black and Hispanic) and low-income Americans are exposed disproportionately to larger DTV. Race-based inequalities in exposure to DTV are larger than income-based disparities, with inequalities heightened in the summer months. In May, for example, the DTV difference by race and ethnicity of 51 states is between 0.20 and 3.01 °C (up to 21.0%). We find that younger populations are, on average, exposed to larger DTV, though the difference is marginal.