U.S. life expectancy continues to decline – Working-age Americans dying at higher rates, especially in economically hard-hit states – “This is a distinctly American phenomenon”
By Mary Kate Brogan
26 November 2019
(Virginia Commonwealth University) – Mortality rates among working-age Americans continue to climb, causing a decrease in U.S. life expectancy that is severely impacting certain regions of the United States, according to a Virginia Commonwealth University study set to publish Tuesday in JAMA. The report, “Life Expectancy and Mortality Rates in the United States, 1959-2017,” is one of the most comprehensive 50-state analyses of U.S. mortality.
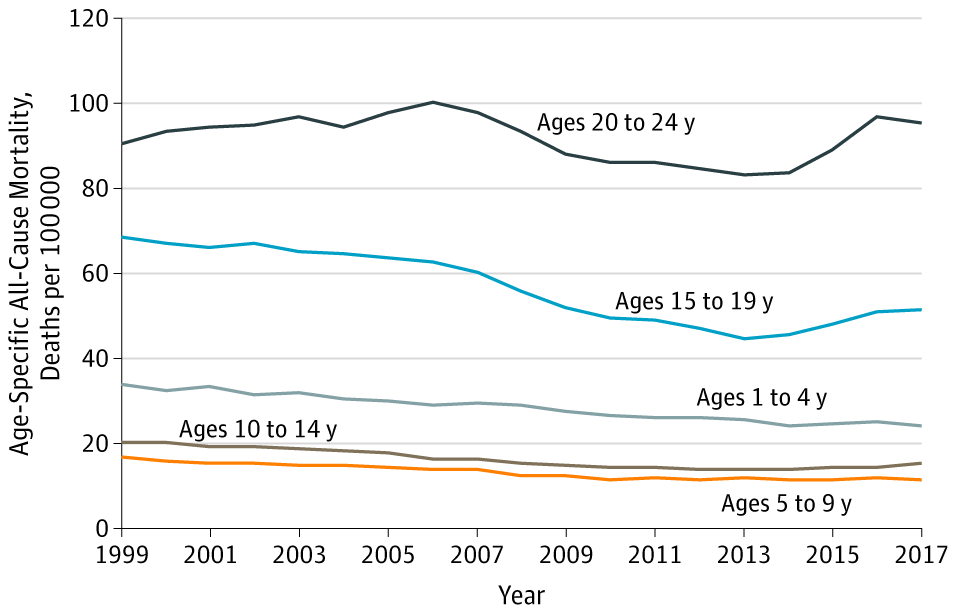
Deaths among Americans ages 25 to 64 are increasing, particularly in Rust Belt states and Appalachia. These deaths, which have fueled a decline in U.S. life expectancy since 2014, are linked to several major causes of death. Compared to the 1990s, working-age adults are now more likely to die before age 65 from drug overdoses, alcohol abuse and suicides — sometimes referred to as “deaths of despair”— but also from an array of organ system diseases. Mortality rates have increased for 35 causes of death, said lead author Steven Woolf, M.D., director emeritus of the VCU Center on Society and Health.
“Working-age Americans are more likely to die in the prime of their lives,” Woolf said. “For employers, this means that their workforce is dying prematurely, impacting the U.S. economy. More importantly, this trend means that children are losing their parents and our children are destined to live shorter lives than us.”
The paper calls for a better understanding of the root causes of these deaths, including the role of drugs, obesity, the health care system, stress and the economy. The impact of rising death rates is far-reaching from a public health perspective, as well as for the nation’s future, said Woolf, a professor in the Department of Family Medicine and Population Health in the VCU School of Medicine.
The study shows that some of the largest increases in working-age mortality since 2010 occurred among women and adults without a high school diploma. The industrial Midwest and other regions that have been hard-hit by changes in the economy since the 1980s, such as job losses in manufacturing and other sectors, are experiencing the largest increases in mortality. The study lists socioeconomic pressures and unstable employment among possible explanations for increased working-age mortality in these areas.
Woolf and his VCU team published a paper in 2018 that showed that the increase in working-age mortality was affecting all racial groups. The new JAMA report uses data from the U.S. Mortality Database and Centers for Disease Control Wide-ranging Online Data for Epidemiologic Research, going back to 1959, to examine which regions and states have been most affected.
Woolf and co-author Heidi Schoomaker, now at Eastern Virginia Medical School, found that life expectancy decreased in some regions, such as northern New England (Maine, New Hampshire and Vermont) and the Ohio Valley (Indiana, Kentucky, Ohio and Pennsylvania), but increased along the Pacific coast. The four Ohio Valley states are responsible for one-third of excess deaths — the number of deaths greater than the number of deaths projected by U.S. mortality rates — since 2010.
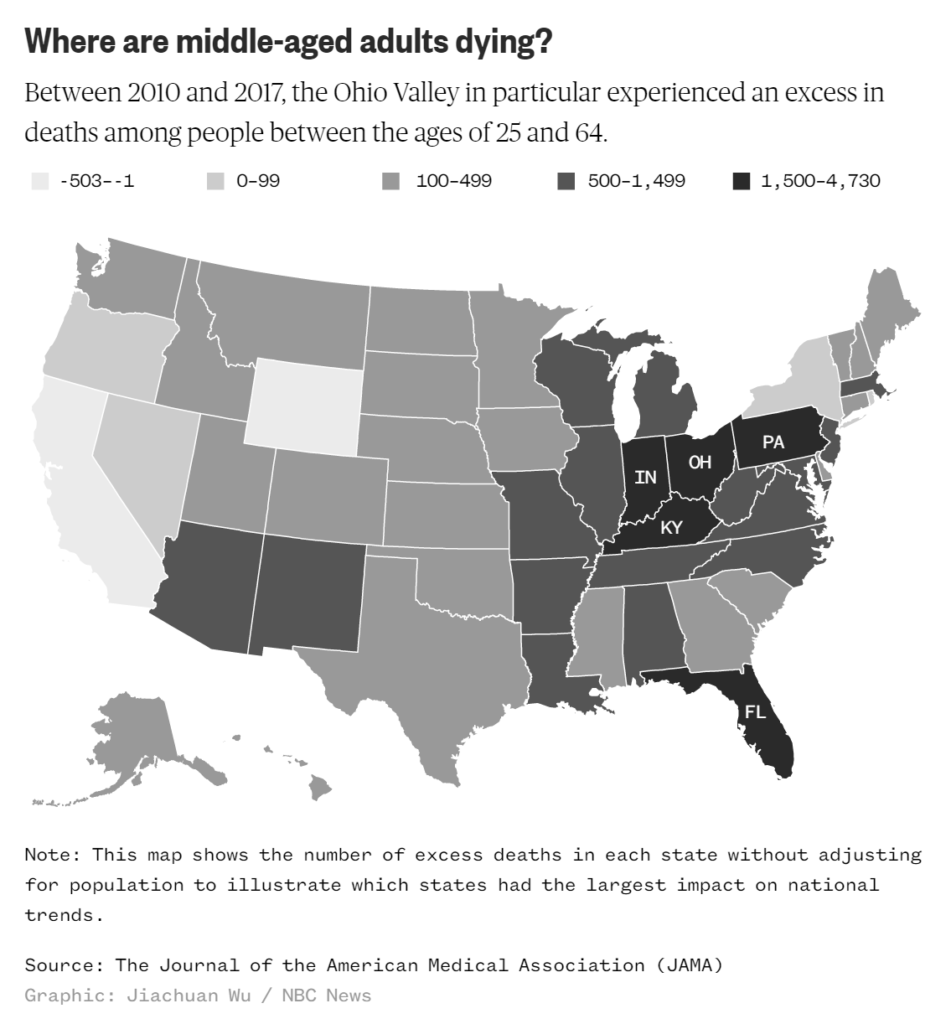
Eight of the 10 states with the largest number of excess deaths for ages 25 to 64 were in the Rust Belt or Appalachia, Woolf said, and the 13 Appalachian states accounted for half of excess deaths.
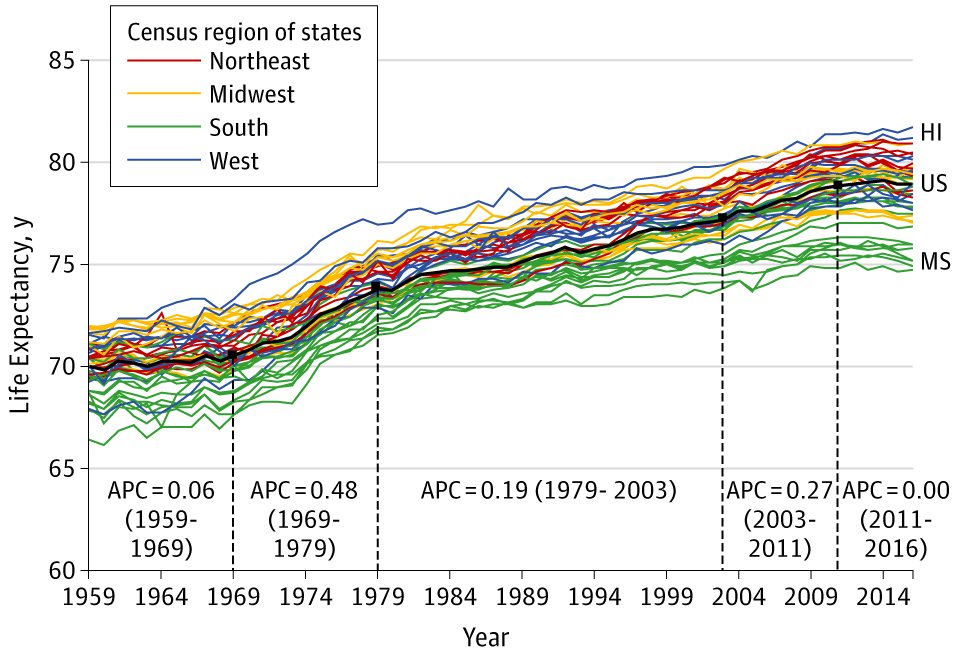
Woolf found that the trend of increasing mortality goes back decades. U.S. life expectancy lost pace with other wealthy countries in the 1980s, stopped increasing in 2011 and has been falling since 2014.
“The notion that U.S. death rates are increasing for working-age adults is particularly disturbing because it is not happening like this in other countries,” Woolf said. “This is a distinctly American phenomenon.”
Contact
- Mary Kate Brogan, University Public Affairs, 804-828-7701, broganm2@vcu.edu
Life Expectancy and Mortality Rates in the United States, 1959-2017
ABSTRACT: U.S. life expectancy has not kept pace with that of other wealthy countries and is now decreasing. Life expectancy data for 1959-2016 and cause-specific mortality rates for 1999-2017 were obtained from the U.S. Mortality Database and CDC WONDER, respectively. The analysis focused on midlife deaths (ages 25-64 years), stratified by sex, race/ethnicity, socioeconomic status, and geography (including the 50 states). Published research from January 1990 through August 2019 that examined relevant mortality trends and potential contributory factors was examined. Between 1959 and 2016, US life expectancy increased from 69.9 years to 78.9 years but declined for 3 consecutive years after 2014. The recent decrease in U.S. life expectancy culminated a period of increasing cause-specific mortality among adults aged 25 to 64 years that began in the 1990s, ultimately producing an increase in all-cause mortality that began in 2010. During 2010-2017, midlife all-cause mortality rates increased from 328.5 deaths/100 000 to 348.2 deaths/100 000. By 2014, midlife mortality was increasing across all racial groups, caused by drug overdoses, alcohol abuse, suicides, and a diverse list of organ system diseases. The largest relative increases in midlife mortality rates occurred in New England (New Hampshire, 23.3%; Maine, 20.7%; Vermont, 19.9%) and the Ohio Valley (West Virginia, 23.0%; Ohio, 21.6%; Indiana, 14.8%; Kentucky, 14.7%). The increase in midlife mortality during 2010-2017 was associated with an estimated 33 307 excess US deaths, 32.8% of which occurred in 4 Ohio Valley states.
SIGNIFICANCE: U.S. life expectancy increased for most of the past 60 years, but the rate of increase slowed over time and life expectancy decreased after 2014. A major contributor has been an increase in mortality from specific causes (e.g., drug overdoses, suicides, organ system diseases) among young and middle-aged adults of all racial groups, with an onset as early as the 1990s and with the largest relative increases occurring in the Ohio Valley and New England. The implications for public health and the economy are substantial, making it vital to understand the underlying causes.
Life Expectancy and Mortality Rates in the United States, 1959-2017