Greenland losing ice seven times faster than in the 1990s – Sea level rise from Greenland melt tracking highest climate projections

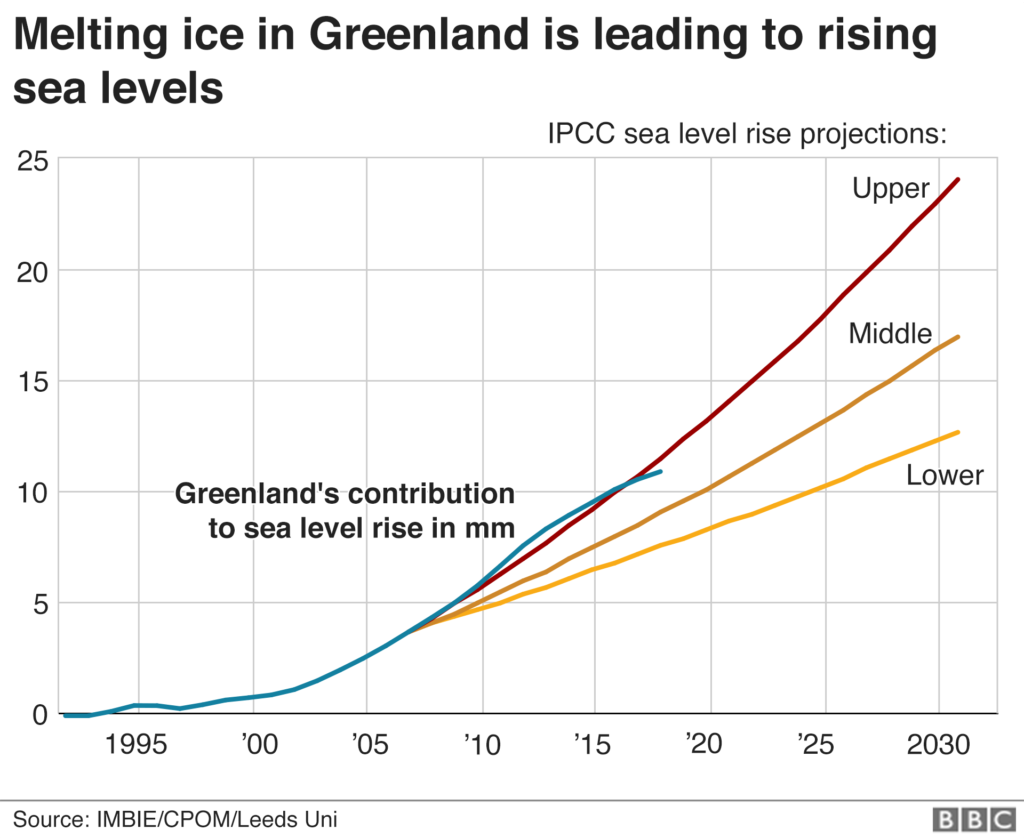
10 December 2019 (Utrecht University) – Greenland is losing ice seven times faster than in the 1990s and is tracking the IPCC’s high-end climate warming scenario, which would see 40 million more people exposed to coastal flooding by 2100. The findings, published in Nature today, show that Greenland has lost 3.8 trillion tonnes of ice since 1992 – enough to push global sea levels up by 10.6 millimetres. The rate of ice loss has risen from 33 billion tonnes per year in the 1990’s to 254 billion tonnes per year in the last decade – a seven-fold increase within three decades.
A team of 89 polar scientists from 50 international organisations have produced the most complete picture of Greenland ice loss to date. The Ice Sheet Mass Balance Inter-comparison Exercise (IMBIE) Team combined 26 separate surveys to compute changes in the mass of Greenland’s ice sheet between 1992 and 2018. Altogether, data from 11 different satellite missions were used, including measurements of the ice sheet’s changing volume, flow and gravity. Utrecht University researchers contributed by accurately calculating the amount of snowfall and meltwater runoff over the Greenland ice sheet. Increased meltwater runoff is the major source of mass loss from the ice sheet.
In 2013, the Intergovernmental Panel on Climate Change (IPCC) predicted that global sea levels will rise by 60 centimetres by 2100, putting 360 million people at risk of annual coastal flooding. But this new study shows that Greenland’s ice losses are rising faster than expected and are instead tracking the IPCC’s high-end climate warming scenario, which predicts 7 centimetres more.
Ice losses peaked at 335 billion tonnes per year in 2011 – ten times the rate of the 1990s – during a period of intense surface melting. Although the rate of ice loss dropped to an average 238 billion tonnes per year since then, this remains seven times higher and does not include all of 2019, which could set a new high due to widespread summer melting.
Erik Ivins (NASA JPL), co-leader of the study, says: “Satellite observations of polar ice are essential for monitoring and predicting how climate change could affect ice losses and sea level rise. While computer simulation allows us to make projections from climate change scenarios, the satellite measurements provide rather irrefutable evidence. Our project is a great example of the importance of international collaboration to tackle problems that are global in scale.”
Publication
Mass balance of the Greenland Ice Sheet from 1992 to 2018, Nature, 10 December 2019, DOI 10.1038/s41586-019-1855-2
IMBIE collaboration; with Utrecht University researchers Michiel van den Broeke, Brice Noël, Willem Jan van de Berg, Melchior van Wessem and Bert Wouters
Greenland ice losses rising faster than expected
Mass balance of the Greenland Ice Sheet from 1992 to 2018
ABSTRACT: In recent decades, the Greenland Ice Sheet has been a major contributor to global sea-level rise1,2, and it is expected to be so in the future3. Although increases in glacier flow4–6 and surface melting7–9 have been driven by oceanic10–12 and atmospheric13,14 warming, the degree and trajectory of today’s imbalance remain uncertain. Here we compare and combine 26 individual satellite measurements of changes in the ice sheet’s volume, flow and gravitational potential to produce a reconciled estimate of its mass balance. Although the ice sheet was close to a state of balance in the 1990s, annual losses have risen since then, peaking at 335 ± 62 billion tonnes per year in 2011. In all, Greenland lost 3,800 ± 339 billion tonnes of ice between 1992 and 2018, causing the mean sea level to rise by 10.6 ± 0.9 millimetres. Using three regional climate models, we show that reduced surface mass balance has driven 1,971 ± 555 billion tonnes (52%) of the ice loss owing to increased meltwater runoff. The remaining 1,827 ± 538 billion tonnes (48%) of ice loss was due to increased glacier discharge, which rose from 41 ± 37 billion tonnes per year in the 1990s to 87 ± 25 billion tonnes per year since then. Between 2013 and 2017, the total rate of ice loss slowed to 217 ± 32 billion tonnes per year, on average, as atmospheric circulation favoured cooler conditions15 and as ocean temperatures fell at the terminus of Jakobshavn Isbræ16. Cumulative ice losses from Greenland as a whole have been close to the IPCC’s predicted rates for their high-end climate warming scenario17, which forecast an additional 50 to 120 millimetres of global sea-level rise by 2100 when compared to their central estimate.


