Summer extremes of 2018 linked to stalled giant waves in jet stream
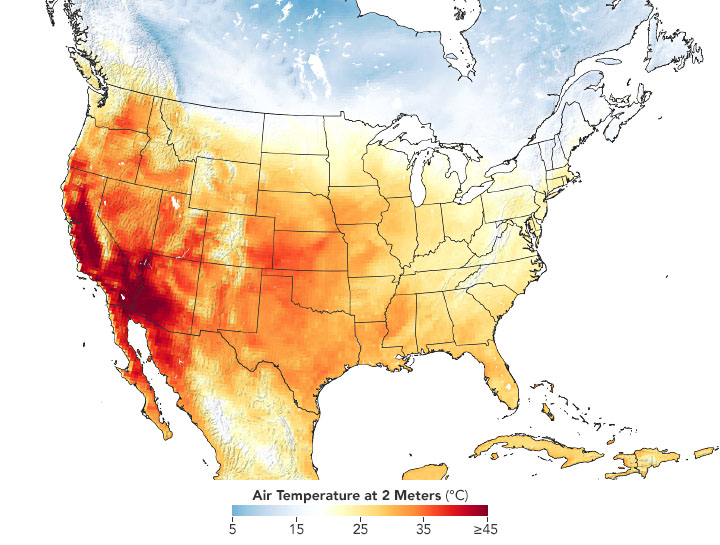
29 April 2019 (PIK) – Record breaking heatwaves and droughts in North America and Western Europe, torrential rainfalls and floods in South-East Europe and Japan – the summer of 2018 brought a series of extreme weather events that occurred almost simultaneously around the Northern Hemisphere in June and July. These extremes had something in common, a new study by an international team of climate researchers now finds: the events were connected by a newly identified pattern of the jet stream encircling the Earth. The jet stream formed a stalled wave pattern in the atmosphere which made weather conditions more persistent and thus extreme in the affected regions. The same pattern also occurred during European heat waves in 2015, 2006 and 2003, which rank among the most extreme heatwaves ever recorded. In recent years, the scientists observed a clear increase of these patterns.
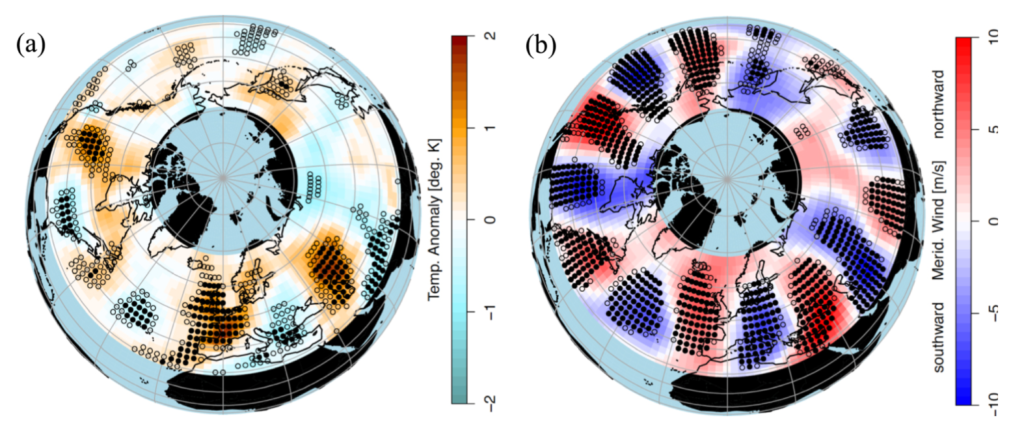
The jet stream, about 10 km high up in the atmosphere, steers large scale weather systems from west to east around the globe. The wind system can develop large meanders, so-called Rossby waves, and occasionally these waves stay in place for weeks. Under these conditions warm sunny days can turn into a heat wave and drought, and rainy days into a flood. “Our study shows that the specific locations and timing of the 2018 summer extremes weren’t random but directly connected to the emergence of a re-occurring pattern in the jet stream that stretches around the entire Northern Hemisphere,” says lead author Kai Kornhuber from the University of Oxford and the Potsdam Institute for Climate Impact Research (PIK).
Identified wind pattern was also present during past summers with extreme weather
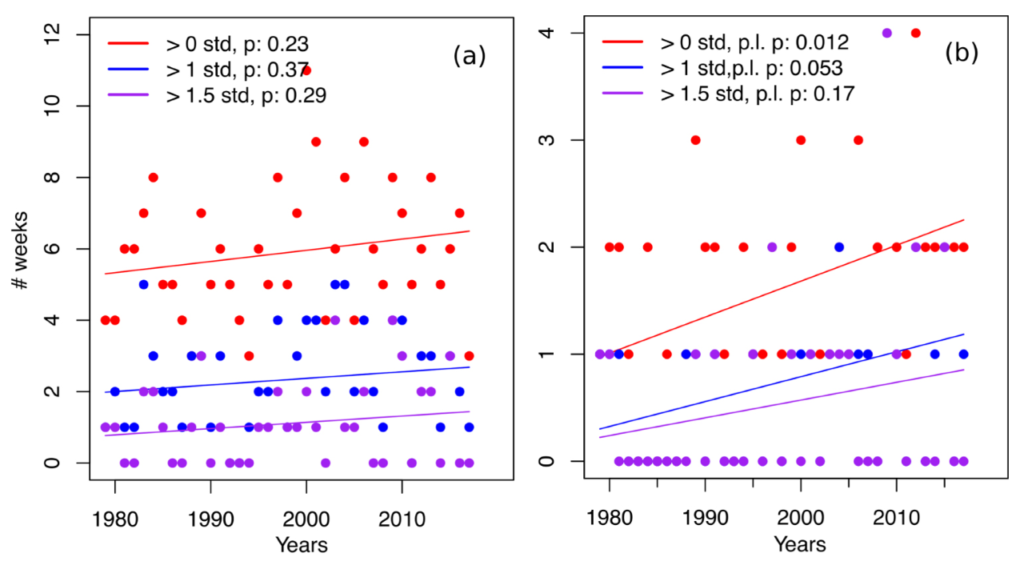
“We find a strong relation between the pattern and persistent heat extremes in Western Europe, North America and the Caspian Sea region. This pattern was present during other years with extreme weather events such as the heat waves in Europe during summer 2015, 2006 and 2003. Moreover, its frequency and duration have in fact increased over the last two decades.“ In the two decaces before 1999, there were no summers that saw a stalling wave pattern lasting for two weeks or more, but since then we have seen already seven such summers,” says co-author Dim Coumou from Vrije Universiteit Amsterdam and PIK.
The observed wave pattern is anticipated to re-occur more frequently in future because of climate change and human-caused global warming. There is a physical reason behind this: Land masses tend to heat up faster than the ocean areas. This leads to a more pronounced temperature contrast between land and ocean areas. “The stalling wave pattern may be favoured by this increased land ocean temperature contrast. Another relevant aspect could be the cooler than normal North Atlantic, likely a result of a slowdown of the Atlantic Meridional Overturning Circulation, commonly known as Gulf Stream System. However, this needs further investigation,” says Stefan Rahmstorf, who leads the Earth System Analysis research department at PIK.
Risk of very-extreme heatwaves in North America and Europe
The study also highlights that the simultaneous occurrence of extreme weather amplifies the risks for societies and global food production in particular. The affected regions constitute crop production sites which are amongst world’s most major bread baskets, and the majority of humans live in the Northern Hemisphere.
“These persistent heatwaves occurring through stalled wave patterns come on top of the general increase in temperature observed due to global warming. This creates the real possibility of particularly extreme heat waves, most notably in regions like North America and Europe,” adds Scott Osprey from the British National Centre for Atmospheric Science based at the University of Oxford.
The identified pattern provides an opportunity for improving the early-prediction of future extreme weather events for vulnerable regions in the Northern Hemisphere. “It’s essential to consider these stalling wave patterns for future research on extreme weather,” concludes Kornhuber.
Article: Kai Kornhuber, Scott Osprey, Dim Coumou, Stefan Petri, Vladimir Petoukhov, Stefan Rahmstorf, Lesley Gray (2019): Extreme weather events in early summer 2018 connected by a recurrent hemispheric wave-7 pattern. Environmental Research Letters, Volume 14, Number 5. [DOI: 10.1088/1748-9326/ab13bf]
Weblink to the article: https://iopscience.iop.org/article/10.1088/1748-9326/ab13bf
Contact
- PIK press office, Phone: +49 331 288 25 07, E-Mail: press@pik-potsdam.de, Twitter: @PIK_Climate, www.pik-potsdam.de
Summer extremes of 2018 linked to stalled giant waves in jet stream
ABSTRACT: The summer of 2018 witnessed a number of extreme weather events such as heatwaves in North America, Western Europe and the Caspian Sea region, and rainfall extremes in South-East Europe and Japan that occurred near-simultaneously. Here we show that some of these extremes were connected by an amplified hemisphere-wide wavenumber 7 circulation pattern. We show that this pattern constitutes an important teleconnection in Northern Hemisphere summer associated with prolonged and above-normal temperatures in North America, Western Europe and the Caspian Sea region. This pattern was also observed during the European heatwaves of 2003, 2006 and 2015 among others. We show that the occurrence of this wave 7 pattern has increased over recent decades.
Extreme weather events in early summer 2018 connected by a recurrent hemispheric wave-7 pattern