Graph of the Day: Global mean surface temperature increase as a function of cumulative total global CO2 emissions
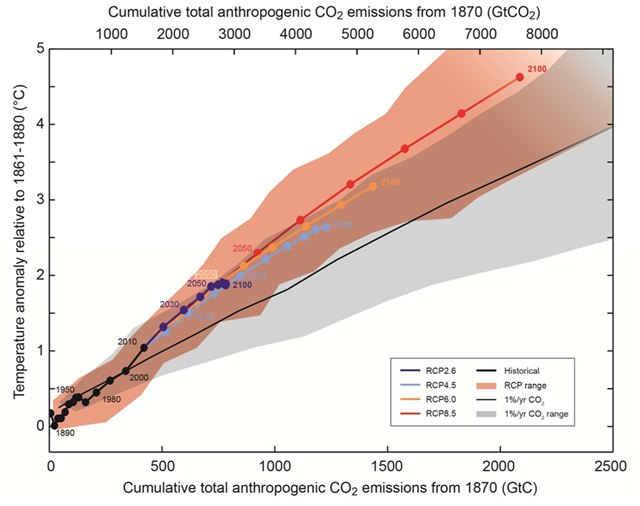
27 September 2013 (IPCC) – Global mean surface temperature increase as a function of cumulative total global CO2 emissions from various lines of evidence. Multi-model results from a hierarchy of climate-carbon cycle models for each RCP until 2100 are shown with coloured lines and decadal means (dots). Some decadal means are indicated for clarity (e.g., 2050 indicating the decade 2041−2050). Model results over the historical period (1860–2010) are indicated in black. The coloured plume illustrates the multi-model spread over the four RCP scenarios and fades with the decreasing number of available models in RCP8.5. The multi-model mean and range simulated by CMIP5 models, forced by a CO2 increase of 1% per year (1% per year CO2 simulations), is given by the thin black line and grey area. For a specific amount of cumulative CO2 emissions, the 1% per year CO2 simulations exhibit lower warming than those driven by RCPs, which include additional non-CO2 drivers. All values are given relative to the 1861−1880 base period. Decadal averages are connected by straight lines. {Figure 12.45; TFE.8, Figure 1}
- Cumulative total emissions of CO2 and global mean surface temperature response are approximately linearly related (see Figure SPM.10). Any given level of warming is associated with a range of cumulative CO2 emissions21, and therefore, e.g., higher emissions in earlier decades imply lower emissions later. {12.5}
- Limiting the warming caused by anthropogenic CO2 emissions alone with a probability of >33%, >50%, and >66% to less than 2°C since the period 1861–188022, will require cumulative CO2 emissions from all anthropogenic sources to stay between 0 and about 1560 GtC, 0 and about 1210 GtC, and 0 and about 1000 GtC since that period respectively23. These upper amounts are reduced to about 880 GtC, 840 GtC, and 800 GtC respectively, when accounting for non-CO2 forcings as in RCP2.6. An amount of 531 [446 to 616] GtC, was already emitted by 2011. {12.5}
- A lower warming target, or a higher likelihood of remaining below a specific warming target, will require lower cumulative CO2 emissions. Accounting for warming effects of increases in non- CO2 greenhouse gases, reductions in aerosols, or the release of greenhouse gases from permafrost will also lower the cumulative CO2 emissions for a specific warming target (see Figure SPM.10). {12.5}
- A large fraction of anthropogenic climate change resulting from CO2 emissions is irreversible on a multi-century to millennial time scale, except in the case of a large net removal of CO2 from the atmosphere over a sustained period. Surface temperatures will remain approximately constant at elevated levels for many centuries after a complete cessation of net anthropogenic CO2 emissions. Due to the long time scales of heat transfer from the ocean surface to depth, ocean warming will continue for centuries. Depending on the scenario, about 15 to 40% of emitted CO2 will remain in the atmosphere longer than 1,000 years. {Box 6.1, 12.4,12.5}
- It is virtually certain that global mean sea level rise will continue beyond 2100, with sea level rise due to thermal expansion to continue for many centuries. The few available model results that go beyond 2100 indicate global mean sea level rise above the pre-industrial level by 2300 to be less than 1 m for a radiative forcing that corresponds to CO2 concentrations that peak and decline and remain below 500 ppm, as in the scenario RCP2.6. For a radiative forcing that corresponds to a CO2 concentration that is above 700 ppm but below 1500 ppm, as in the scenario RCP8.5, the projected rise is 1 m to more than 3 m (medium confidence). {13.5}
- Sustained mass loss by ice sheets would cause larger sea level rise, and some part of the mass loss might be irreversible. There is high confidence that sustained warming greater than some threshold would lead to the near-complete loss of the Greenland ice sheet over a millennium or more, causing a global mean sea level rise of up to 7 m. Current estimates indicate that the threshold is greater than about 1°C (low confidence) but less than about 4°C (medium confidence) global mean warming with respect to pre-industrial. Abrupt and irreversible ice loss from a potential instability of marine-based sectors of the Antarctic Ice Sheet in response to climate forcing is possible, but current evidence and understanding is insufficient to make a quantitative assessment. {5.8, 13.4, 13.5}
- Methods that aim to deliberately alter the climate system to counter climate change, termed geoengineering, have been proposed. Limited evidence precludes a comprehensive quantitative assessment of both Solar Radiation Management (SRM) and Carbon Dioxide Removal (CDR) and their impact on the climate system. CDR methods have biogeochemical and technological limitations to their potential on a global scale. There is insufficient knowledge to quantify how much CO2 emissions could be partially offset by CDR on a century timescale. Modelling indicates that SRM methods, if realizable, have the potential to substantially offset a global temperature rise, but they would also modify the global water cycle, and would not reduce ocean acidification. If SRM were terminated for any reason, there is high confidence that global surface temperatures would rise very rapidly to values consistent with the greenhouse gas forcing. CDR and SRM methods carry side effects and long-term consequences on a global scale. {6.5, 7.7}
Climate Change 2013: The Physical Science Basis Summary for Policymakers [pdf]