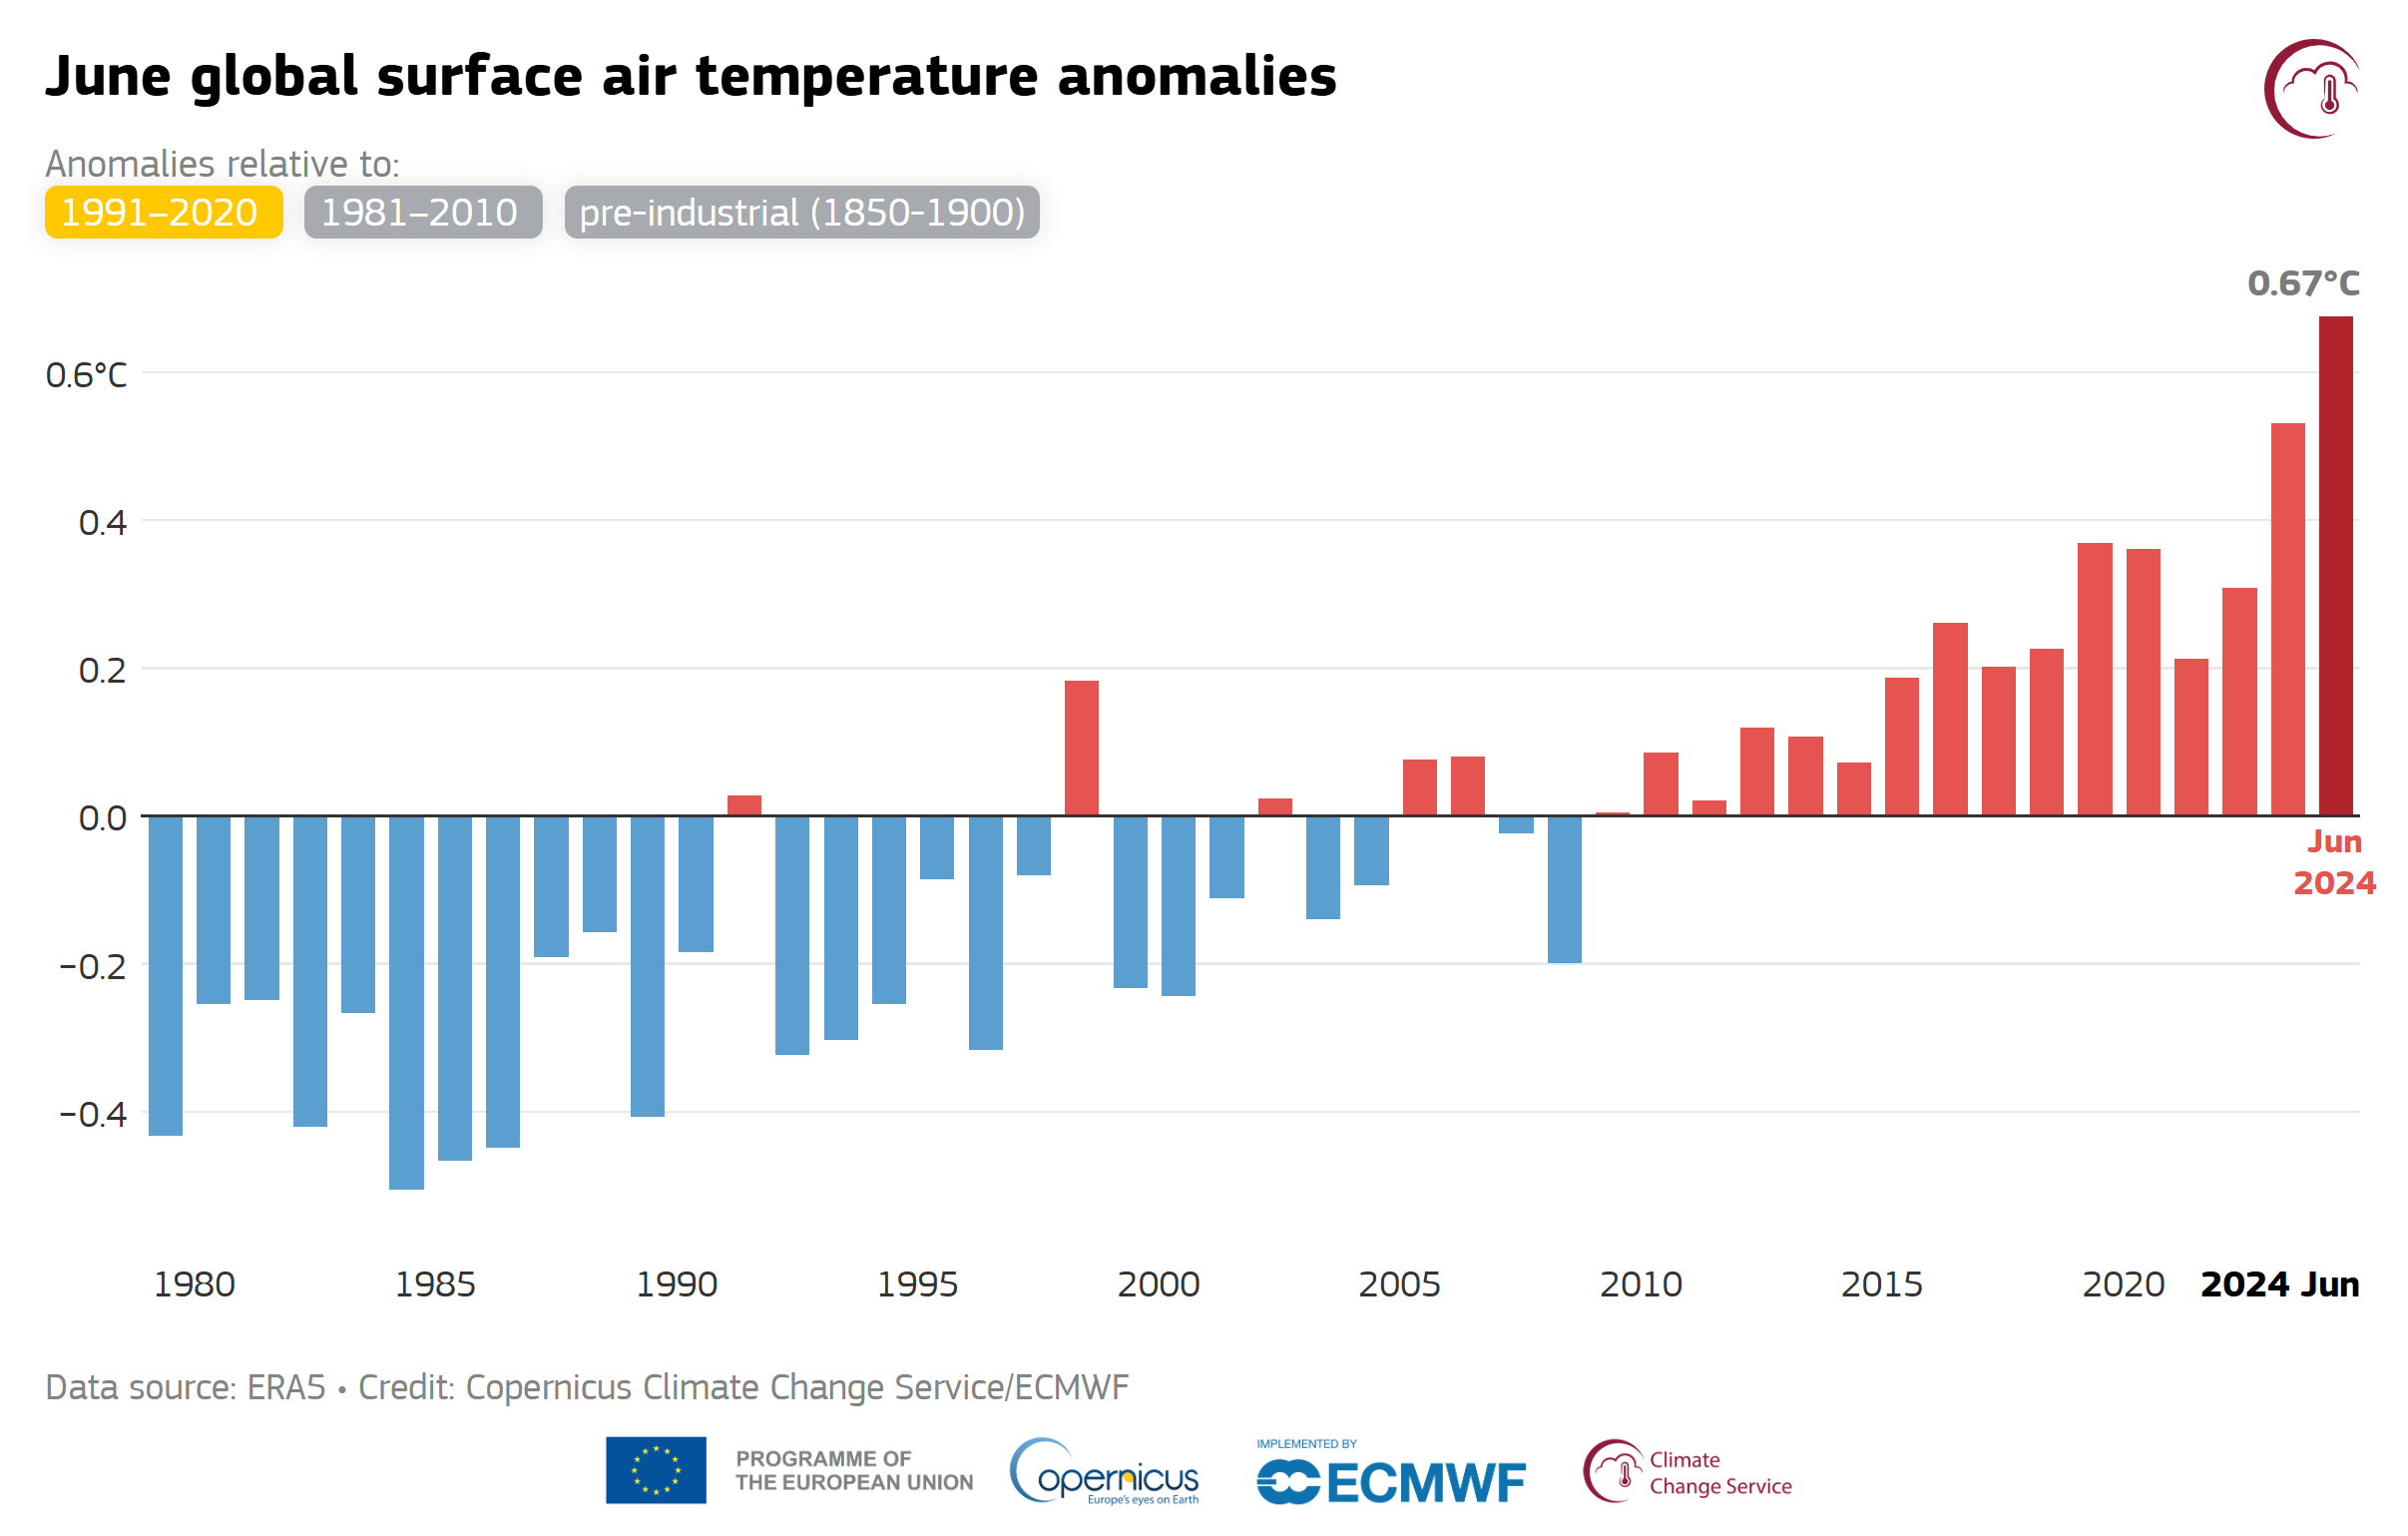
By Seth Borenstein 7 July 2024 (AP) – Earth’s more than year-long streak of record-shattering hot months kept on simmering through June, according to the European climate service Copernicus. There’s hope that the planet will soon see an end to the record-setting part of the heat streak, but not the climate chaos that has come […]
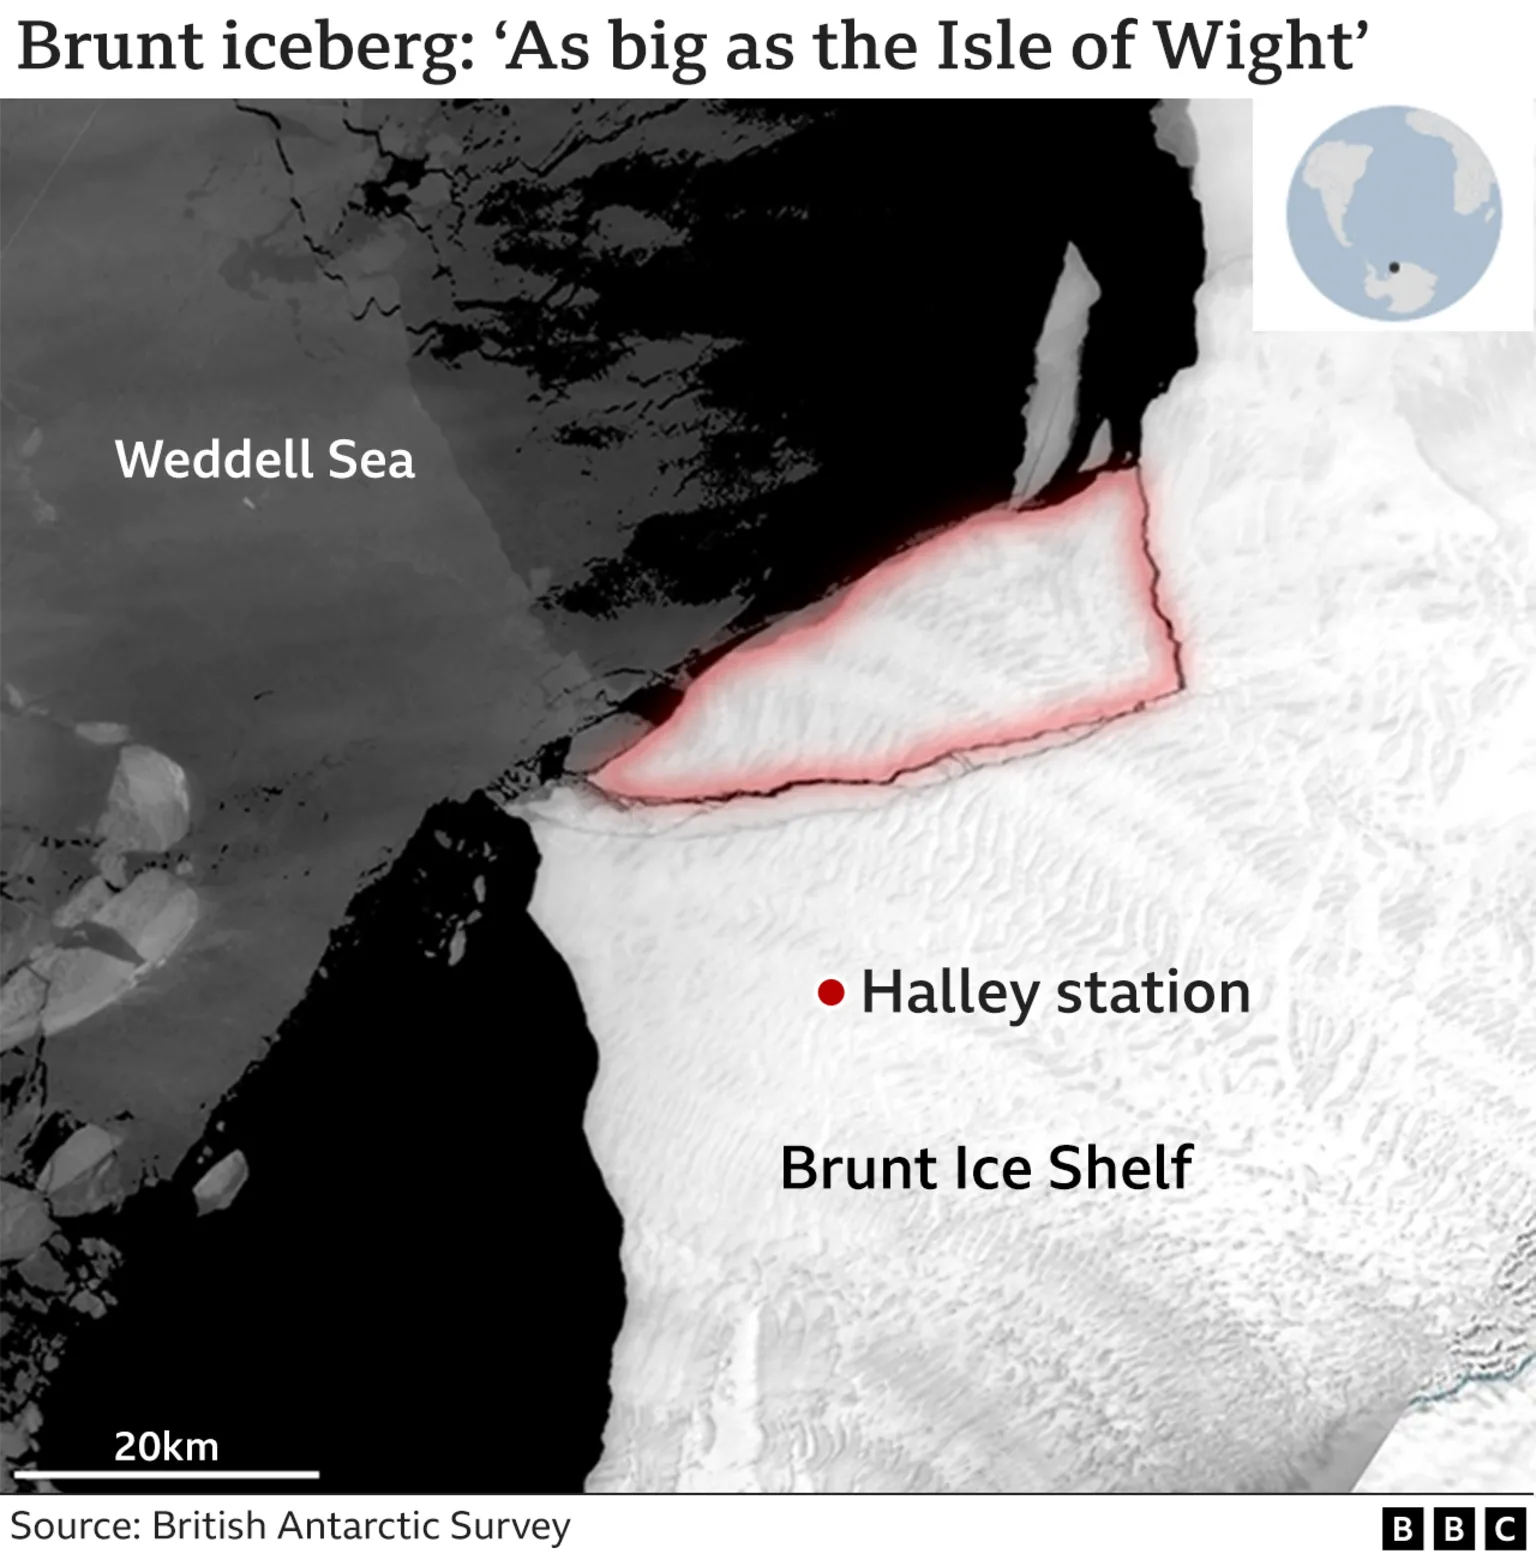
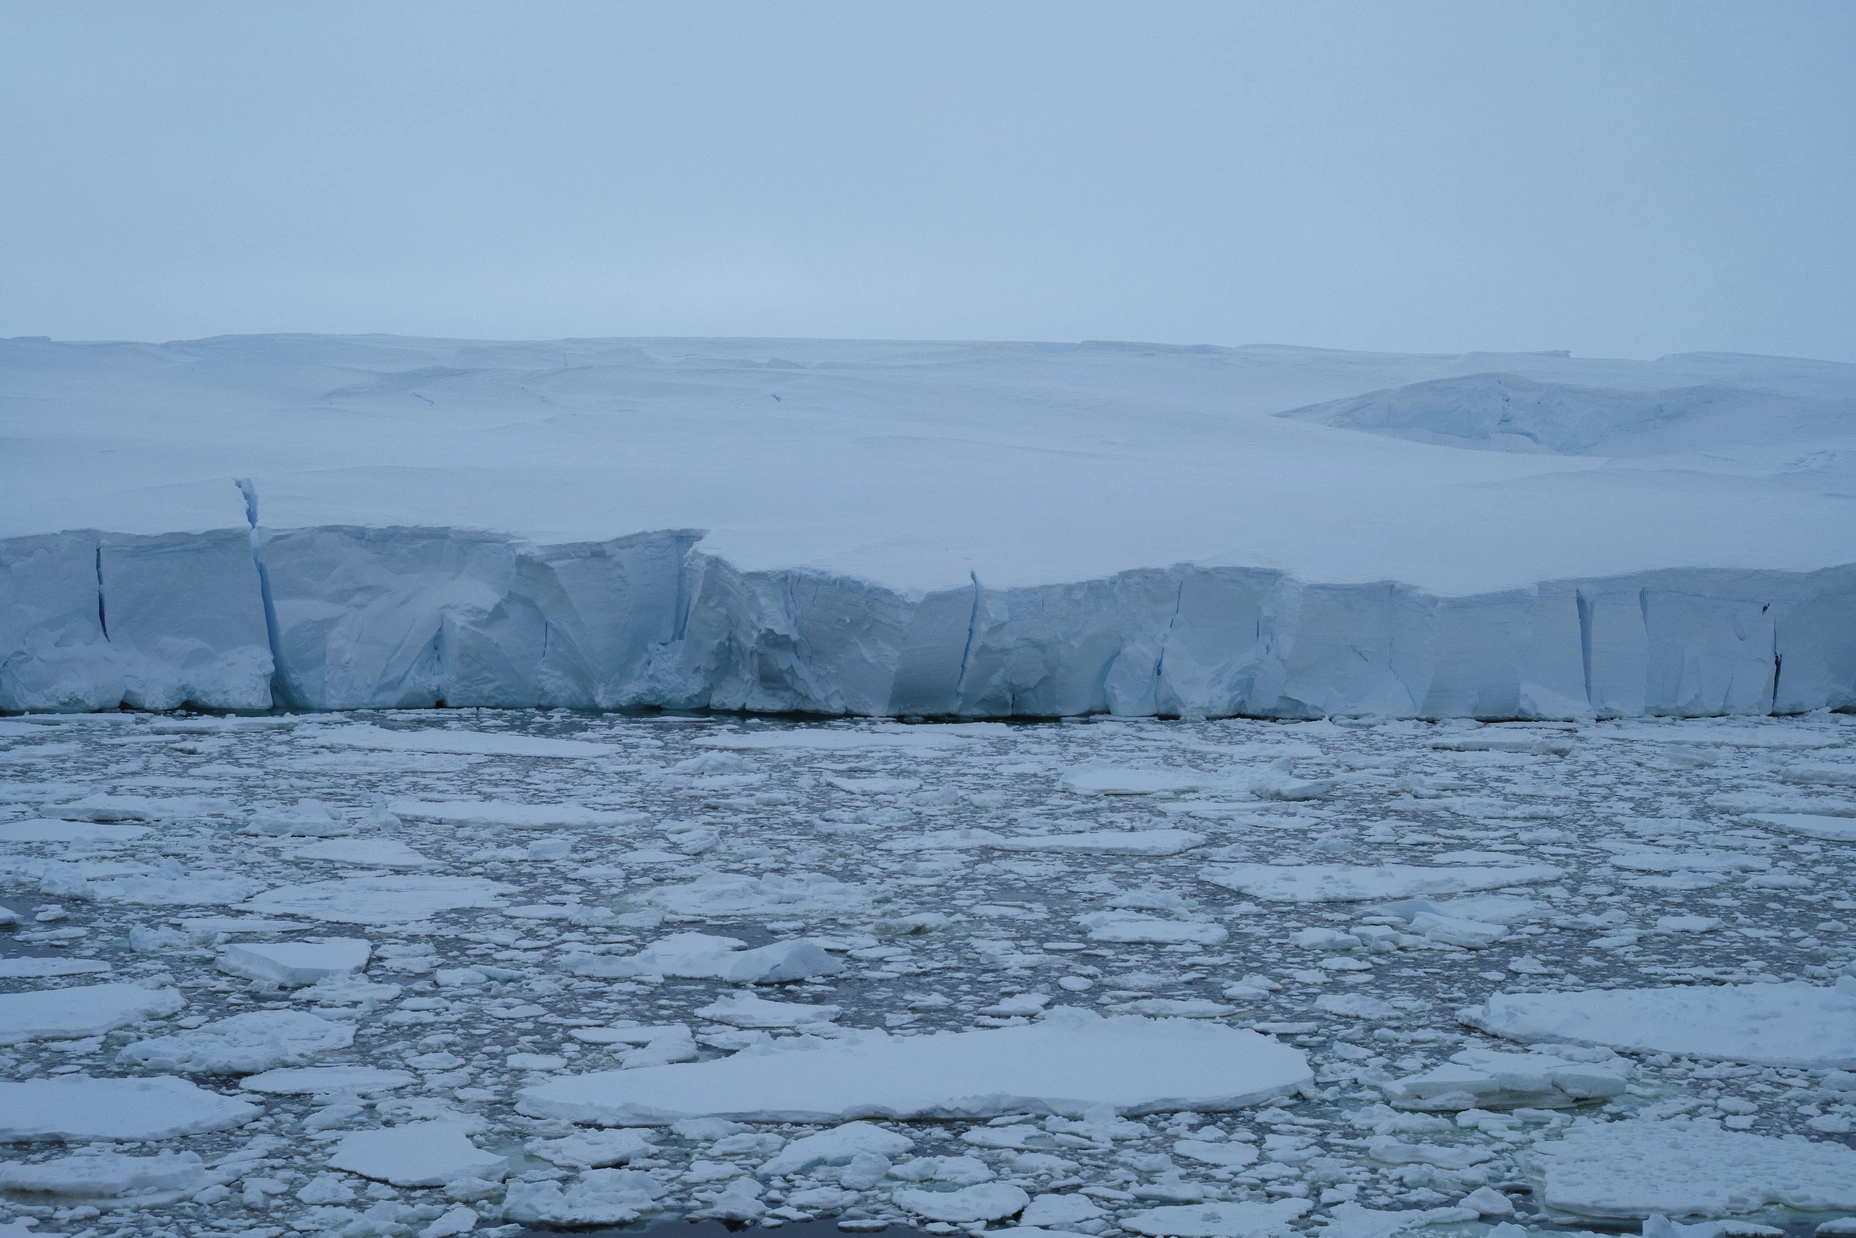
By Jonathan Amos 21 May 2024 (BBC News) – Another big iceberg has broken away from an area of the Antarctic that hosts the UK’s Halley research station. It is the third such block to calve near the base in the past three years. This new one is not quite as large, but still measures […]
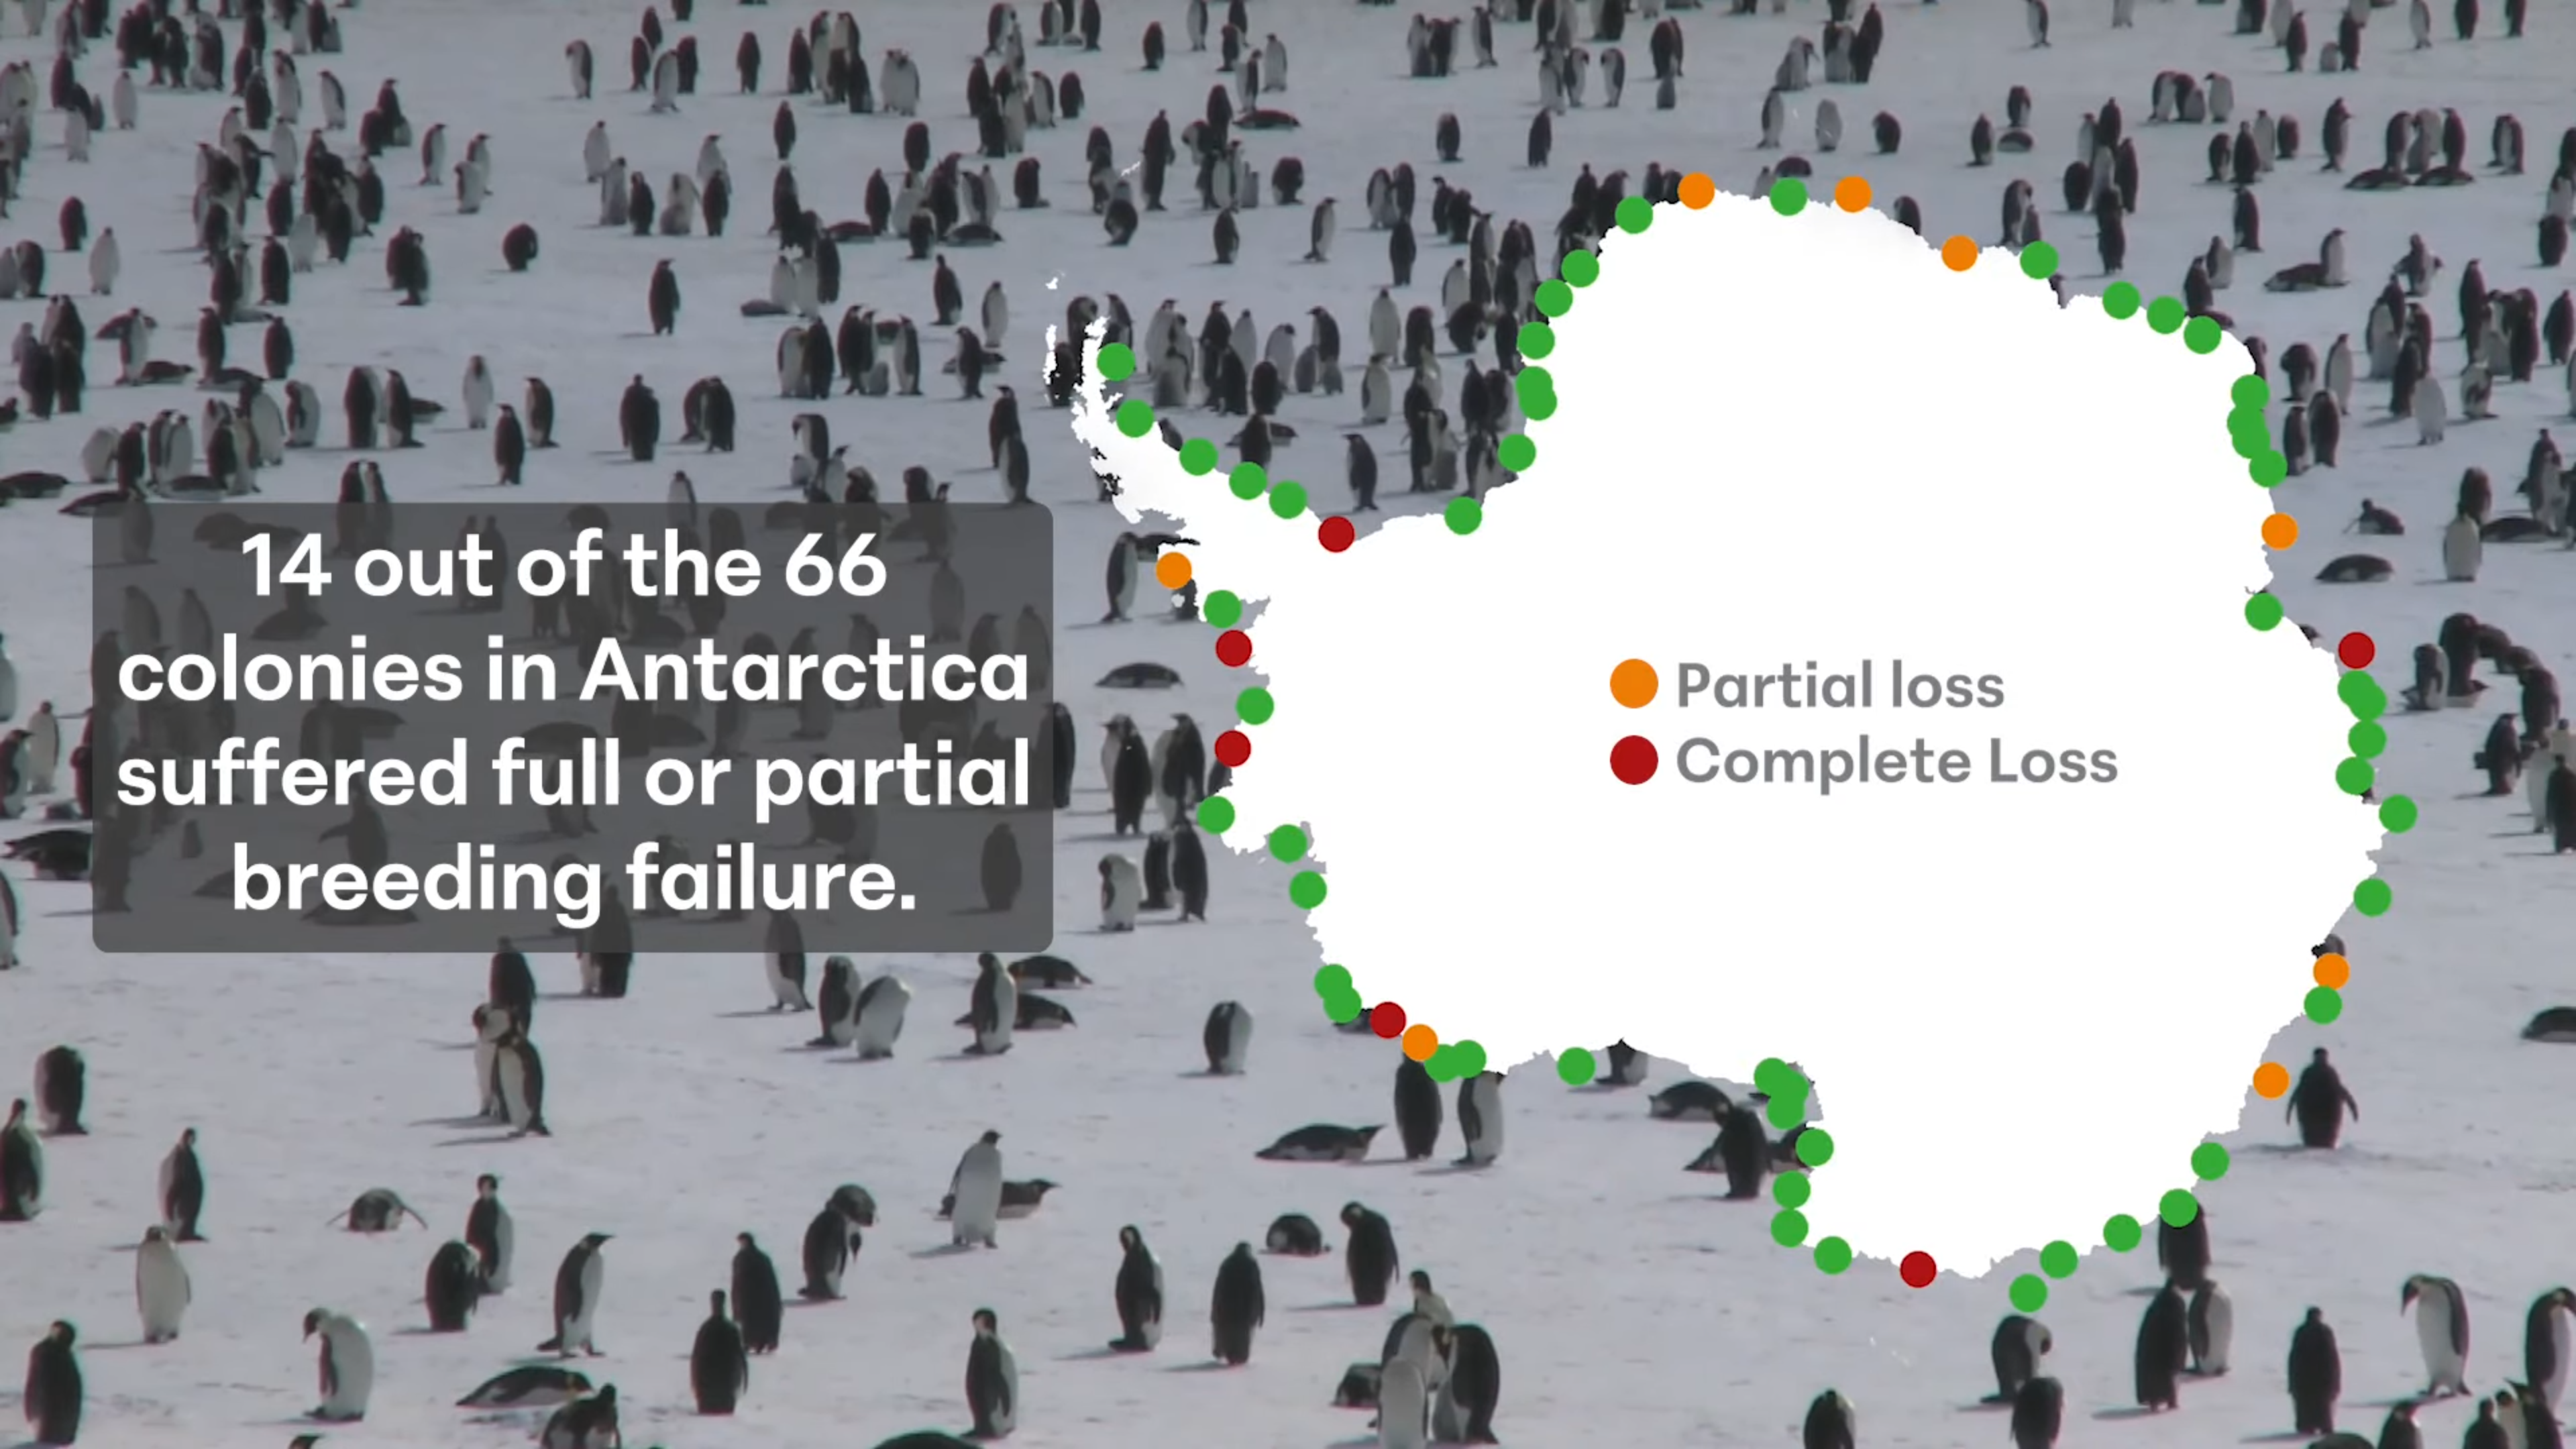
By Gloria Dickie 25 April 2024 LONDON (Reuters) – Record low sea ice in late 2023 led to breeding failures in one-fifth of Antarctica’s emperor penguin colonies, scientists with the British Antarctic Survey said on Thursday. Emperors – the world’s largest penguin species and one of only two endemic to Antarctica — depend on sea […]
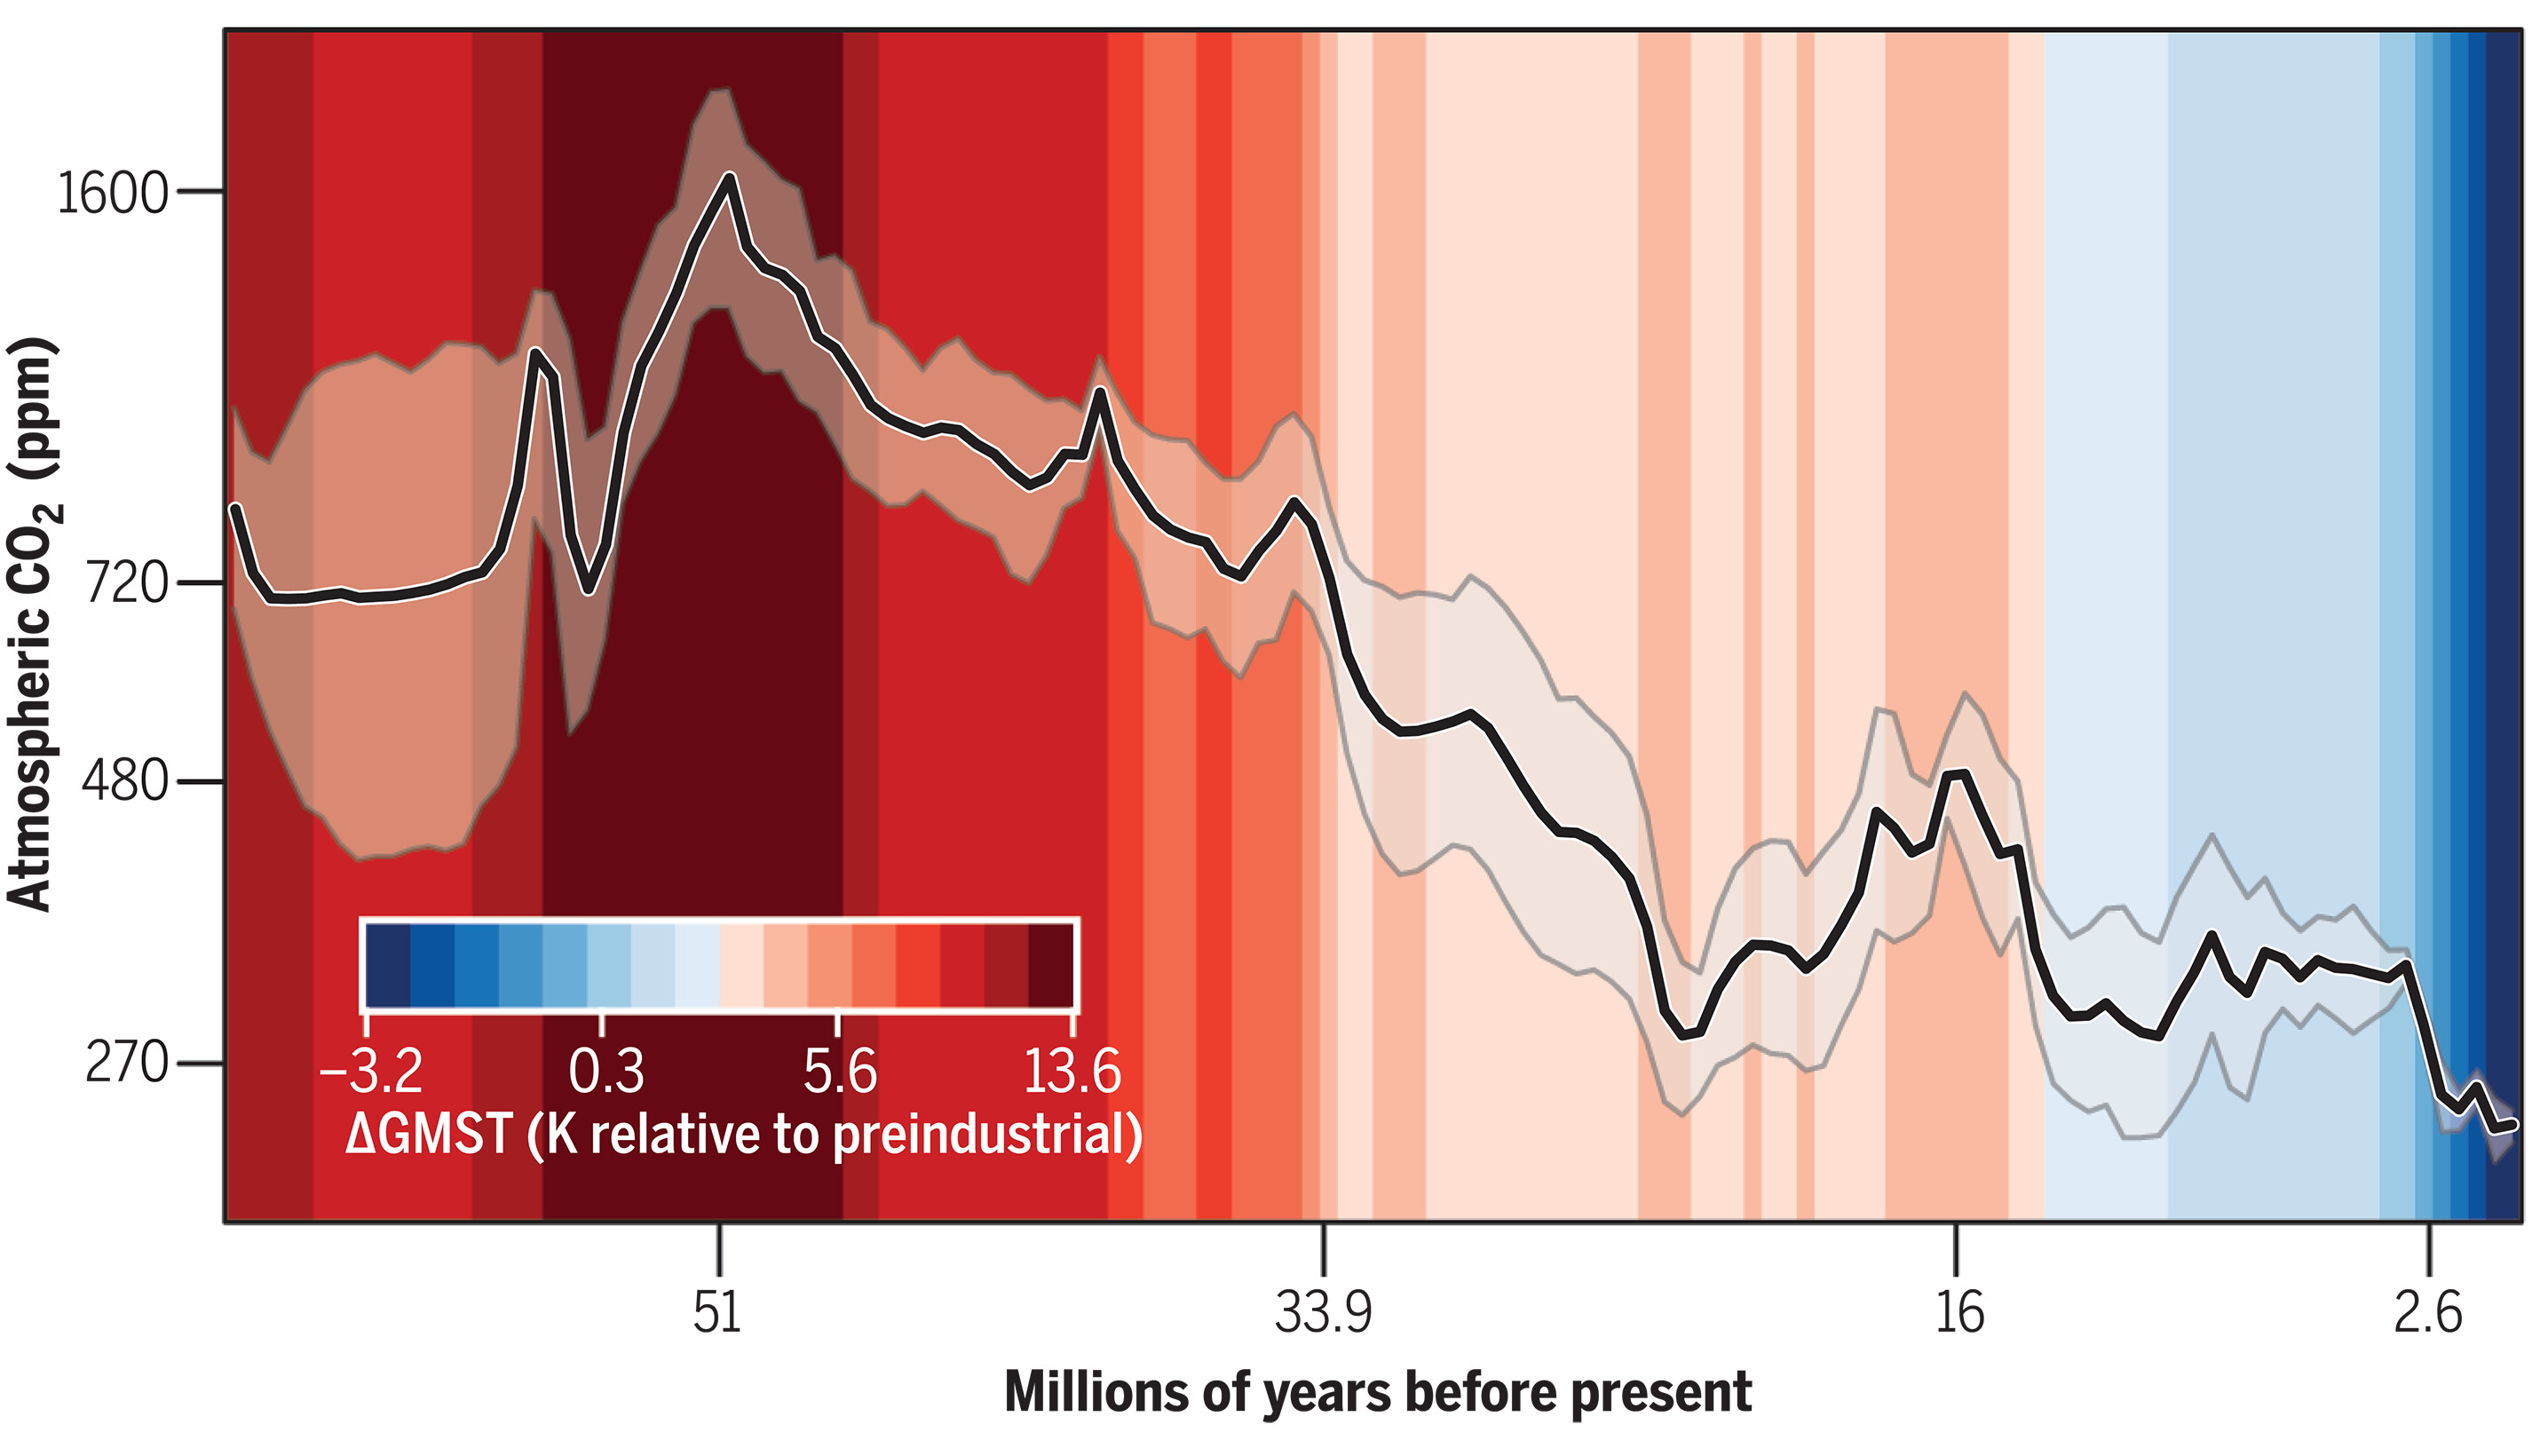
By Kevin Krajick 7 December 2023 (Columbia Climate School) – A massive new review of ancient atmospheric carbon-dioxide levels and corresponding temperatures lays out a daunting picture of where the Earth’s climate may be headed. The study covers geologic records spanning the past 66 million years, putting present-day concentrations into context with deep time. Among […]
By Zoë Schlanger 10 November 2023 (The Atlantic) – You’d be forgiven for thinking that the fight against climate change is finally going well. The clean-energy revolution is well under way and exceeding expectations. Solar is set to become the cheapest form of energy in most places by 2030, and the remarkable efficiency of heat pumps is driving their own uptake […]
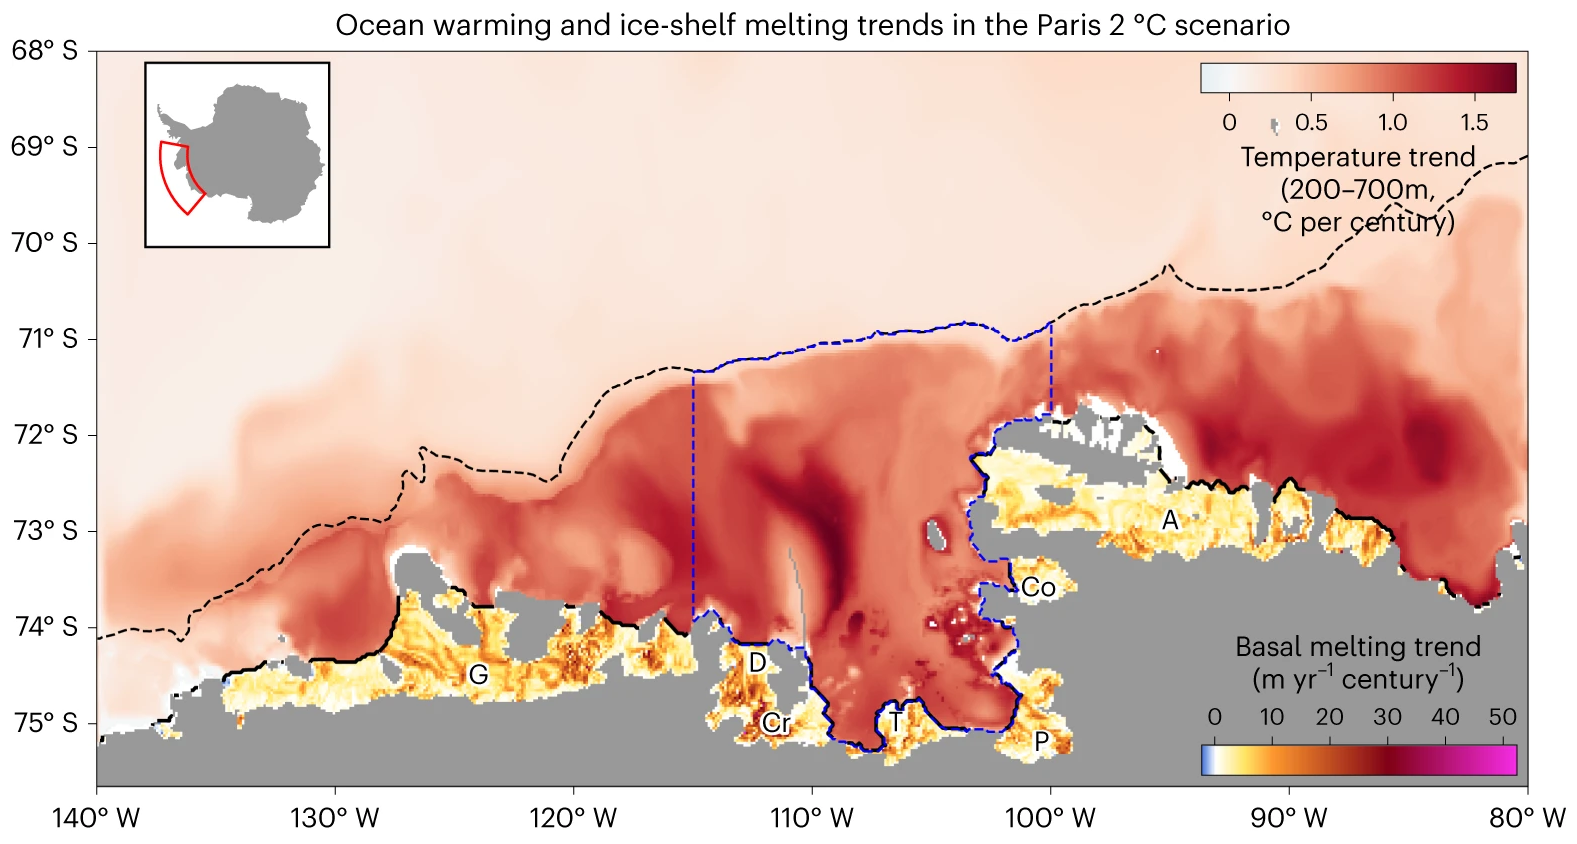
By Elizabeth Rush 13 August 2023 (The Atlantic) – Out on the bow of the R/V Nathaniel B. Palmer, the air is dense and almost warm. We have punched through miles of Antarctic ice floes to reach the Amundsen Sea’s foggy interior. I want to honor the remaining distance between us and Thwaites Glacier’s calving […]
By Lois Parshley 20 July 2023 (The Atlantic) – Ever since some of the earliest projections of climate change were made back in the 1970s, they have been remarkably accurate at predicting the rate at which global temperatures would rise. For decades, climate change has proceeded at roughly the expected pace, says David Armstrong McKay, a […]
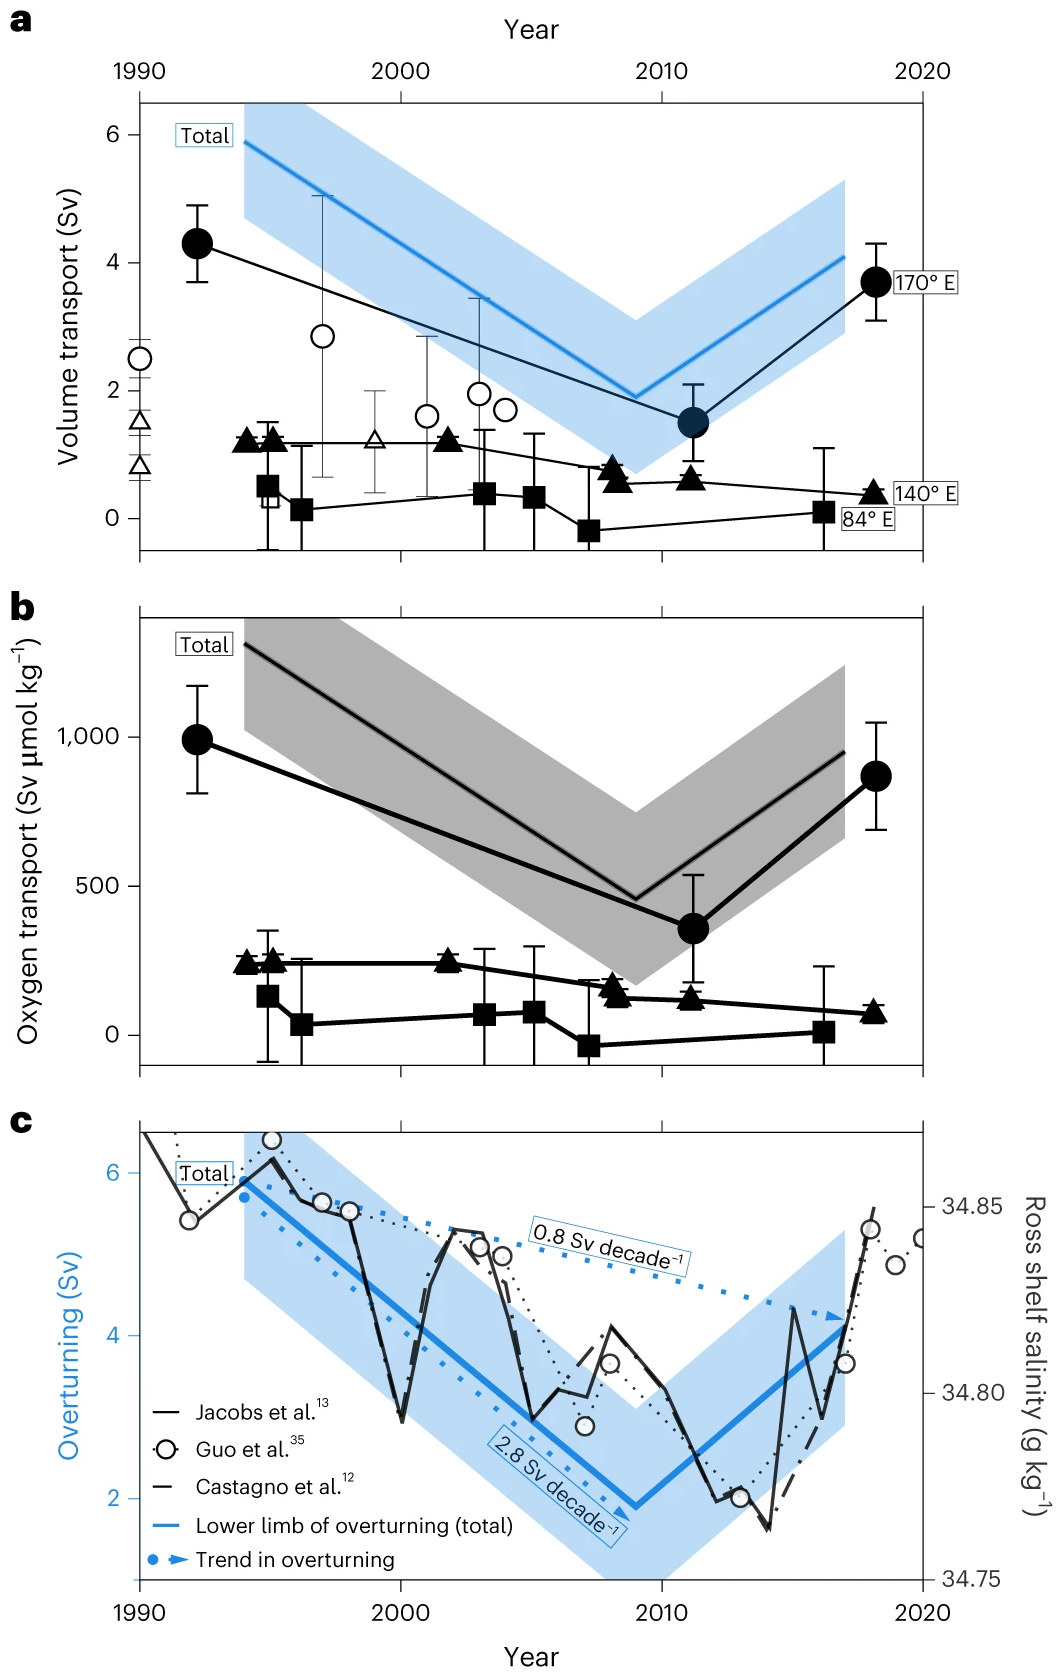
By Kathy Gunn, Matthew England, and Steve Rintoul 25 May 2023 (The Conversation) – Antarctica sets the stage for the world’s greatest waterfall. The action takes place beneath the surface of the ocean. Here, trillions of tonnes of cold, dense, oxygen-rich water cascade off the continental shelf and sink to great depths. This Antarctic “bottom […]
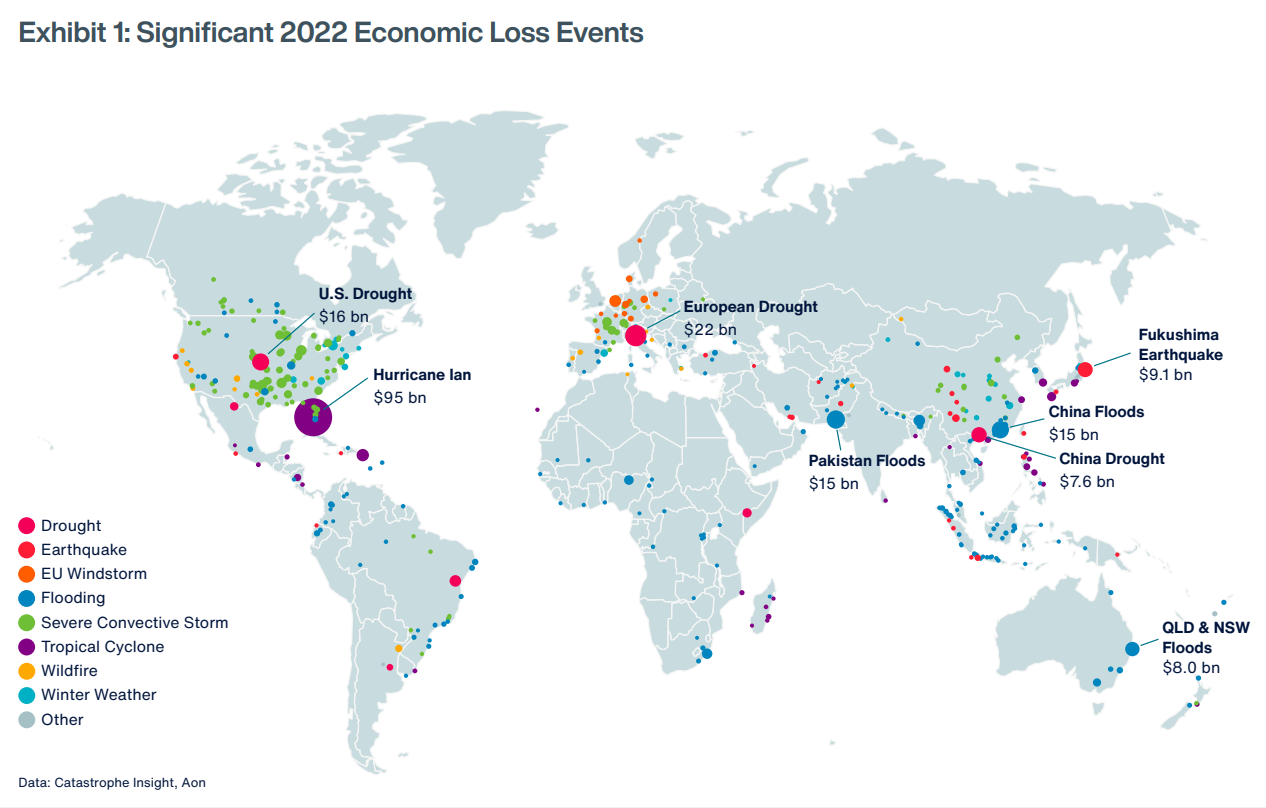
CHICAGO, 25 January 2023 (PRNewswire) – Aon plc (NYSE: AON), a leading global professional services firm, today published its 2023 Weather, Climate and Catastrophe Insight report, which identifies global natural disaster and climate trends to help make better decisions to manage volatility and enhance global resilience. The report reveals that natural disasters caused a $313 billion global economic loss […]
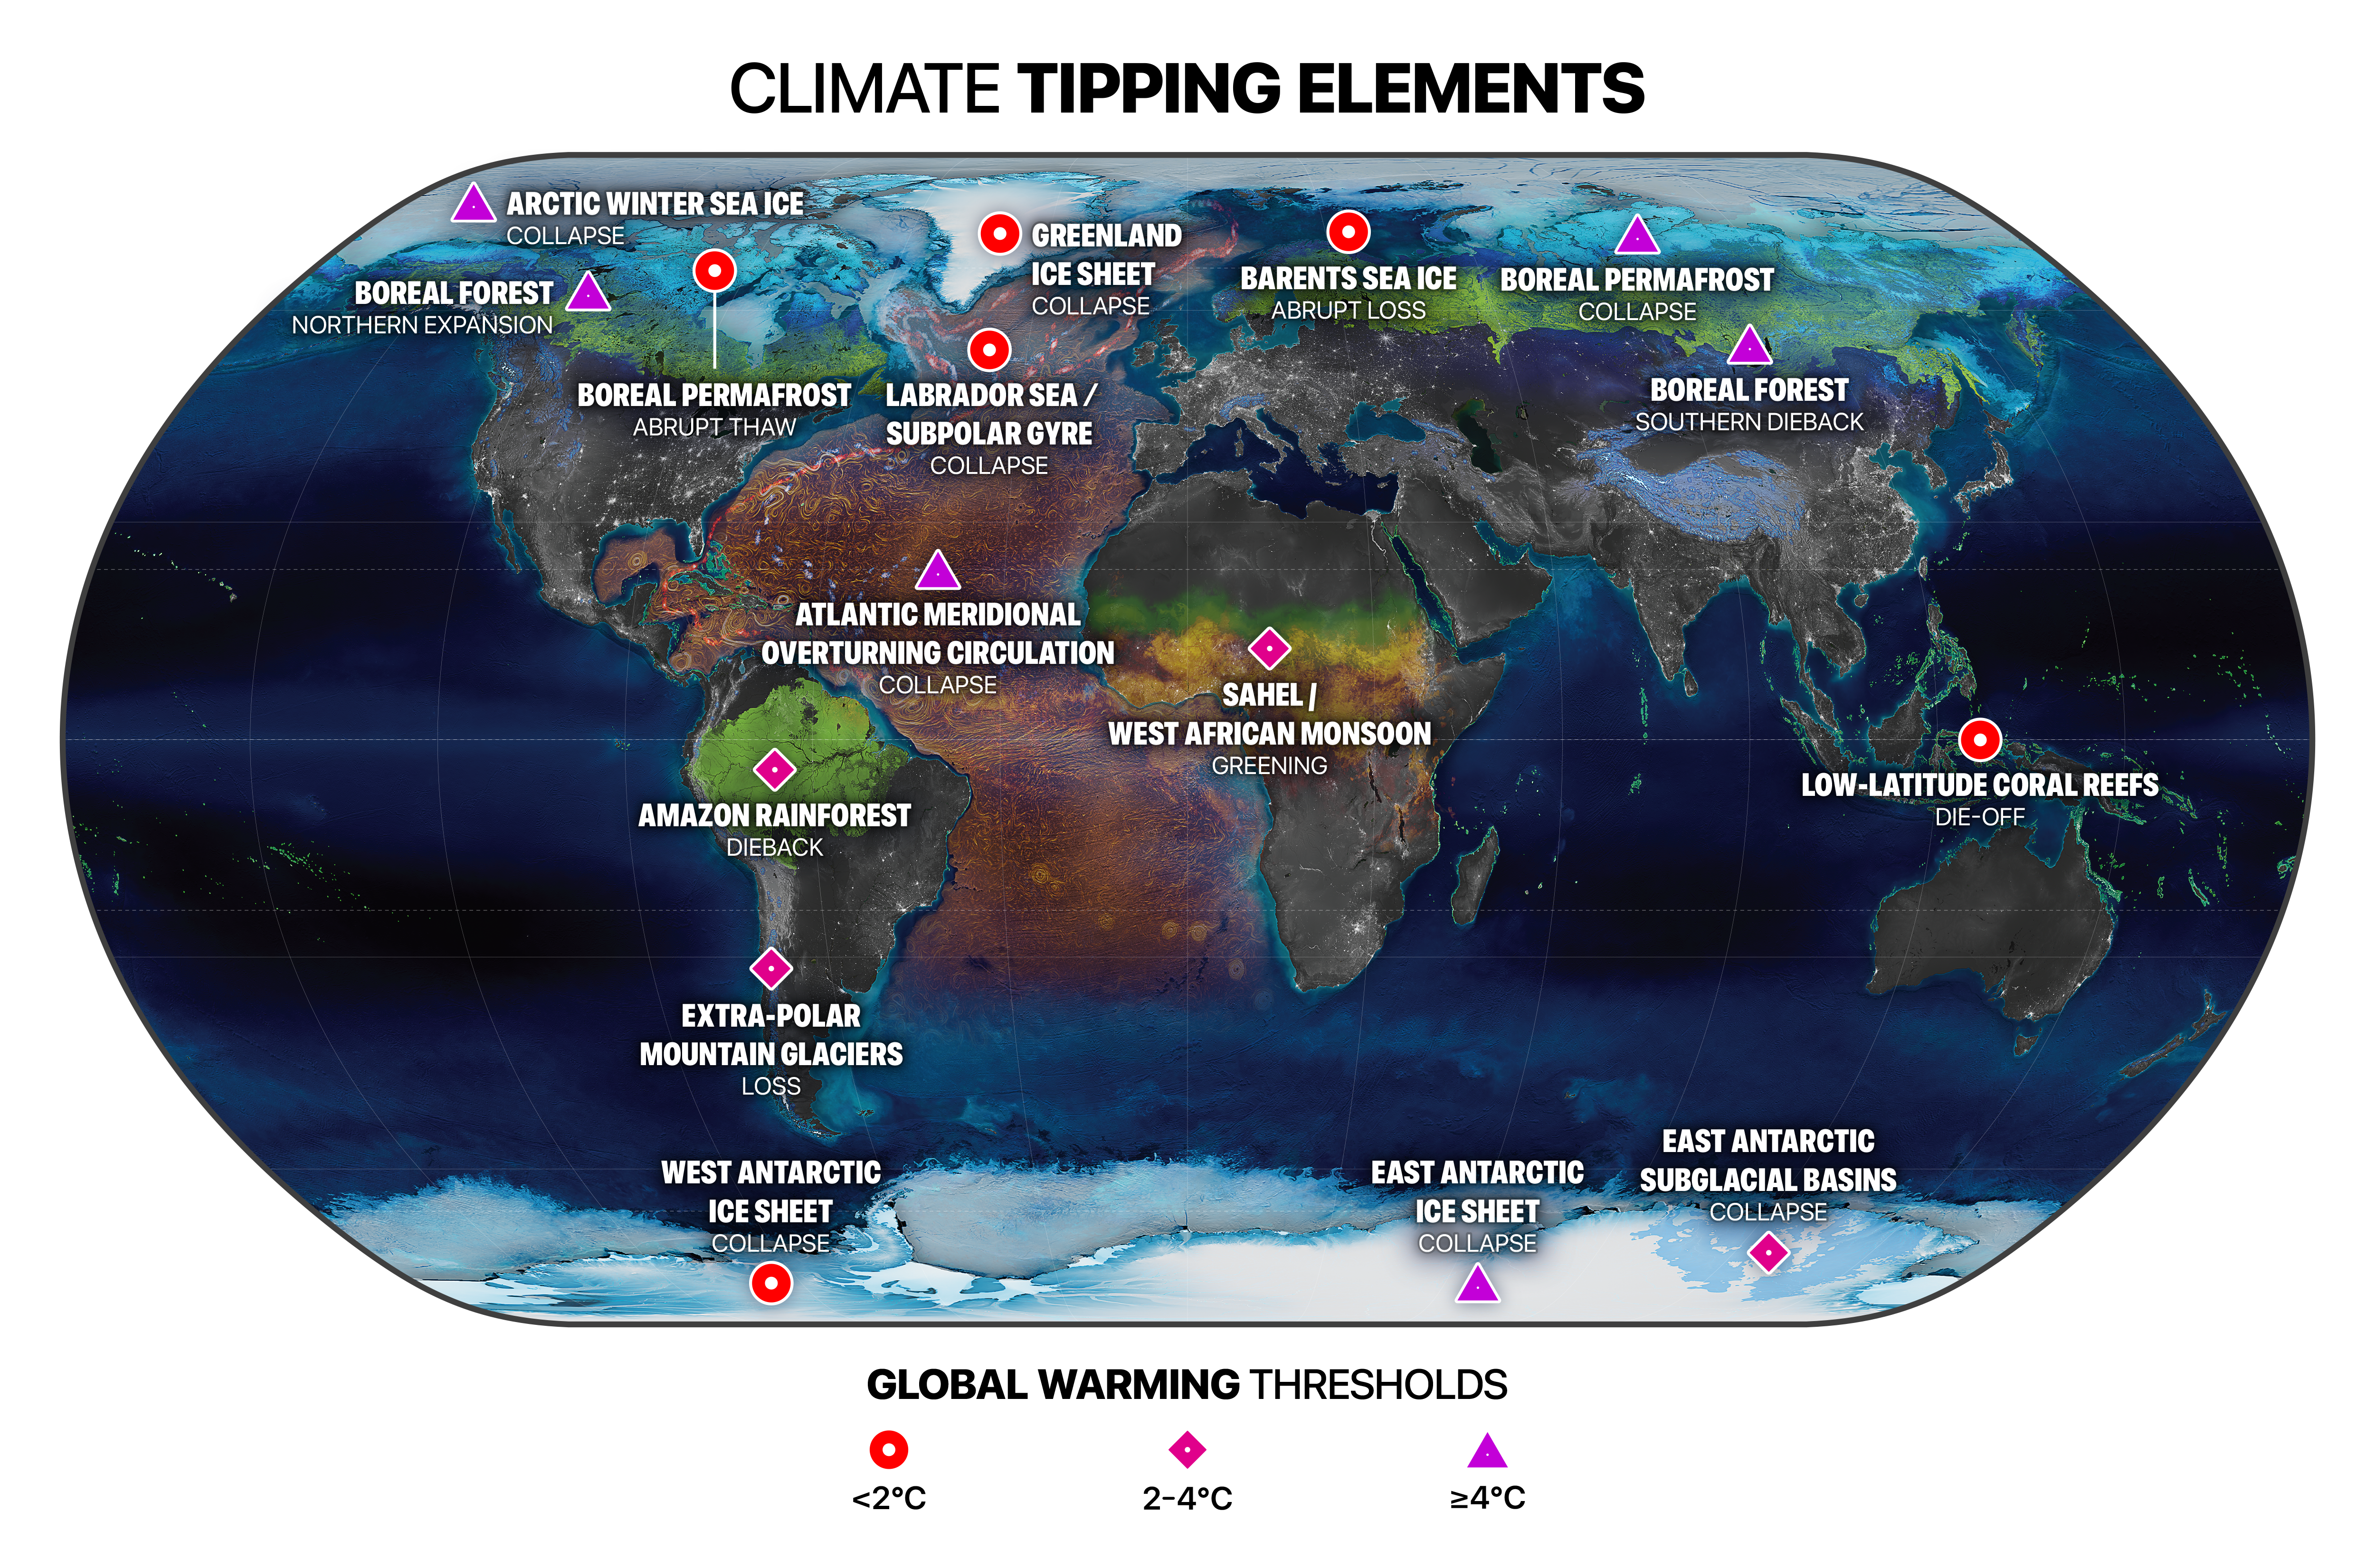
8 September 2022 (Stockholm Resilience Centre) – Multiple climate tipping points could be triggered if global temperature rises beyond 1.5°C above pre-industrial levels, according to a major new analysis published in the journal Science. Even at current levels of global heating the world is already at risk of passing five dangerous climate tipping points, and risks […]