News roundup for 8 August 2022 – Climate impacts have worsened vast range of human diseases – “Forever chemicals” have made rainwater “unsafe to drink” globally
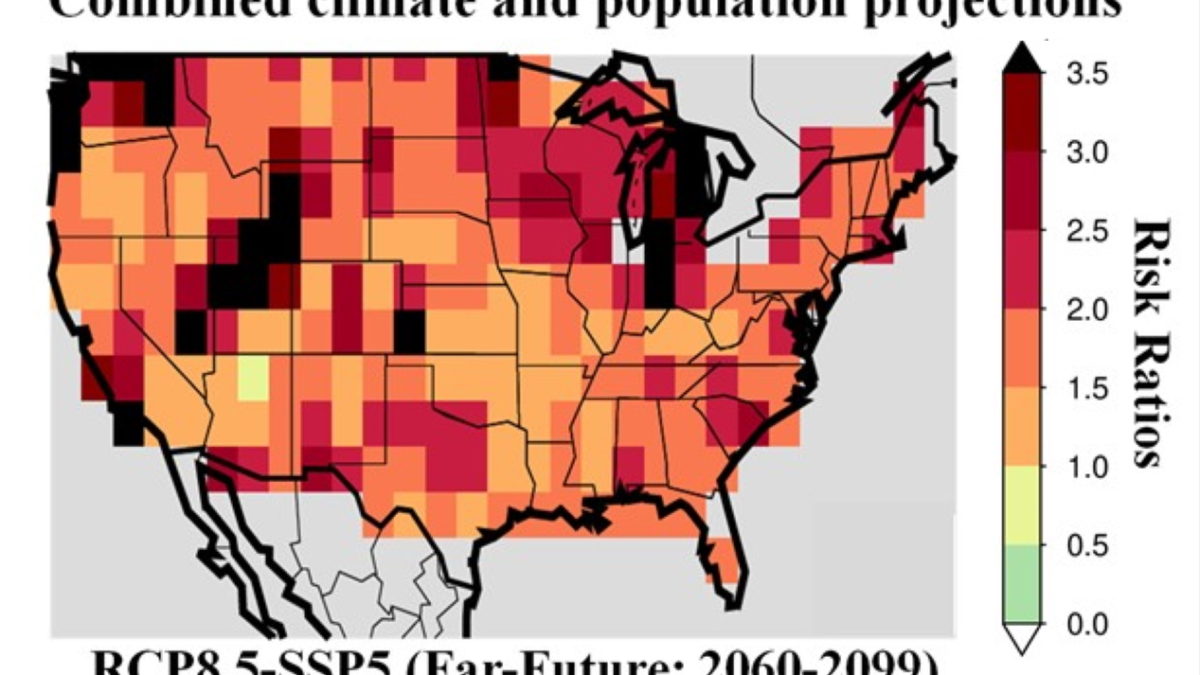
Potential heat stress risk in 2060-2099 due to combined climate and population projections. Graphic: Mukherjee, et al., 2021 / Earth’s Future 7 June 2021 (NSF) – Periods of extremely high heat are projected to double across the lower 48 states...
Spring leaf index anomaly in the continental United States, 1 January 2020 - 7 March 2020. In parts of the Southeast U.S., the arrival of spring in 2020 is the earliest in the 39-year record. Graphic: National Phenology Network By...
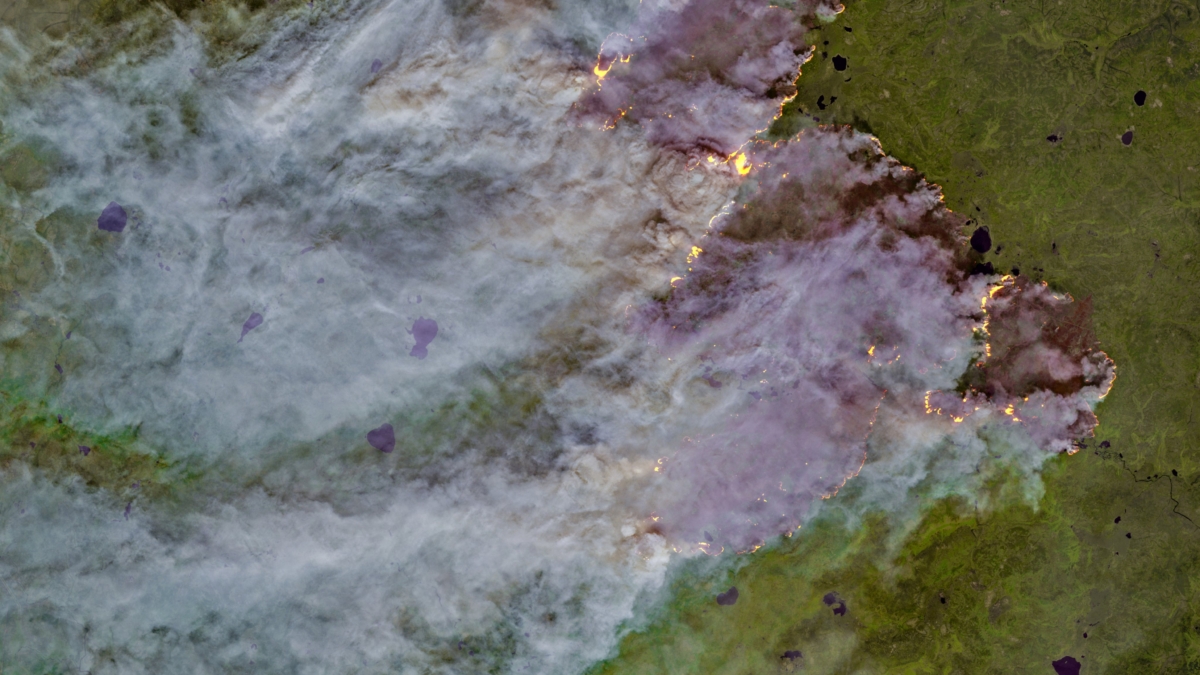
https://youtu.be/0-ePC-Lrydo The Arctic Circle is suffering from an unprecedented number of wildfires in the latest sign of a climate crisis. With some the size of 100,000 football pitches, the World Meteorological Organisation has said these fires emitted as much carbon...