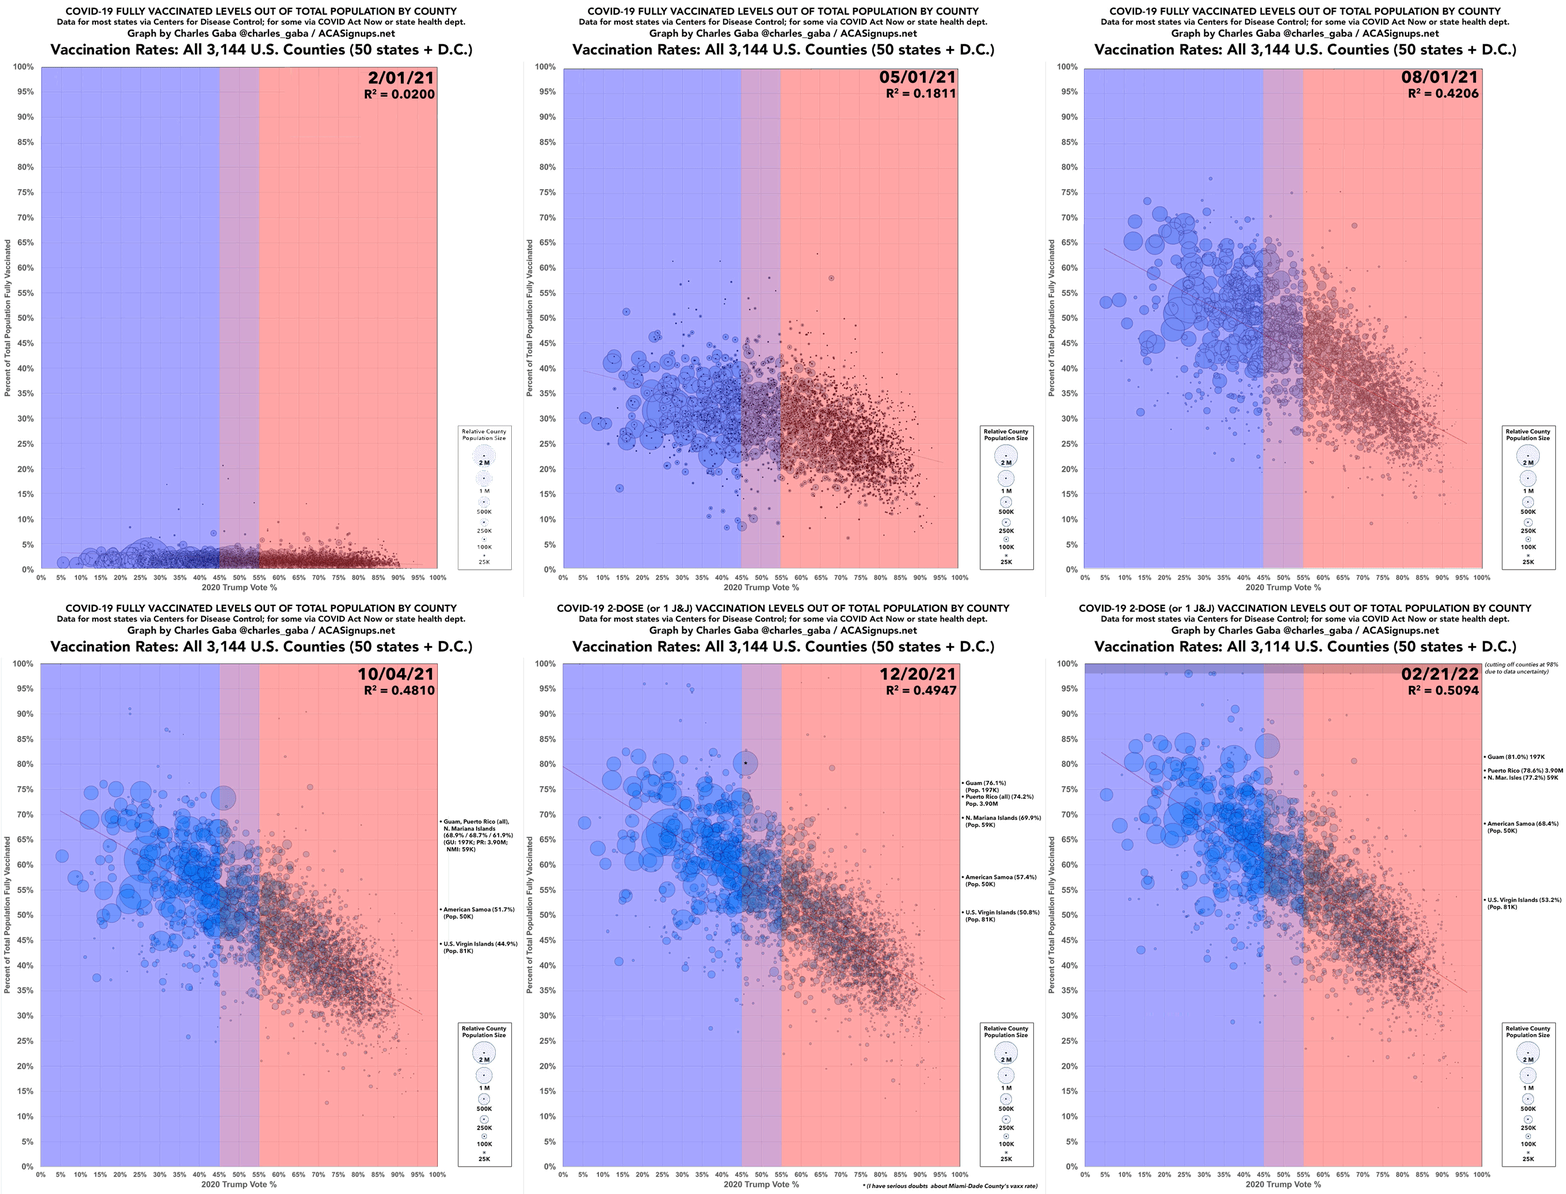
Graph of the Day: U.S. COVID-19 vaccinations by partisan lean, February 2021 – February 2022

By Charles Gaba
22 February 2022
(ACA Signups) – Last summer, I pulled together the occasional vaccination rate scatter plot graphs I’d been compiling for months into a single animated GIF image to show how both the correlation (R^2) and steepness (slope) of the partisan COVID vaccination divide grew from almost nothing at all to a gaping chasm over a six-month period, from February 2021 through August 2021.
Today, I’m presenting an updated version of this animation which not only includes the following six months as well (September 2021 – February 2022), but also cleans up and standardizes the layout of each graph as much as possible. […]
As I’ve been noting for a while now, the most telling thing about this is how there was virtually no partisan gap in the first couple of months (February and March 2021), when only seniors, healthcare workers, and certain immunocompromised and other select groups were eligible to get vaccinated.
Starting in early April 2021, however–at pretty much the exact point that all U.S. adults became eligible for the vaccine–the partisan divide started to ramp up quickly. This was followed in early May by President Biden’s stated goal of at least 70% of all U.S. adults getting their first shot by July 4th.
The red/blue divide increased month after month regardless of other factors (children 12-15 becoming eligible; missing states being added; changing my population data from the U.S. Census Bureau’s 2019 estimates to their official 2020 Census results; etc.) until around September 2021, when it finally tapered off.
It didn’t drop at that point, mind you … it simply flattened out … right up until around Thanksgiving, when 5-11-year-olds began receiving their 2nd Pfizer shots, at which point both the slope and correlation levels started rising again, if only slightly. Sadly, this means that young children of MAGA folks are disproportionately suffering due to their parents’ anti-science zealotry. [more]
Updated: A Full Year Of U.S. COVID Vaccinations By Partisan Lean…Animated


