The summer of 2021 was the Pacific Northwest’s hottest in a millennium – “The tree scorch was shocking. The average summer temperatures were extraordinarily away from the norm.”
By Sid Perkins
14 April 2023
(Science News) – A two-week-long heat wave in the Pacific Northwest in 2021 helped make that summer a record breaker for the region (SN: 7/7/21). Now, tree ring data from the area’s forests reveal that the summer of 2021 was also the region’s hottest of the last millennium.
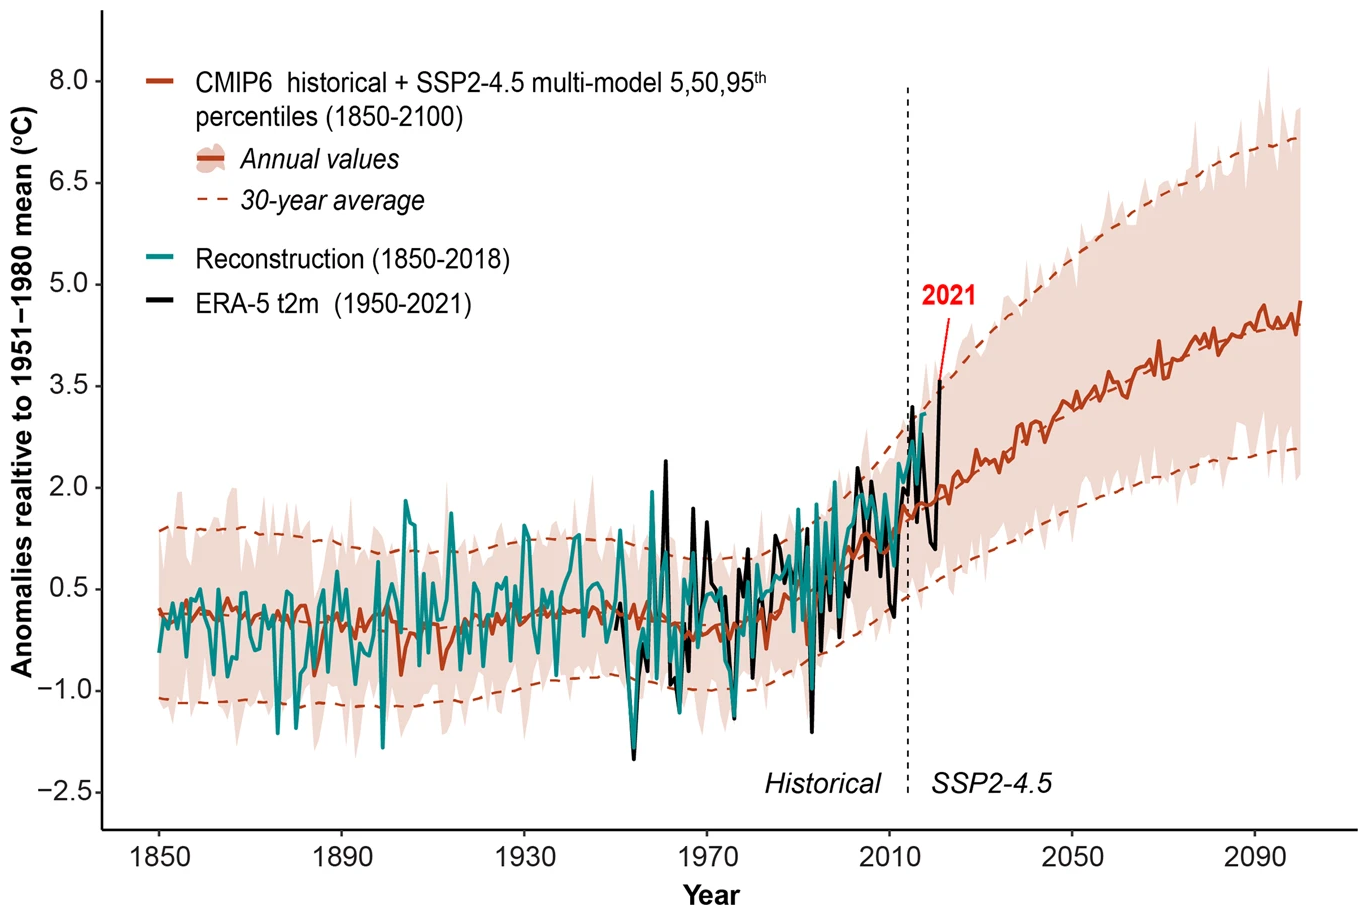
The average temperature for that year’s summer not only shattered the previous record, set in 2015, by 0.4 degrees Celsius. It was also unprecedented since the year 950, researchers reported February 17 in npj Climate and Atmospheric Science.
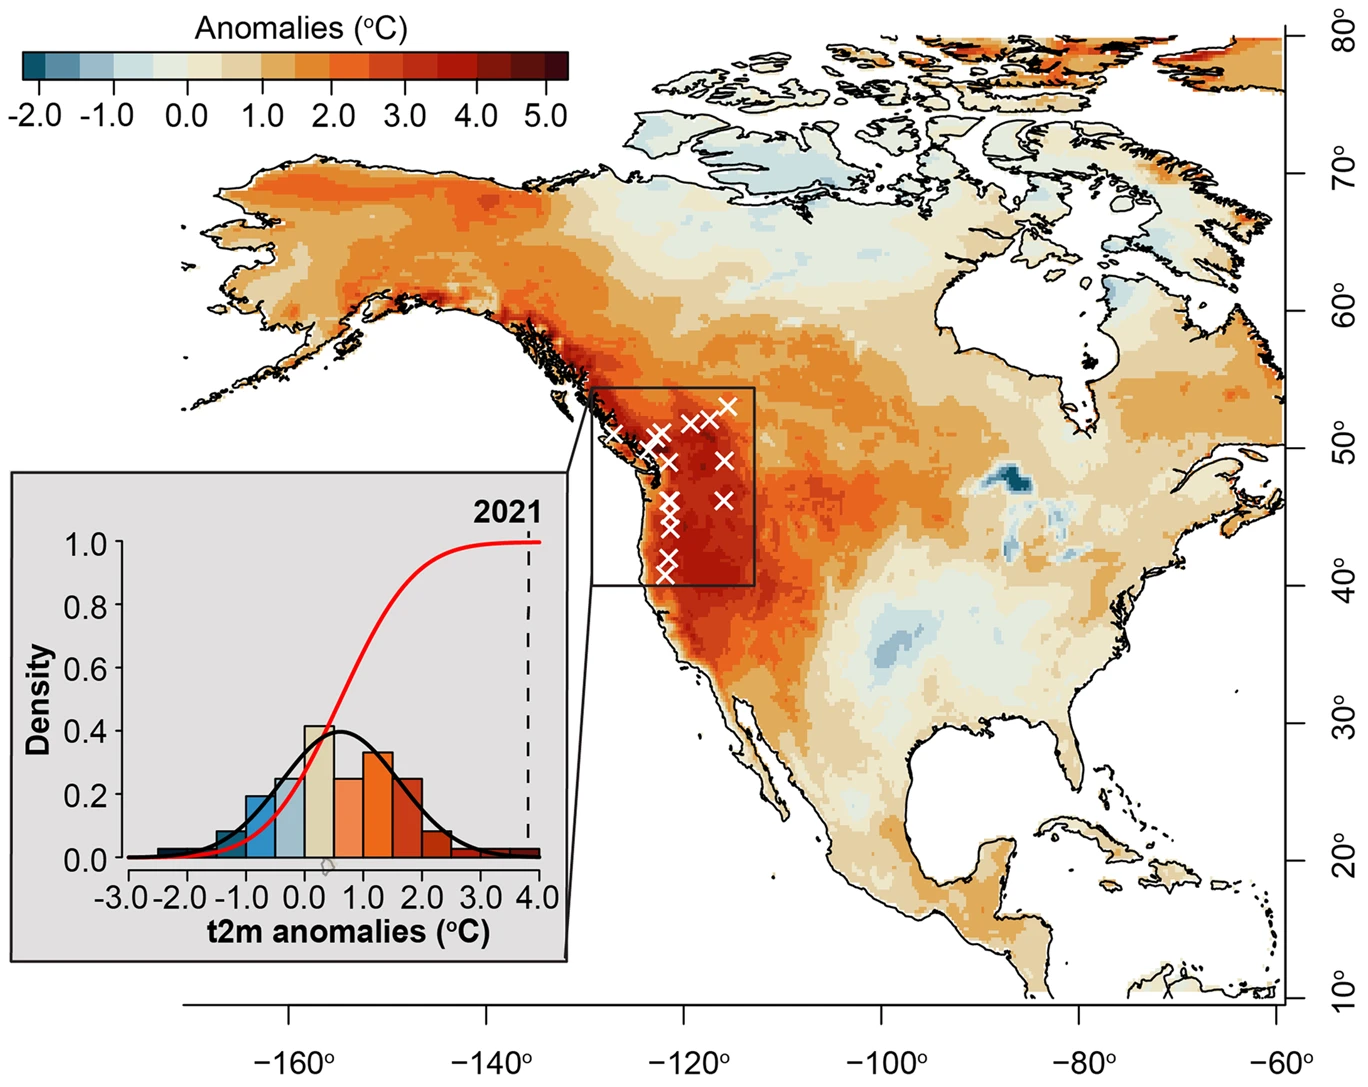
The average temperature in the Pacific Northwest from June through August was a whopping 3.6 degrees warmer than the average summer temperature worldwide for the years 1951 through 1980. That global value, 15.2 °C, is a common benchmark used for comparison.
Based on modern meteorological records for the area, the scientists also found that such an extremely high average temperature has only a 1-in-25,000 chance of occurring in any one particular year.
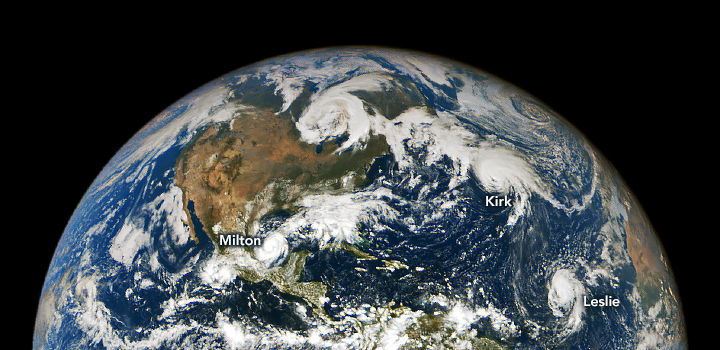
Starting in late June 2021, daytime temperatures at some spots in the Pacific Northwest reached nearly 50° C (or about 122° Fahrenheit). The extreme heat caused wildfires to rage and boosted the rates of heat-related deaths in the region, says Karen Heeter, a dendrochronologist at Columbia University’s Lamont-Doherty Earth Observatory in Palisades, N.Y.
To see how the record-setting summer temperatures stacked up against those in years before meteorologists compiled weather data, Heeter and her colleagues looked at tree ring samples collected from dozens of trees at 17 sites in the Pacific Northwest. The core samples were taken from living trees between the early 1990s and 2021. Two of the core samples chronicled temperatures as far back as the year 950, the team found.
The team measured the widths and densities of the portions of tree rings that had formed in summer months. Generally, for conifers in the Pacific Northwest, the warmer the growing season temperature, the wider the tree ring and the denser the wood formed during that period. By statistically blending data from the 17 sites, the team created a year-by-year profile of the entire region’s average summertime temperatures from 950 through 2021.
Evidence of 2021’s record heat in the Pacific Northwest doesn’t come as a surprise to Bryan Black, a dendrochronologist at the University of Arizona in Tucson. As he conducted field work in the area that summer, he noticed that many of the region’s trees showed a notable browning on their southwestern sides, which would have borne the brutal brunt of afternoon sunshine.
“The tree scorch was shocking,” says Black, who was not part of the new study. The average summer temperatures “were extraordinarily away from the norm.”
That anomaly, says Lauren Stachowiak, a geographer at Eastern Washington University in Cheney who studies tree rings and lived in the area at the time, will undoubtedly show up in tree ring samples obtained in future studies.
The summer of 2021 was the Pacific Northwest’s hottest in a millennium
Unprecedented 21st century heat across the Pacific Northwest of North America
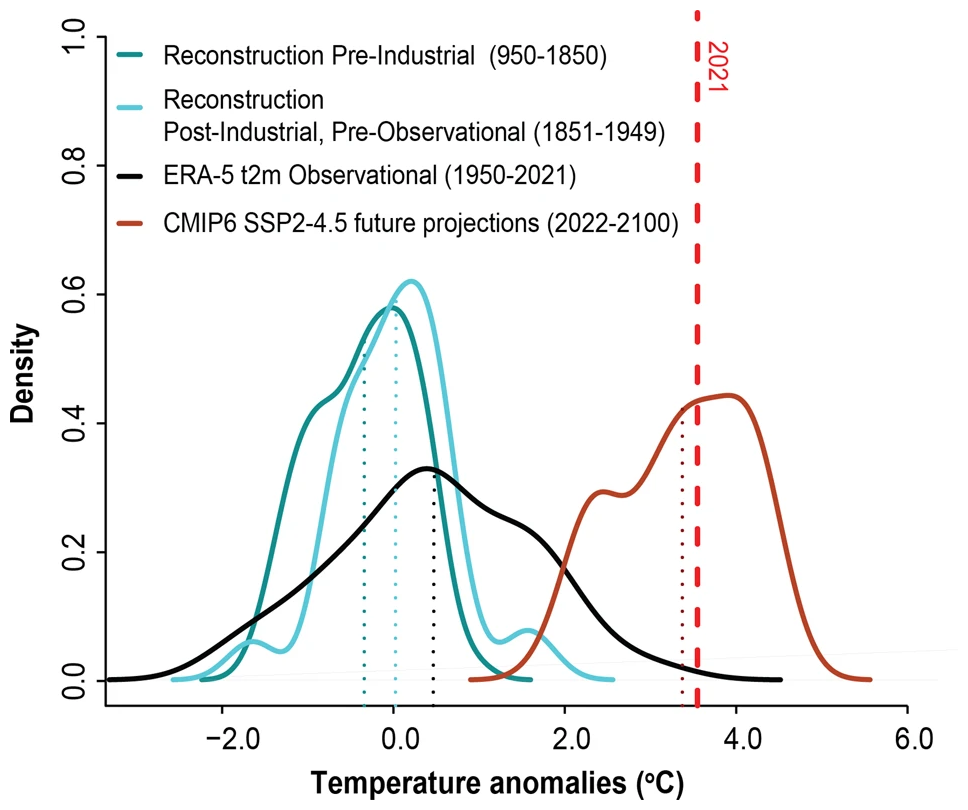
ABSTRACT: Extreme summer temperatures are increasingly common across the Northern Hemisphere and inflict severe socioeconomic and biological consequences. In summer 2021, the Pacific Northwest region of North America (PNW) experienced a 2-week-long extreme heatwave, which contributed to record-breaking summer temperatures. Here, we use tree-ring records to show that summer temperatures in 2021, as well as the rate of summertime warming during the last several decades, are unprecedented within the context of the last millennium for the PNW. In the absence of committed efforts to curtail anthropogenic emissions below intermediate levels (SSP2–4.5), climate model projections indicate a rapidly increasing risk of the PNW regularly experiencing 2021-like extreme summer temperatures, with a 50% chance of yearly occurrence by 2050. The 2021 summer temperatures experienced across the PNW provide a benchmark and impetus for communities in historically temperate climates to account for extreme heat-related impacts in climate change adaptation strategies.
Unprecedented 21st century heat across the Pacific Northwest of North America