Global inequality data update shows rise in concentration of U.S. incomes unseen in other rich nations – Latin America and the Middle East stand as the world’s most unequal regions

10 November 2020 (WIL) – The World Inequality Lab releases today a major update of global inequality data for 173 countries, making up 97% of the world population and 7.5 billion people.
The data published distributes economic growth within each country making it possible to track inequality and poverty over time, countries and regions. These results are based on the Distributional National Accounts methodology developed by the World Inequality Lab and its international network of researchers, in collaboration with the United Nations.
What’s new in the World Inequality Database?
The World Inequality Database incorporated new estimates for almost 50 additional countries, bringing the total to 173 nations covered. Our global inequality data also covers a more extended period of time, as well as, for each country income estimates for the entire distribution, from the poorest 1% to the richest 0.001%. The data goes up to late 2019, giving a precise picture of the state of global inequality right before the pandemic.
>> Click here to access the regional and global inequality data
General overview of inequality worldwide
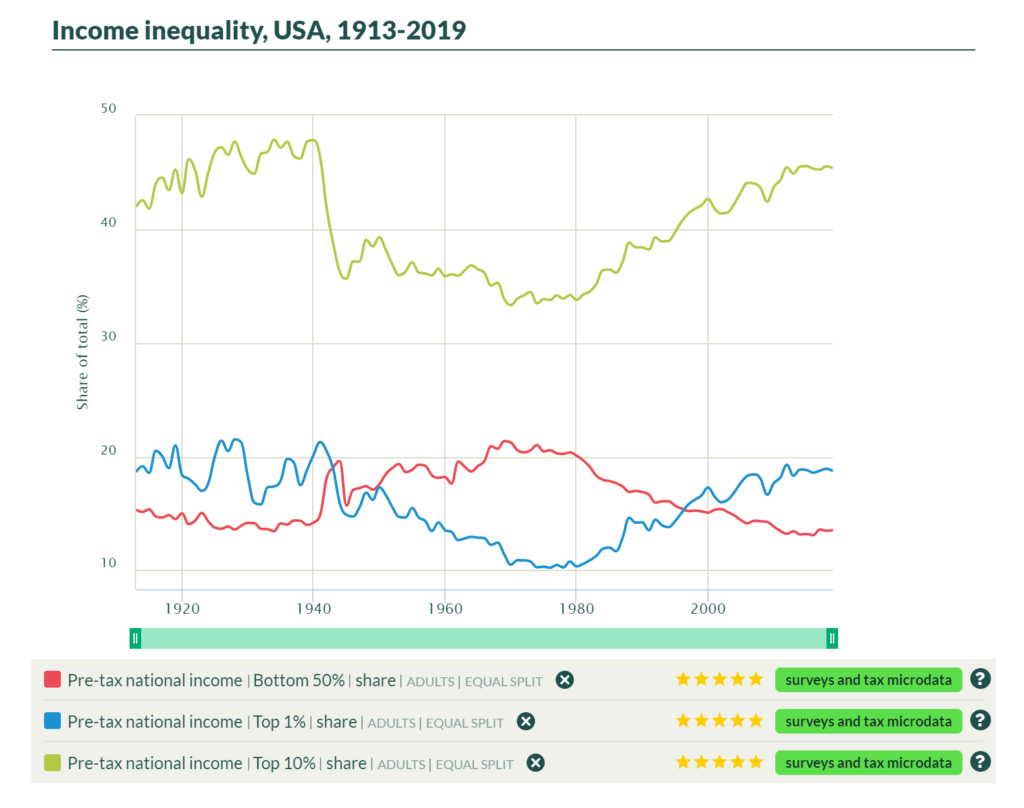
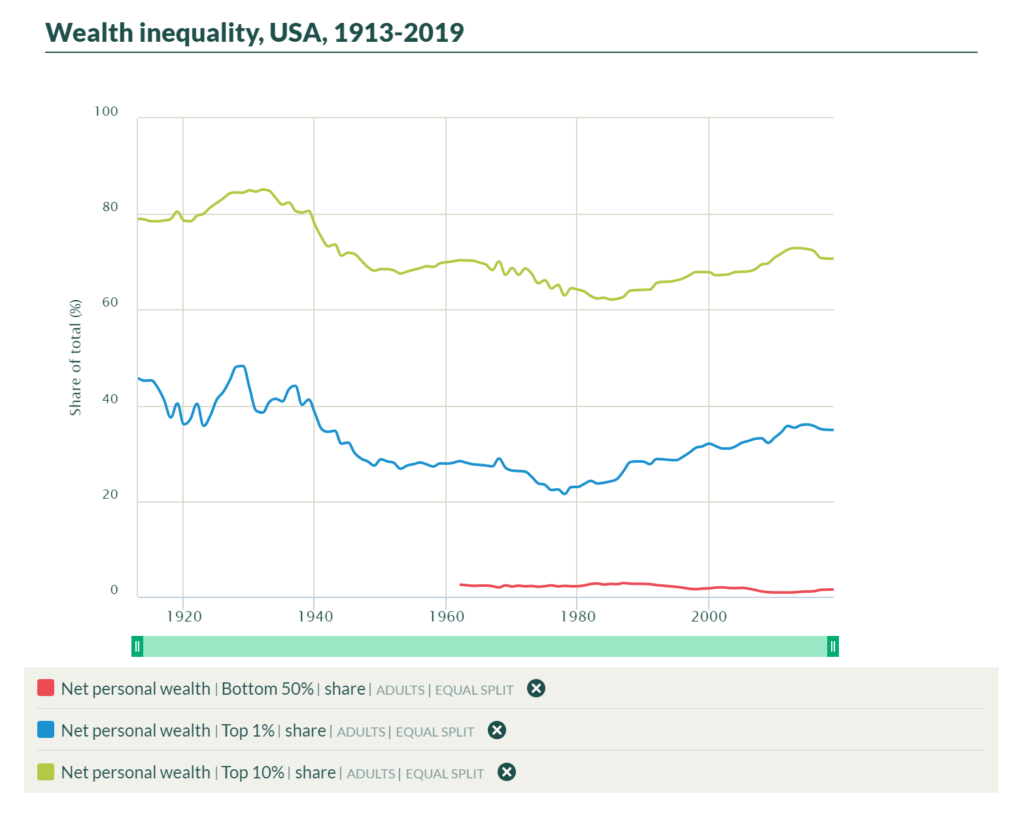
- The US shows a rise in the concentration of incomes unseen in other rich nations. The top 10% increase from 34% to 45% between 1980 and 2019. Half of the American population was shut from pretax economic growth.
- Latin America and the Middle East stand as the world’s most unequal regions, with the top 10% of the income distribution capturing respectively 54% and 56% of the average national income. In Latin America, amidst a decline of inequality levels in a handful of countries, inequality persisted, and even increased, in some others. In the Middle East, Gulf countries (Bahrain, Kuwait, Oman, Qatar, UAE, Saudi Arabia) have been marked extreme inequality levels with little variation since the 1990s.
- Africa comes next as one of the world’s most unequal regions, with the top 10% capturing half of national income. Contrary to widespread view, there is no equality Africa exceptionalism, its inequality levels are very close to those of Latin America or the Middle East. Extreme inequality levels can be found among nations which historically experienced white settlers’ colonization and extreme forms of racial injustices (e.g. South Africa). The persistence of inequality in such countries is largely due to the lack of land ownership reforms, the absence of social security and progressive taxation systems.
- In Russia in 2019, the top 10% captured 46% of the national income, more than twice the share of the bottom 50%. Russia is a country which experienced after the fall of the Soviet Union, one of the fastest increase in inequality. Its top 10% income share doubled in a few years after 1988 and it stands today at 46%. Lack of financial transparency, progressive taxation and a highly deregulated economy maintain current inequality rates at such high levels.
- In Asia, within-country inequality has been rising significantly since the 1990s. In India, the top 10% income share grew from 30% in the 1980s to over 56% today, following deregulation and liberalization reforms. In contrast, the top 10% share in China grew from 28% to 41% in 2019. The lower rise of inequality in China was associated with stronger growth rates and much faster poverty eradication than in India, showing that more economic growth need not necessarily mean increased inequality.
- Europe stands as the most equal of all regions, with the top 10% receiving 35% of income in 2019. This can be largely explained by public investments in education and health (i.e. by predistribution policies), financed by a fair amount of taxes (redistribution mechanisms).
- Global inequality data shows that rising inequality is not a fatality and that countries with strong investments in public services and welfare policies have the lowest inequality levels. Tackling inequality is a matter of political choice.

While countries are still reluctant to publish transparent and high-quality fiscal and administrative data, the impact of high inequality levels on the countries’ political stability has resurfaced as a critical issue in several regions: Middle East uprisings, France’s Yellow Vests movement, 2019 protests in Chile, etc. Similarly, the countries most affected by the Covid-19 pandemic were mostly those that display high and rising levels of inequality. For countries to best address this issue, governments’ commitment to the publication of transparent inequality data and their ability to measure the evolution of inequality per country accurately is crucial. The WIL’s 2020 global income inequality data update wishes to address the lack of governments’ transparency by making a significant contribution to the expansion and improvement of the available data. [more]


One Response
Comments are closed.