Dangerous humid heat extremes occurring decades earlier than expected – “We are already locked in to large increases in the frequency and intensity of extreme humid heat events, and the risk is much larger than most people appreciate”

8 May 2020 (NOAA) – Oppressively hot summer days often evoke the expression, “it’s not the heat, it’s the humidity.” That sticky, tropical-like air combined with high temperatures is more than unpleasant — it makes extreme heat a greater health risk.
Climate models project that combinations of heat and humidity could reach deadly thresholds for anyone spending several hours outdoors by the end of the 21st century. However, new research says these extremes are already happening — decades before anticipated — due to global warming to date.
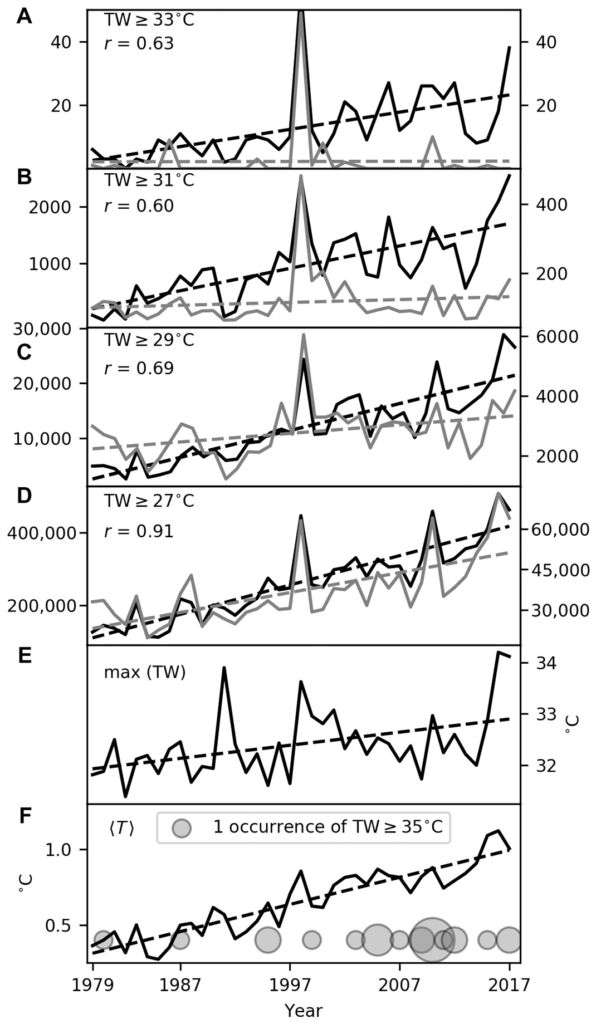
The study, “The emergence of heat and humidity too severe for human tolerance,” published today in Science Advances shows for the first time that some locations have already reported combined heat and humidity extremes above humans’ survivability limit. Dangerous extremes only a few degrees below this limit have occurred thousands of times globally — including in parts of the southwestern and southeastern United States — and have more than doubled in frequency since 1979.
“I believe that humid heat is the most underestimated direct, local risk of climate change,” said Radley Horton, a Columbia University professor and lead of NOAA’s Urban Northeast RISA team who co-authored the study. “As with sea level rise and coastal flooding, we are already locked into large increases in the frequency and intensity of extreme humid heat events, and the risk is much larger than most people appreciate.”
High humid heat defeats the body’s cooling system
The researchers conducted the most rigorous analysis yet using an index called “wet-bulb temperature” based on weather station temperature and humidity data. Wet-bulb temperature, the reading from a thermometer when covered in a wet cloth, is related to how muggy it feels and represents how effectively a person sheds heat by sweating.
Sweating alone does nothing to cool the body unless the water evaporates. Around a wet-bulb temperature of 95°F (35°C), human’s survivability limit, evaporation of sweat is no longer enough for our bodies to regulate their internal temperature. But serious impacts occur at values as low as 79°F (26°C).
“When wet-bulb temperatures are extremely high, there is so much moisture in the air that sweating becomes ineffective at removing the body’s excess heat, like what happens in a steam room,” said Colin Raymond, the study’s lead author who conducted work at Columbia University and is now a postdoctoral scientist at NASA’s Jet Propulsion Laboratory. “At some point, perhaps after six or more hours, this will lead to organ failure and death in the absence of access to artificial cooling.”
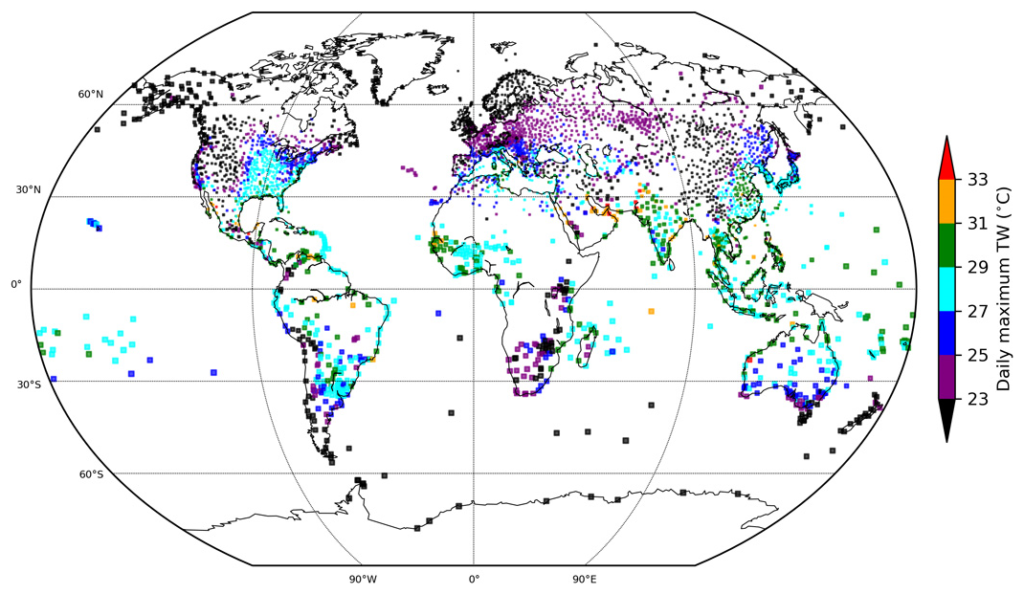
The authors’ survey of weather station data from 1979-2017 identified over 7,000 past occurrences of wet-bulb temperatures above 88°F (31°C) and over 250 above 91°F (33°C) around the world, as well as two stations that reported multiple daily-maximum wet-bulb temperatures above 95°F. These extremes occurred for 1-2 hours in parts of coastal southwest North America, including southeastern California and southwestern Arizona, South Asia, and the coastal Middle East.
The southeastern United States, especially along the Gulf of Mexico, had multiple incidences of wet-bulb temperatures at or above 88°F; specifically, in east Texas, Louisiana, Mississippi, Alabama, the Florida Panhandle, Arkansas and North Carolina. Parts of India, Pakistan, northwestern Australia, the coast of the Red Sea, and areas along the Gulf of California in Mexico saw even higher extremes.

These hot spots were primarily concentrated in coastal areas near high ocean surface temperatures and intense continental heat — a recipe for extreme humid heat.
“Wet-bulb temperatures above 86°F (30°C) are rare in the U.S. As wet bulb temperatures approach 95°F, even the healthiest people, relaxing in the shade without heavy clothing and with an endless supply of water, cannot prevent themselves from overheating,” Horton said. “Even at lower wet-bulb temperatures, like 79°F (26°C), those with pre-existing health conditions (like respiratory, cardiovascular, and renal disease), the elderly, as well as those performing strenuous outdoor labor and athletic activities, are at a high risk.”
The authors note, for example, that the 2003 European heat wave caused over 50,000 deaths at wet-bulb temperatures close to 79°F. In the United States where air conditioning is more widespread, the 1995 Chicago heat wave reached wet-bulb temperatures of 85°F and killed over 700 people.
Extreme humid heat risk is imminent and increasingly severe
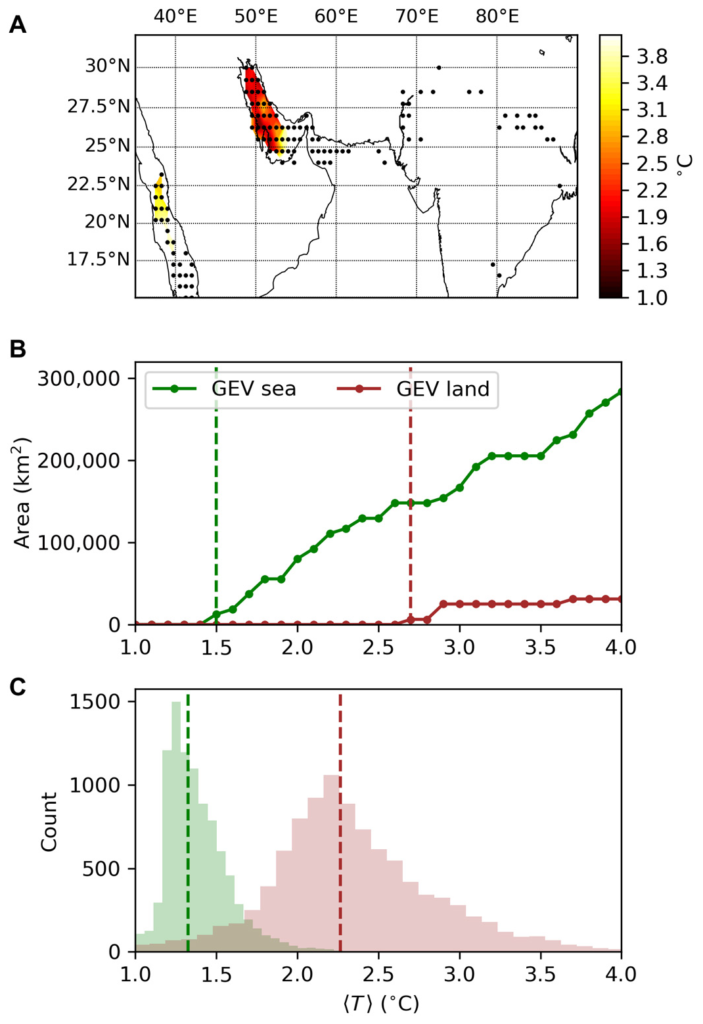
Though the reported extreme exceedances were brief and highly localized, a large number of locations, such as near the Persian Gulf and Red Sea, could surpass the 95°F threshold in just a few decades, much sooner than other studies have suggested, according to the authors. Many populous areas are close to the limit.
Horton believes more research is needed on the factors that generate extreme wet-bulb temperatures in different regions, as well as potential impacts on energy, food systems, and human security.
“The deadly trends in recent decades toward increasingly extreme humid heat underscore a major societal challenge for the coming decades,” Horton said. “Advances in our understanding and appreciation of extreme humid heat risks have the potential to increase the economic productivity and livelihood of Americans and all people, while protecting the health of the most vulnerable.”
The study was supported by NOAA’s Regional Integrated Sciences and Assessments (RISA) Program.
Additional resources
- NOAA RISA Supports Wet Bulb Globe Temperature (WBGT) Tool for NC & VA
- NOAA RISA helps NYC identify neighborhoods at greatest risk from extreme heat
Contact
- Alison Stevens, NOAA Research Communications, at alison.stevens@noaa.gov.
Dangerous humid heat extremes occurring decades before expected

The emergence of heat and humidity too severe for human tolerance
ABSTRACT: Humans’ ability to efficiently shed heat has enabled us to range over every continent, but a wet-bulb temperature (TW) of 35°C marks our upper physiological limit, and much lower values have serious health and productivity impacts. Climate models project the first 35°C TW occurrences by the mid-21st century. However, a comprehensive evaluation of weather station data shows that some coastal subtropical locations have already reported a TW of 35°C and that extreme humid heat overall has more than doubled in frequency since 1979. Recent exceedances of 35°C in global maximum sea surface temperature provide further support for the validity of these dangerously high TW values. We find the most extreme humid heat is highly localized in both space and time and is correspondingly substantially underestimated in reanalysis products. Our findings thus underscore the serious challenge posed by humid heat that is more intense than previously reported and increasingly severe.
The emergence of heat and humidity too severe for human tolerance


One Response
Comments are closed.