Top ten UK’s hottest years all since 2002 – None of the ten coldest years occurred after 1963
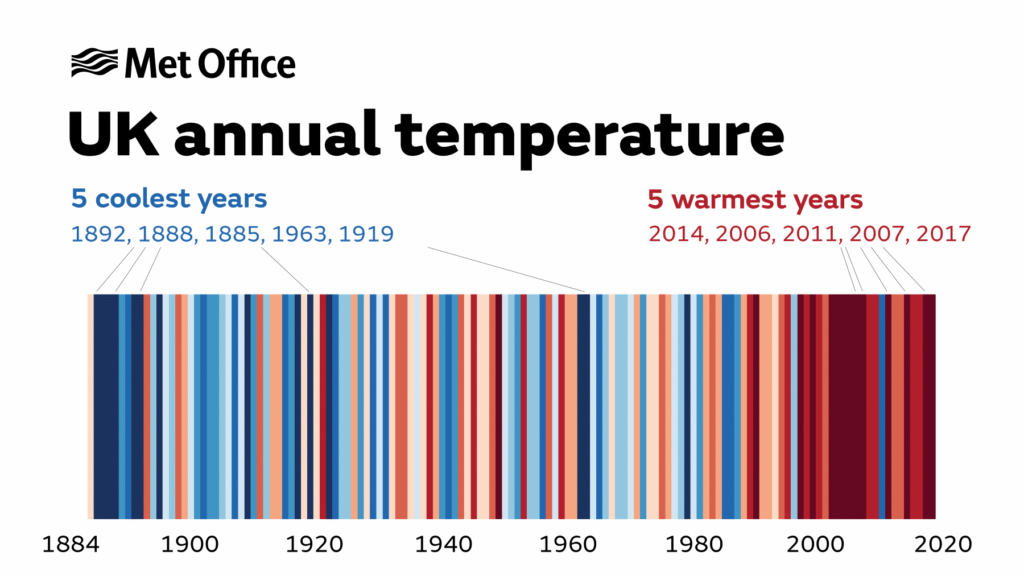
31 July 2019 (Met Office) – An updated analysis of the annual UK temperature records from the Met Office shows that since 1884 all of the UK’s ten warmest years have occurred since 2002; whereas none of the ten coldest years have occurred since 1963.
These figures are further indications of a changing climate, says the Met Office.
In the latest annual State of the UK Climate [pdf] report, the Met Office temperature series for the UK has now been extended by 26 years back to 1884. The data has been added as part of ongoing projects to digitise historic weather records.
Dr Mark McCarthy is the head of the Met Office’s National Climate Information Centre. Commenting on the extension of the temperature series, he said: “Looking back further into the UK’s weather reveals a very interesting timeline with the top ten warmest years at the most recent end, since 2002. Extending the record back by 26 years from 1910 to 1884 didn’t bring in any new warm years, but it did bring in a number of new cold years, including several that are now within the top ten coldest years.
“Notably, 1892 is the coldest year in the series, when the average temperature was just over seven degrees. By contrast 2014, which was the warmest year in the series, saw an average temperature approaching ten degrees Celsius.”
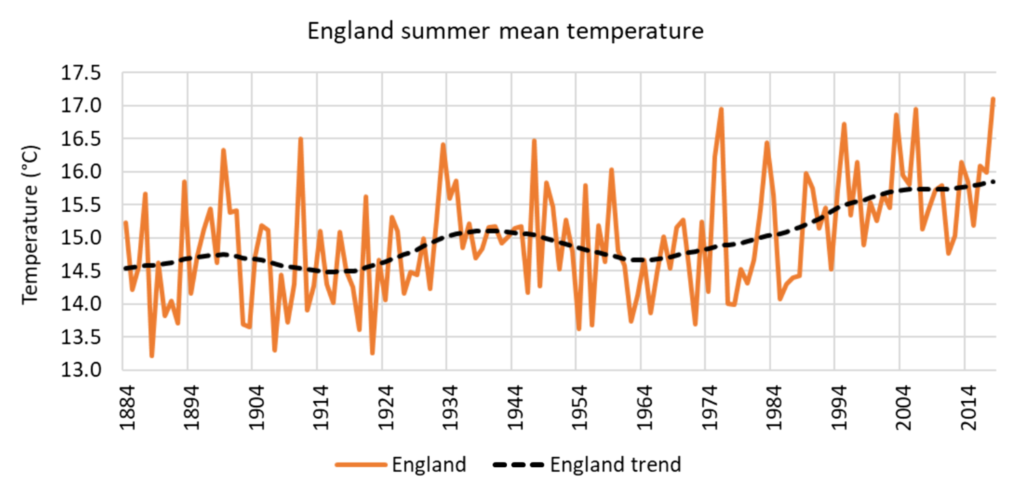
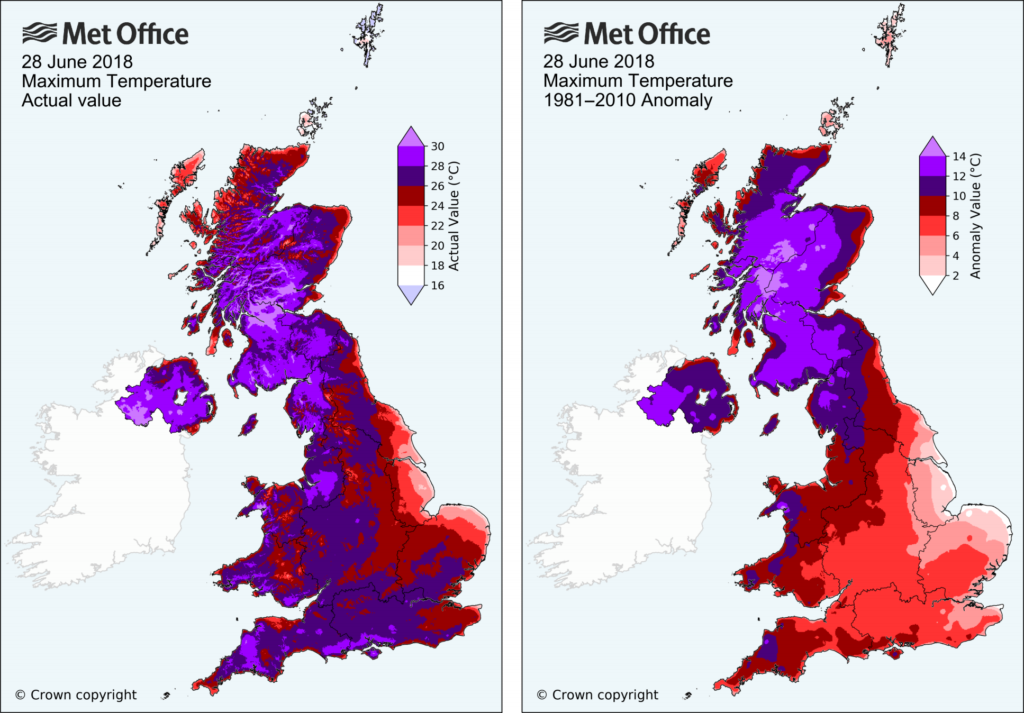
2018 contained some notable weather events, including the summer heatwave and the Beast from the East, when a record low daily maximum temperature was recorded on 1 March 2018. Despite this particular cold snap, 2018 was on balance a warm year and joins the top ten warmest years at number seven. 2018 was the equal-warmest summer for the UK (along with 2006).
Key findings from the State of the UK Climate report:
- 2018 was the third sunniest year in a UK series starting in 1929
- In 2018 the UK received the most significant snowfall since 2010. UK snow events have generally declined since the 1960s
- Over the last decade, summers have been 13% wetter, and winters have been 12% wetter than the period 1961-1990
- Six of the ten wettest years have occurred since 1998 in a UK series stretching back to 1862
- Eight of the ten warmest years for near-coast UK sea-surface temperatures have occurred this century
- Ten named storms affected the UK during 2018
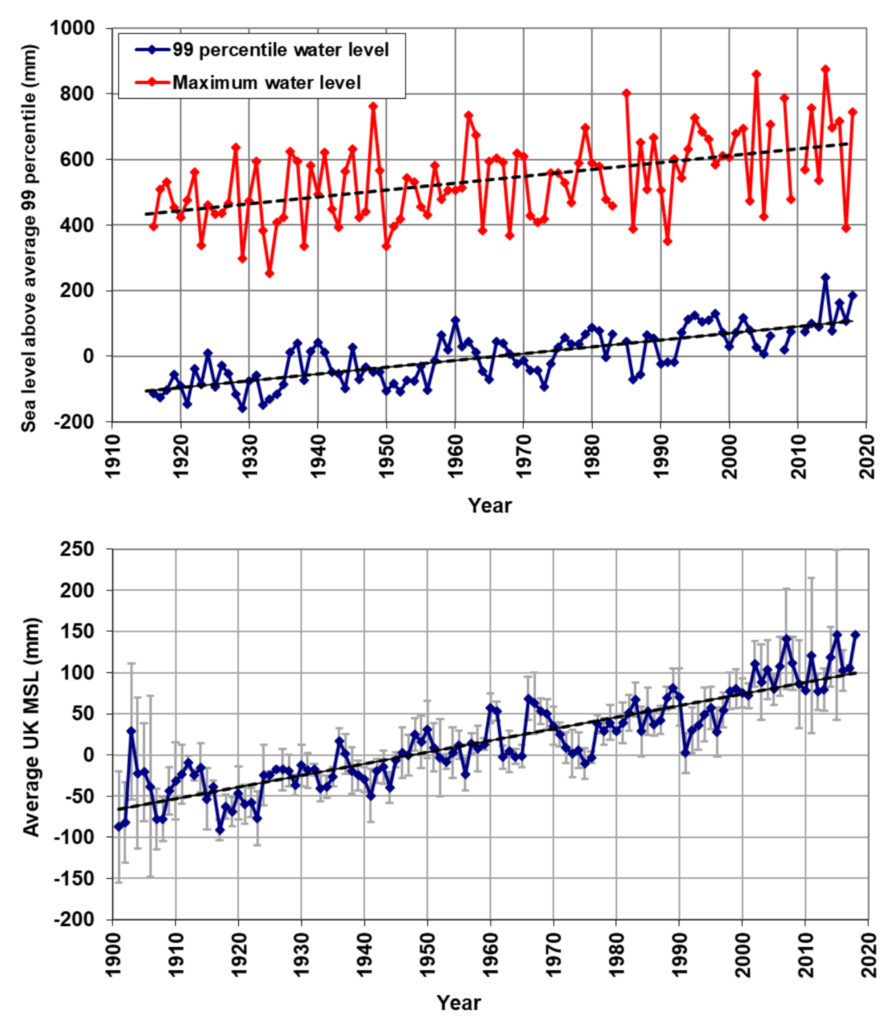
- In 2018, average sea level around the UK was equal highest (with 2015) on record in a series starting in 1901
The State of the UK Climate 2018 report, which is the fifth in a series of annual publications, provides the latest assessment of UK climate trends, variations and extremes. It has been published by Royal Meteorological Society and Wiley in the International Journal of Climatology: a peer-reviewed journal. The dataset on which the report is based makes use of over 100 million historical UK station observations, and is freely available on the CEDA (Centre for Environment Data Analysis) website.
The State of the UK Climate report was supported by the Met Office Hadley Centre Climate Programme, funded by BEIS and Defra.

https://www.themonthly.com.au/issue/2019/august/1566136800/jo-lle-gergis/terrible-truth-climate-change
https://www.sacbee.com/news/politics-government/capitol-alert/article232575652.html