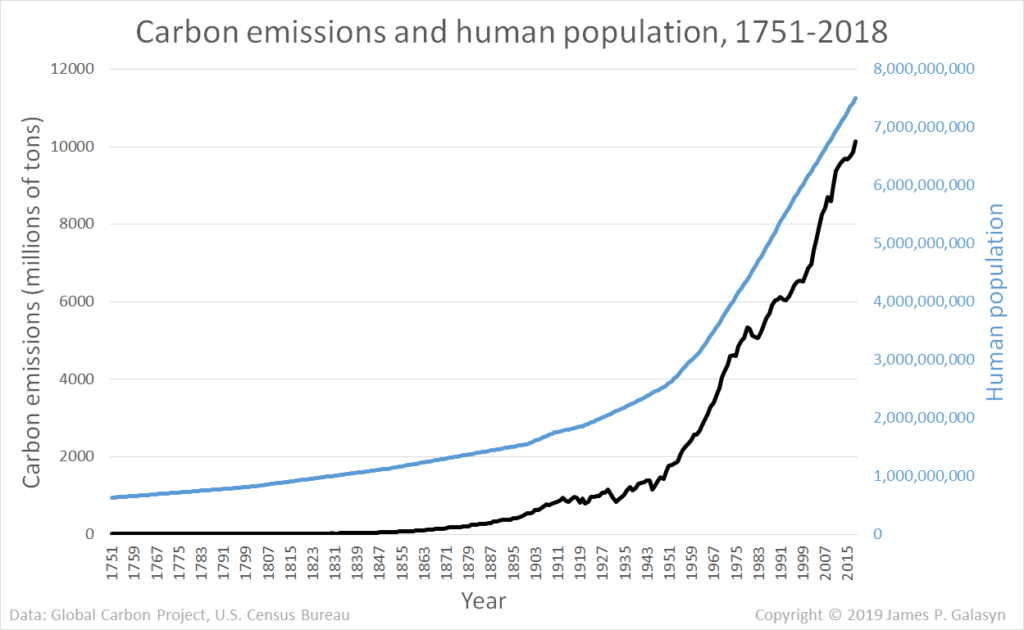
Graph of the Day: Carbon emissions and human population, 1751-2018
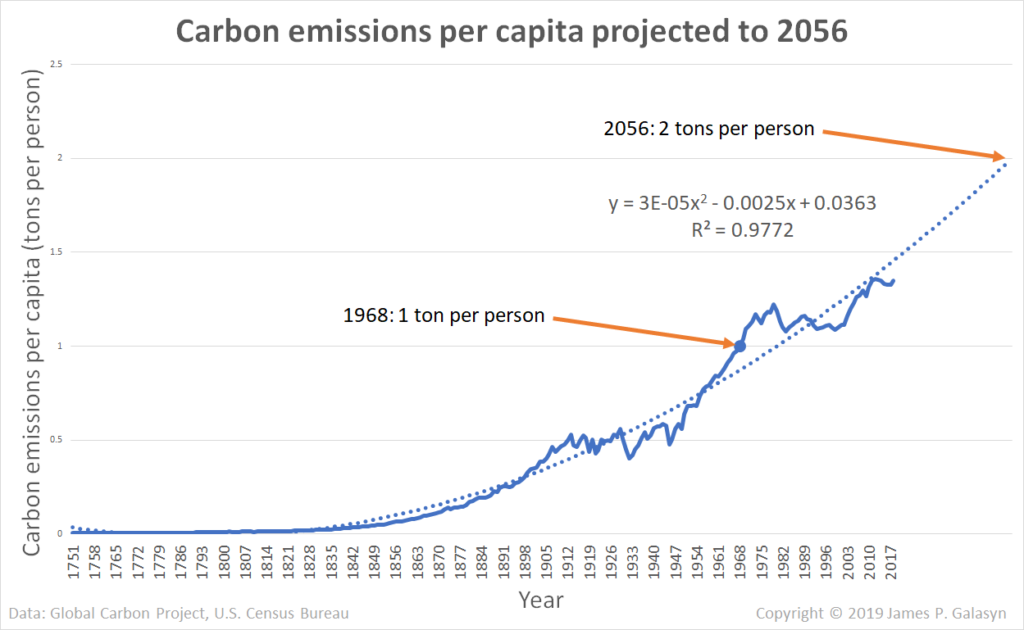
9 June 2019 (Desdemona Despair) – It’s time to update one of Desdemona’s favorite graphs: human carbon emissions per capita. In the last update, four years ago, we had carbon emissions data through the year 2013, and it was clear that per-person emissions growth followed a nearly perfect exponential curve. The curve passed through one ton per person in 1968, and if growth were to continue along the same trend, it would hit two tons per person around the year 2053.
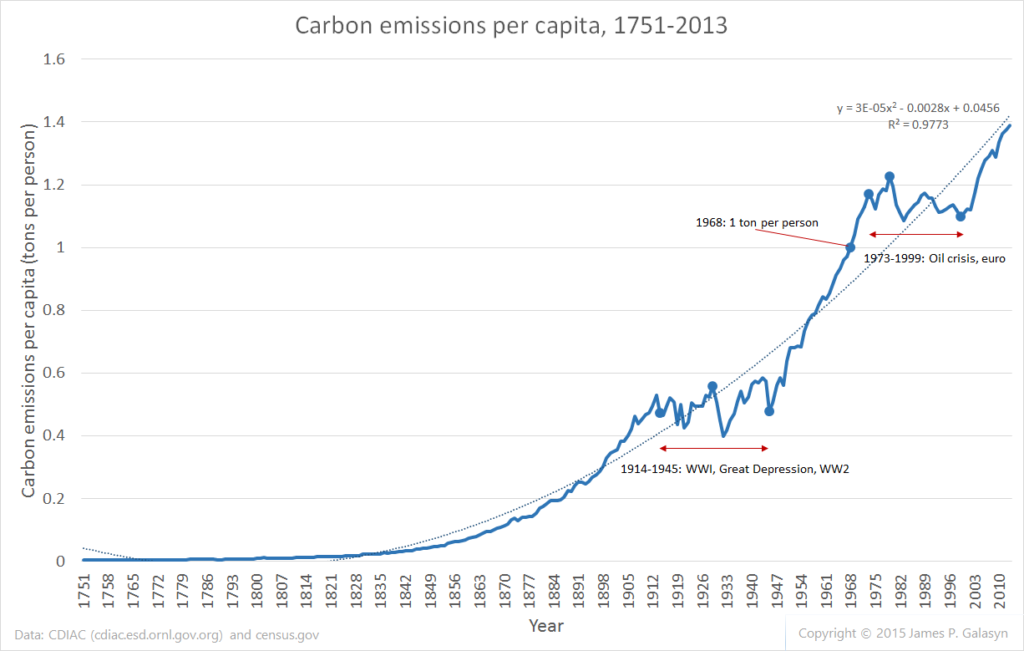
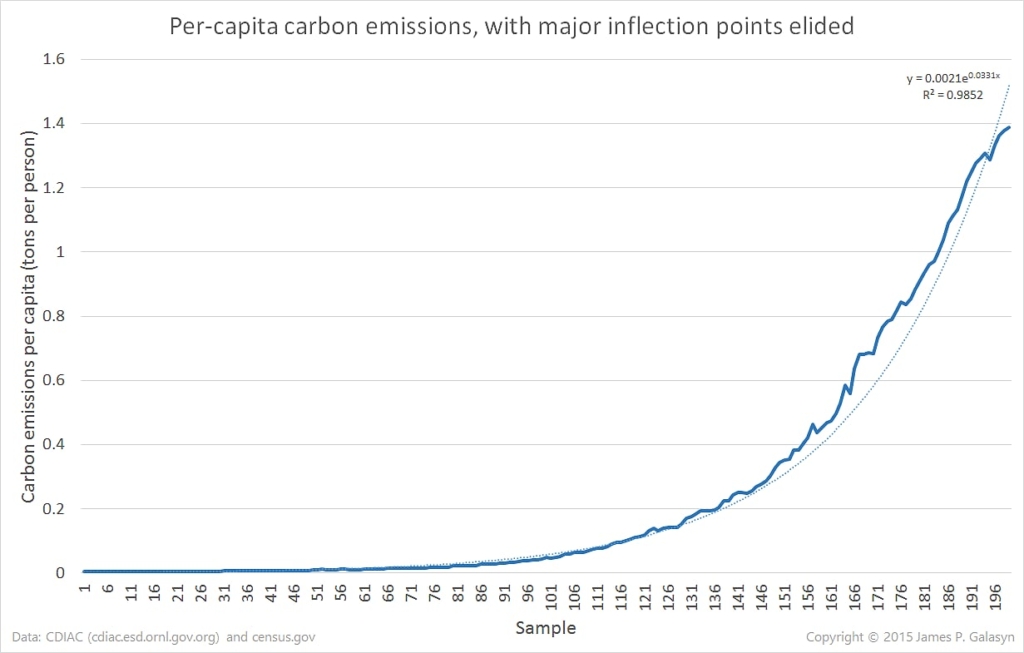
The curve fit is parabolic, but if we elide the two periods of severe economic dislocation, characterized by World War 1, the Great Depression, and World War 2 in the early 20th century, and the Iran oil crisis and the fall of the Soviet Union in the late 20th century, the “natural” growth in per-capita carbon emissions is almost perfectly exponential.
Since 2015, we have a few more data points, which may help us to see if the exponential trend is holding.
In the intervening years, optimists could point to the seeming reduction in emissions growth, which saw total carbon emissions leveling off, and even declining slightly in 2014-2015. But in 2017 and 2018, growth strongly reasserted itself, with a surprising (to some) leap to more than 10 GT of carbon in 2018.
Meanwhile, human population continued to increase at about 80 million people per year (I compute about 79 million per year with U.S. Census data, and Worldometers says about 82 million). The population growth rate has been falling monotonically since 1987, and it crossed 1.2 in 2013, on the way down.
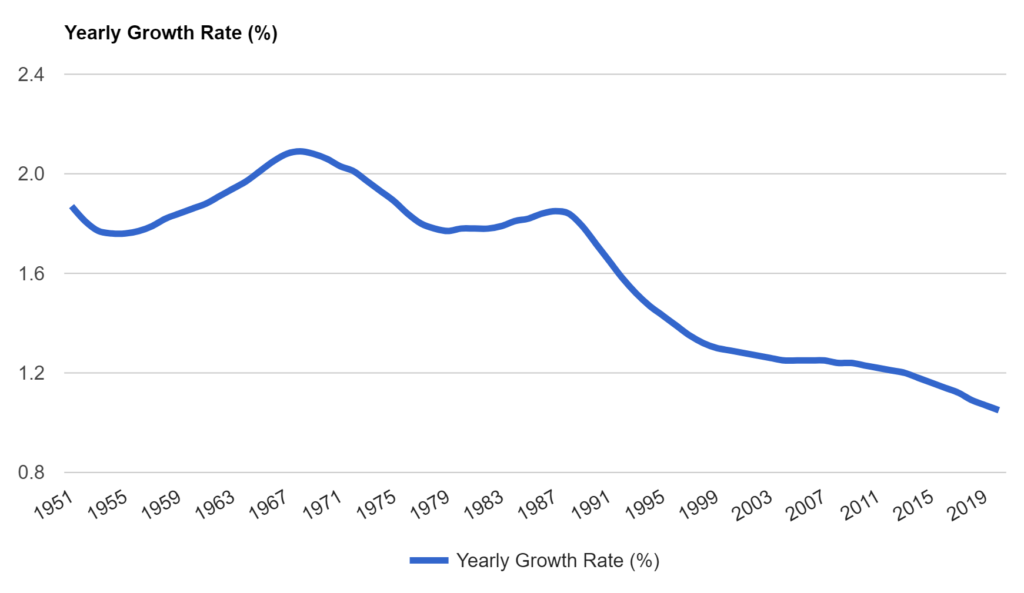
Even with the continuously declining growth rate in human population, Worldometers forecasts that human population will increase to around 10 billion in the year 2055, and 11 billion in 2100, with no peak in sight.

With the enormous number of humans coming online later this century, fossil fuel production surely won’t be able to keep up and must peak in the not-too-distant future. When that happens, it should be apparent in the emissions-per-capita curve, which will level off and start to decline. But for now, there’s no evidence of a peak in fossil fuel use in this dataset. The growth in total emissions remains supralinear, with both parabolic and exponential curves fitting very closely.
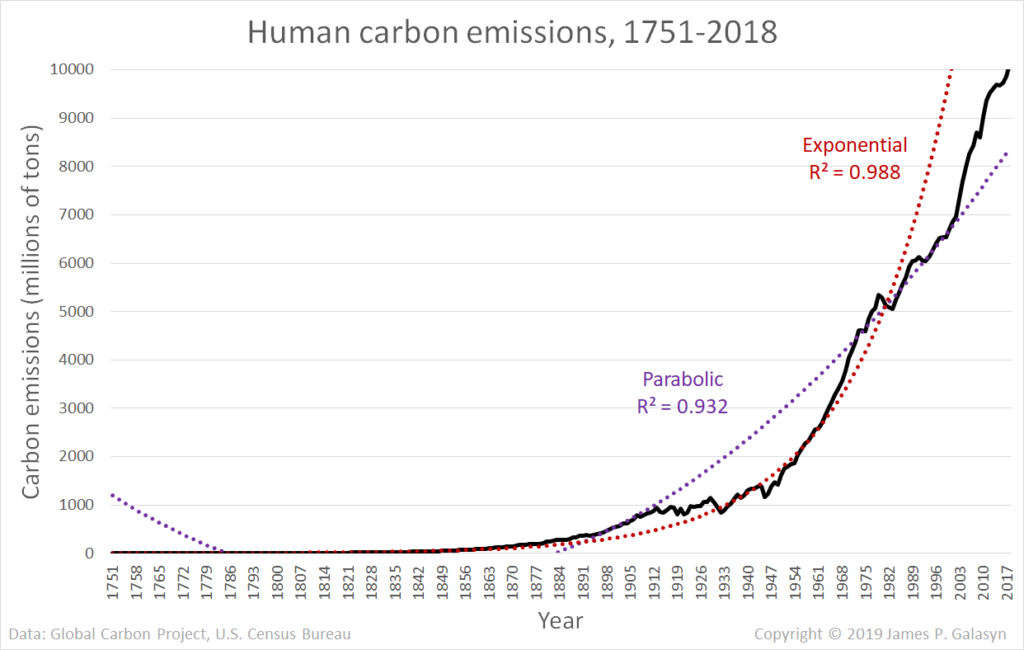
Human carbon emissions, 1751-2018. Graphic: James P. Galasyn
With the new data in hand, what does the per-capita emissions graph look like today?
Pretty much the same as in 2015:
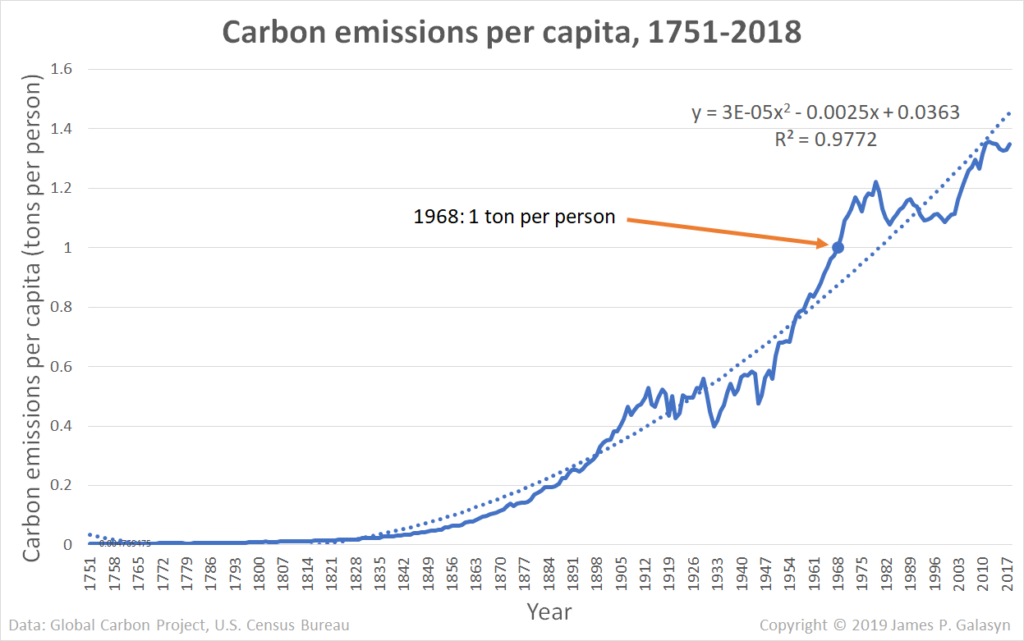
The curve is almost exactly the same, with R2 = 0.9772 for the default parabolic curve fit (it was 0.9773 with 2013 data).
As before, the “natural” growth rate of per-capita carbon emissions is exponential, with two periods of stagnation, caused by global economic dislocations. Per-capita carbon emissions exceeded one ton per person in 1968. Looking at only the period starting in 1900 shows the effect of historical events more clearly.
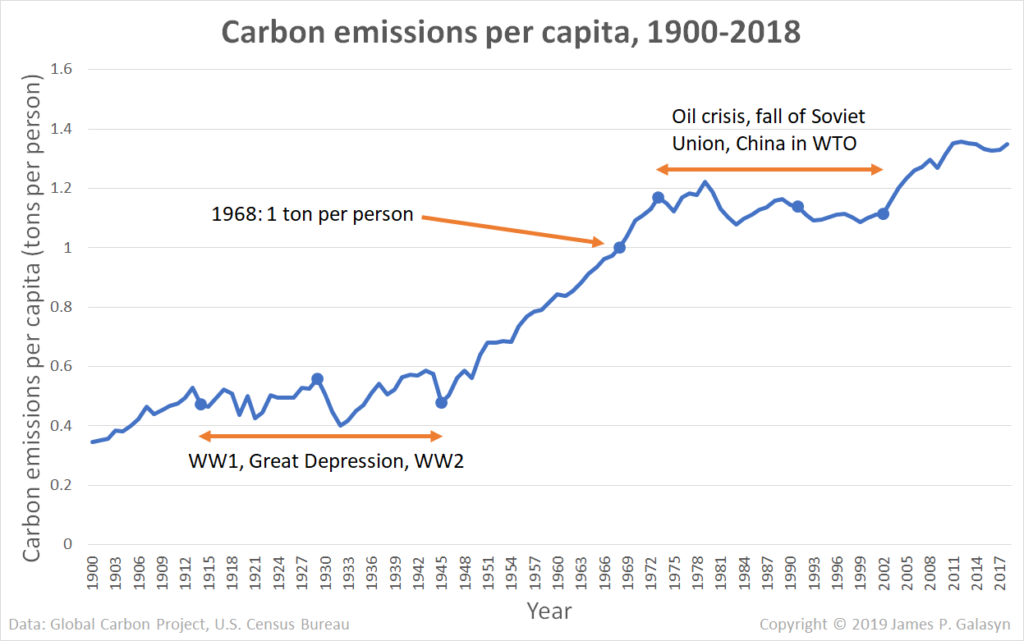
After the extended period of severe global economic dislocation that began with the OPEC oil embargo in 1973 and continued with the fall of the Soviet Union in 1991, the return to growth started with China’s admission to the World Trade Organization (WTO) and the attendant increase in carbon emissions from coal-fired power plants.
On the upside, the new data suggest that per-capita emissions growth has slowed ever so slightly, buying us a few more years. In 2015, extrapolating the parabolic curve showed that per-capita emissions would exceed two tons per person around the year 2053. The new analysis pushes that date back to 2056.
The upshot is that in 2019, per-capita carbon emissions are still on-trend, even after an apparent plateau during the 2014-2016 period. Given a trend that’s been solidly established for more than two-and-a-half centuries, there’s no reason to expect that industrial civilization will deviate from it significantly in the foreseeable future.
Check out the data here: Global carbon emissions 1751-2018.xslx.