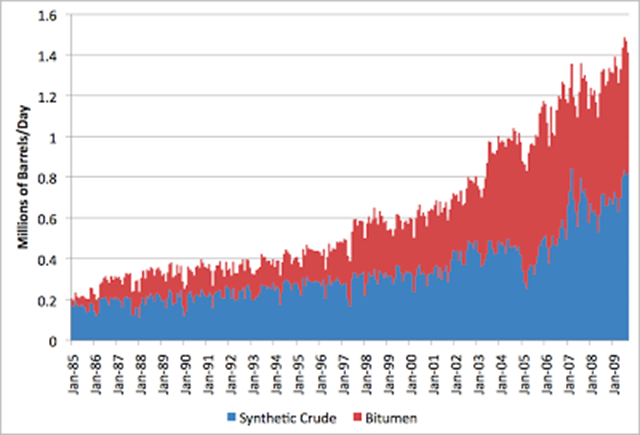
Graph of the Day: Exponential production from the Athabasca bitumen mines, 1985-2014
 23 May 2015 (Desdemona Despair) – Recently, Canada announced that it will reduce carbon emissions to 30 per cent below 2005 levels by the year 2030. But the province of Alberta is home to the Athabasca bitumen mines, aka the “Alberta tar sands” mines. The disastrous environmental effects of Alberta’s open pit mines have been well documented, e.g., by the Pembina Institute. In particular, “oilsands in northern Alberta are the fastest-growing source of greenhouse gas emissions in Canada.” How fast are carbon emissions from the bitumen mines growing? We can get an idea by looking at data published by Statistics Canada (CANSIM). Stuart Staniford’s Early Warning blog did the analysis in 2010 (h/t Alexander Ač) and found:
  Stuart observes:
Some interesting points to me:
- About half of tar sands production is actually tar, not oil.
- Compound annual growth rate from 2000-2009 (average of the first nine months of each) was 9.6%.
- Production did not appreciably slow down in late 2008/early 2009 as a result of the great recession.
Alexander Ač updated Stuart’s graph with the latest data (through February 2015) and found that growth in tar sands mine production is exponential. Des followed Stuart’s instructions for getting the data from CANSIM and reproduced this graph. Using the exponential curve, we can project future growth. The Alberta Energy Oil Sands FAQ cites a projection by the Canadian Energy Research Institute (CERI) that’s pretty close to exponential:
Oil sands production (upgraded and non-upgraded) is forecasted to grow from the current level of 1.98 million barrels per day (2013) to 3.7 million barrels per day by 2020 and 5.2 million barrels per day by 2030. Source: Canadian Economic Impacts of New and Existing Oil Sands Development in Alberta (2014-2038)
Extrapolating Desdemona’s graph shows production in the ballpark of CERI’s projections. The projection for 2030 is about 1 mbpd below the extrapolation, possibly indicating logistic behavior.  With Alberta’s tar sands production on a trajectory of exponential growth, it’s hard to see how Canada will meet its carbon reduction target. Of course, much of this oil will be exported, and those carbon emissions will go to another country’s carbon budget. You can get the data and related graphs here: Supply and disposition of crude oil and equivalent in Alberta CANSIM.xlsx
Anybody that believes anything coming from Canadian politicians is a fool. They lie about everything, especially commitments to greenhouse gasses, environment and Native affairs. You can take this to the bank – they're LYING about their so-called "commitment" to greenhouse gas reduction as evidenced by what they are STILL DOING AND FULLY INTEND TO KEEP ON DOING.