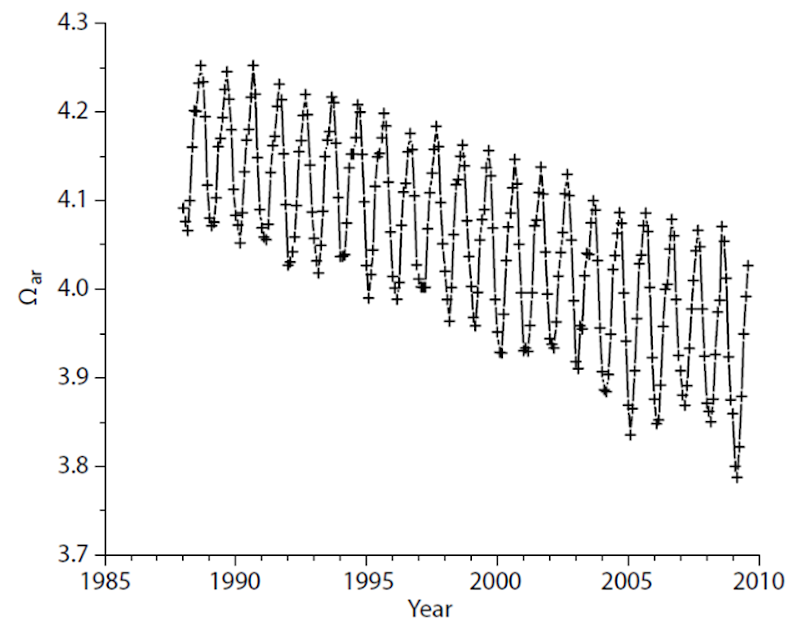
Graph of the Day: Aragonite Saturation in the Greater Caribbean Region, 1988-2009
Using climatological salinities (World Ocean Atlas available from NOAA NODC at http://www.nodc.noaa.gov) and NOAA SSTOI, we extended this approach to model fields back through 1988 (Figure 2b), revealing regionally averaged Ωar values declining at a rate of about 3% per decade amid considerable seasonal variability. These values are consistent with in situ measurements obtained at the nearby BATS station (Nelson et al., 2001). We can appreciate the historical context of such changes by driving the model using the NOAA extended reconstruction SST product (NOAA_ERSST_V3; http://www.esrl.noaa.gov/psd/) and atmospheric CO2 reconstructions spanning the last century (http://cdiac.ornl.gov/trends/co2/). This SST is based on in situ values and thus represents an interpolation of limited values across rather coarse resolutions (monthly x 2°), resulting in a somewhat muted seasonal amplitude relative to the satellite-based model (Figure 4). However, it does illustrate that the rate of decline during the last two decades is accelerating compared to the decline prior to 1960, corresponding to the increase in atmospheric CO2 growth rate over this time period. There remains considerable debate regarding the geochemical threshold (i.e., minimum Ωar value) below which positive reef accretion may be compromised, but there is consensus that a saturation state well over 1 is necessary. Silverman et al. (2009) suggested that such a threshold would be crossed should atmospheric values exceed 560 ppm, at which point regionally averaged Ωar values will decline below 3.0 across the Greater Caribbean Region (GCR).
D.K. Gledhill, R. Wanninkhof, and C.M. Eakin, Observing Ocean Acidification from Space [pdf], Oceangraphy, Special Issue on the the Future of Ocean Biogeochemistry in a High-CO2 World, December 2009, Volume 22, Number 4
