March 19, 2009
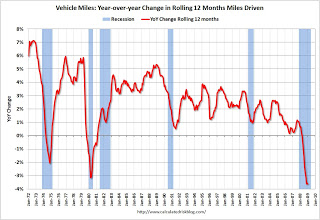
Graph of the Day: US Vehicle Miles, 1972-2009
From Calculated Risk: 
The Dept of Transportation reports on U.S. Traffic Volume Trends:
[T]ravel during January 2009 on all roads and streets in the nation changed by -3.1 percent (-7.0 billion vehicle miles) resulting in estimated travel for the month at 222.4 billion vehicle-miles.
The graph shows the annual change in the rolling 12 month average of U.S. vehicles miles driven. Note: the rolling 12 month average is used to remove noise and seasonality. By this measure, vehicle miles driven are off 3.6% Year-over-year (YoY); the decline in miles driven is worse than during the early ’70s and 1979-1980 oil crisis. …
DOT: U.S. Vehicle Miles Off 3.1% in January
Technorati Tags: financial collapse