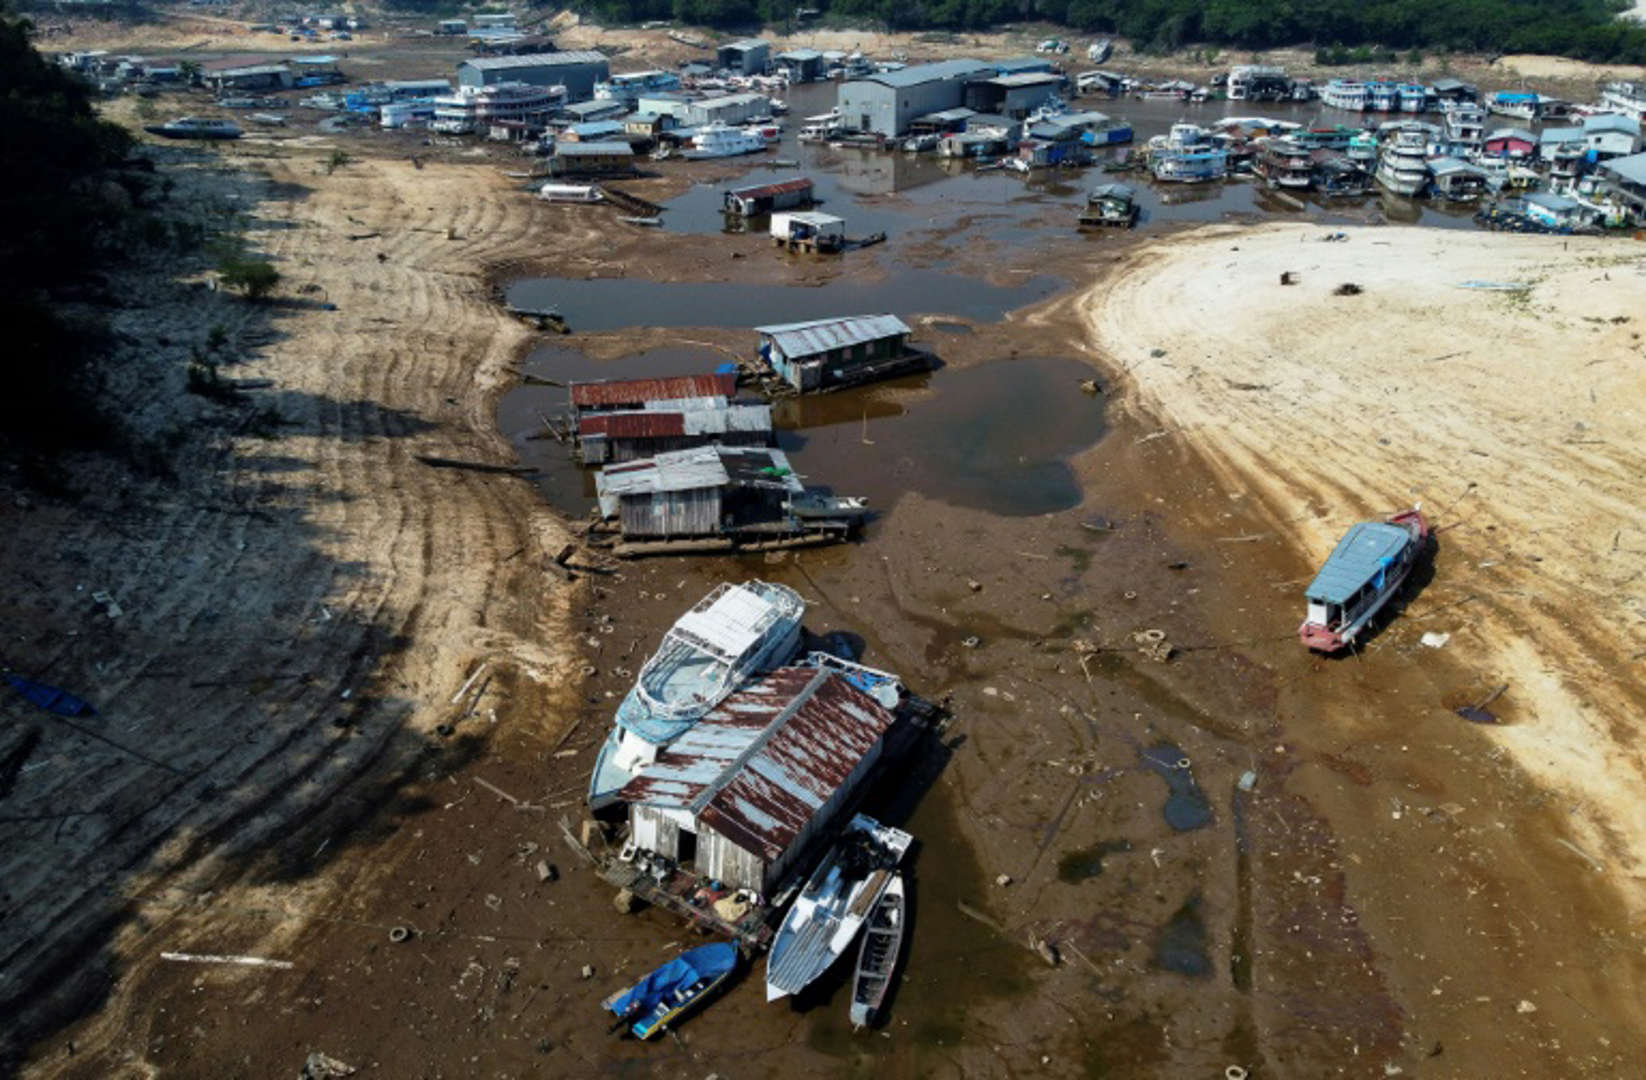
By Stephanie Hegarty 25 December 2023 (BBC World Service) – The Amazon rainforest experienced its worst drought on record in 2023. Many villages became unreachable by river, wildfires raged, and wildlife died. Some scientists worry events like these are a sign that the world’s biggest forest is fast approaching a point of no return. As […]
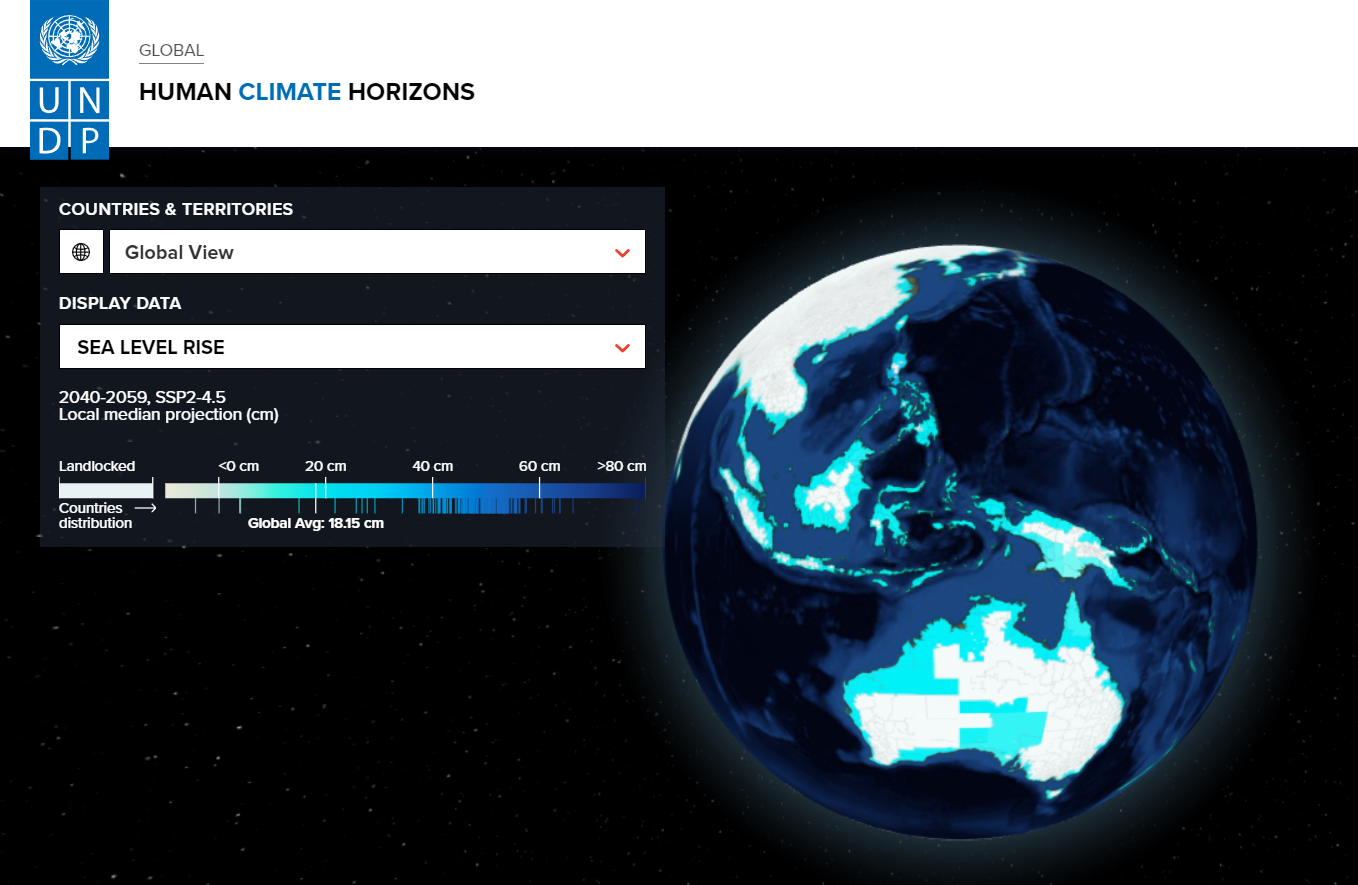
28 November 2023 (UNDP) – According to new data on the Human Climate Horizons platform, a collaboration between the Climate Impact Lab and UNDP, increased coastal flooding this century will put over 70 million people in the path of expanding floodplains. Latin America and the Caribbean, East Asia and the Pacific, and Small Island Developing […]
By Rebecca Falconer 22 November 2023 (Axios) – Brazil has sweltered through its hottest day since record-keeping began, as an extreme spring heat wave envelopes the country. By the numbers: The town of Araçuaí, in the southeastern state of Minas Gerais, beat the nation’s previous record from November 2005 on Sunday when the temperature reached 44.8°C (112.6°F), per […]
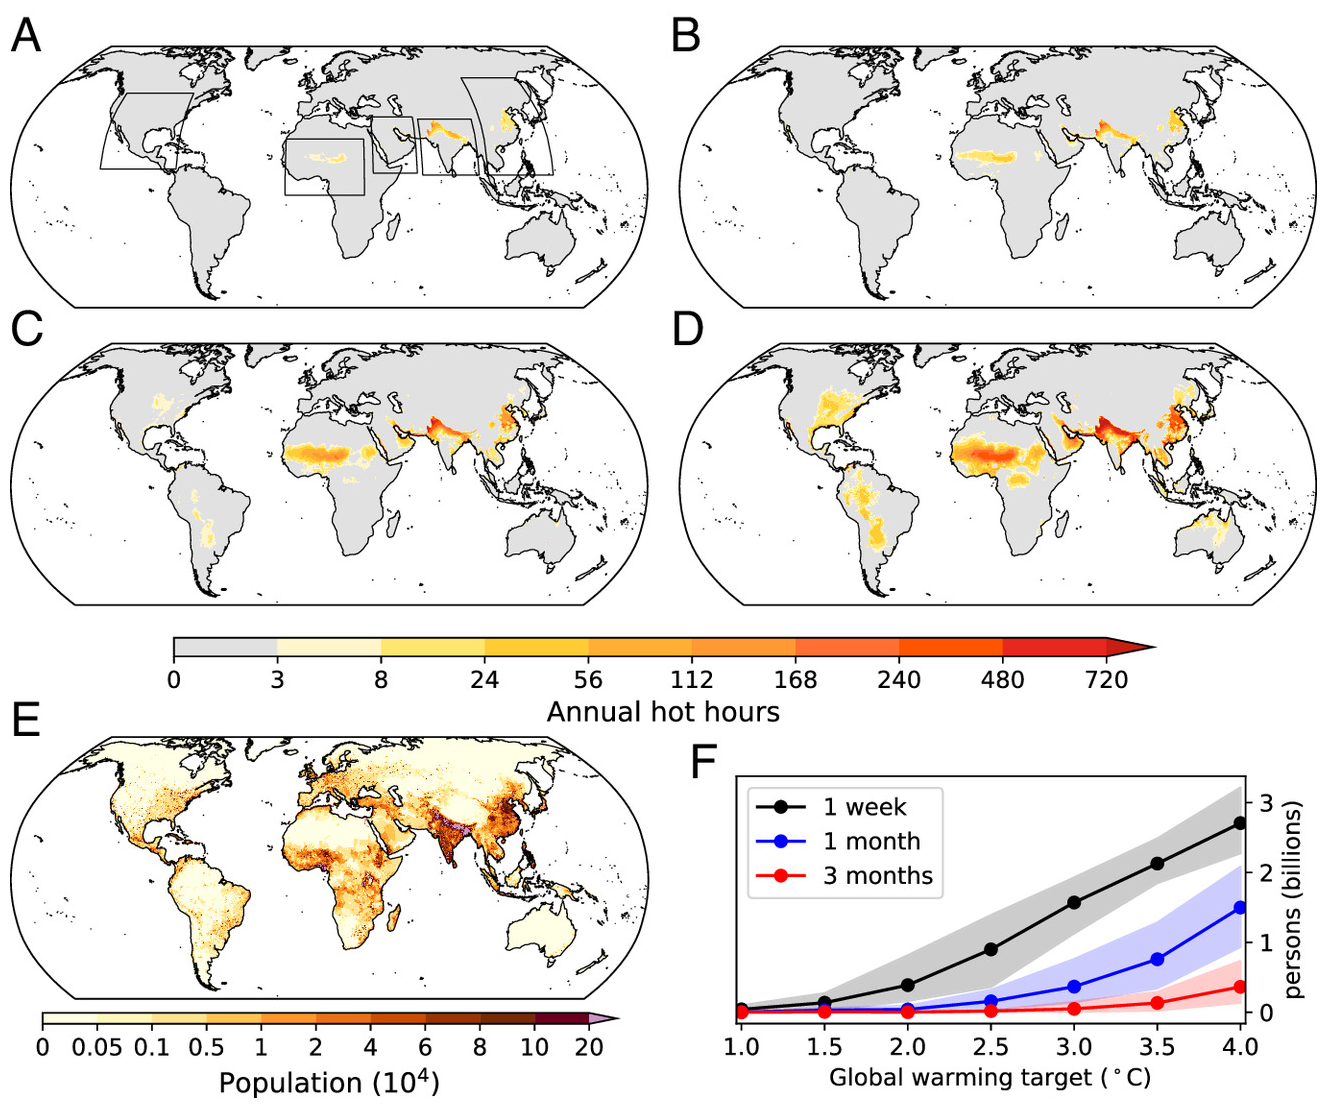
By Aaron Wagner 9 October 2023 UNIVERSITY PARK, Pa. (PennState) – If global temperatures increase by 1 degree Celsius (C) or more than current levels, each year billions of people will be exposed to heat and humidity so extreme they will be unable to naturally cool themselves, according to interdisciplinary research from the Penn State […]
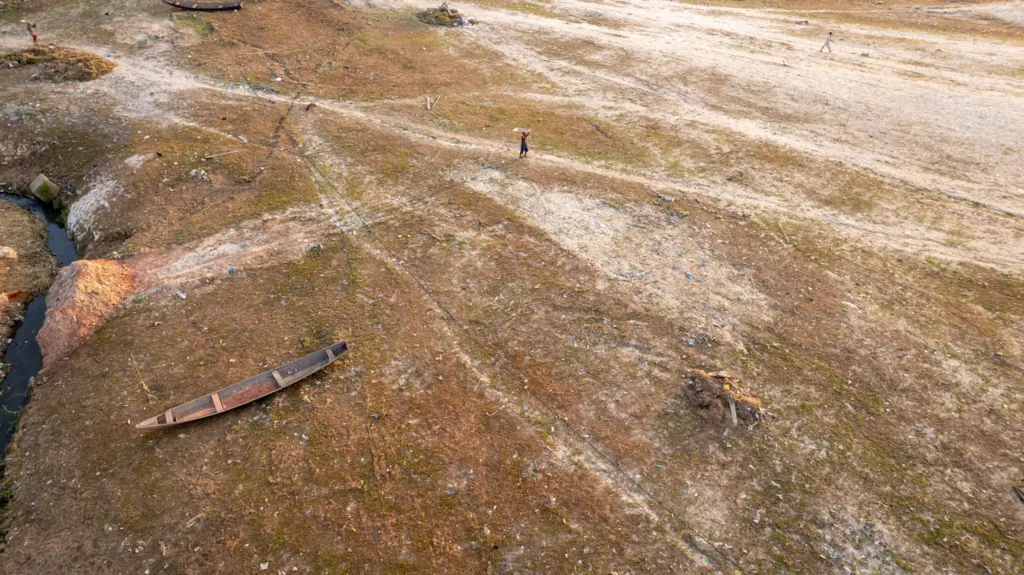
By Orlando Junior 3 October 2023 (AFP) – Not far from the emblematic site where the black waters of the Rio Negro join the brown currents of the Solimoes, two chief tributaries of the Amazon, what once was a lake has given way to a vast stretch of cracked mud. Now, the only water remaining […]
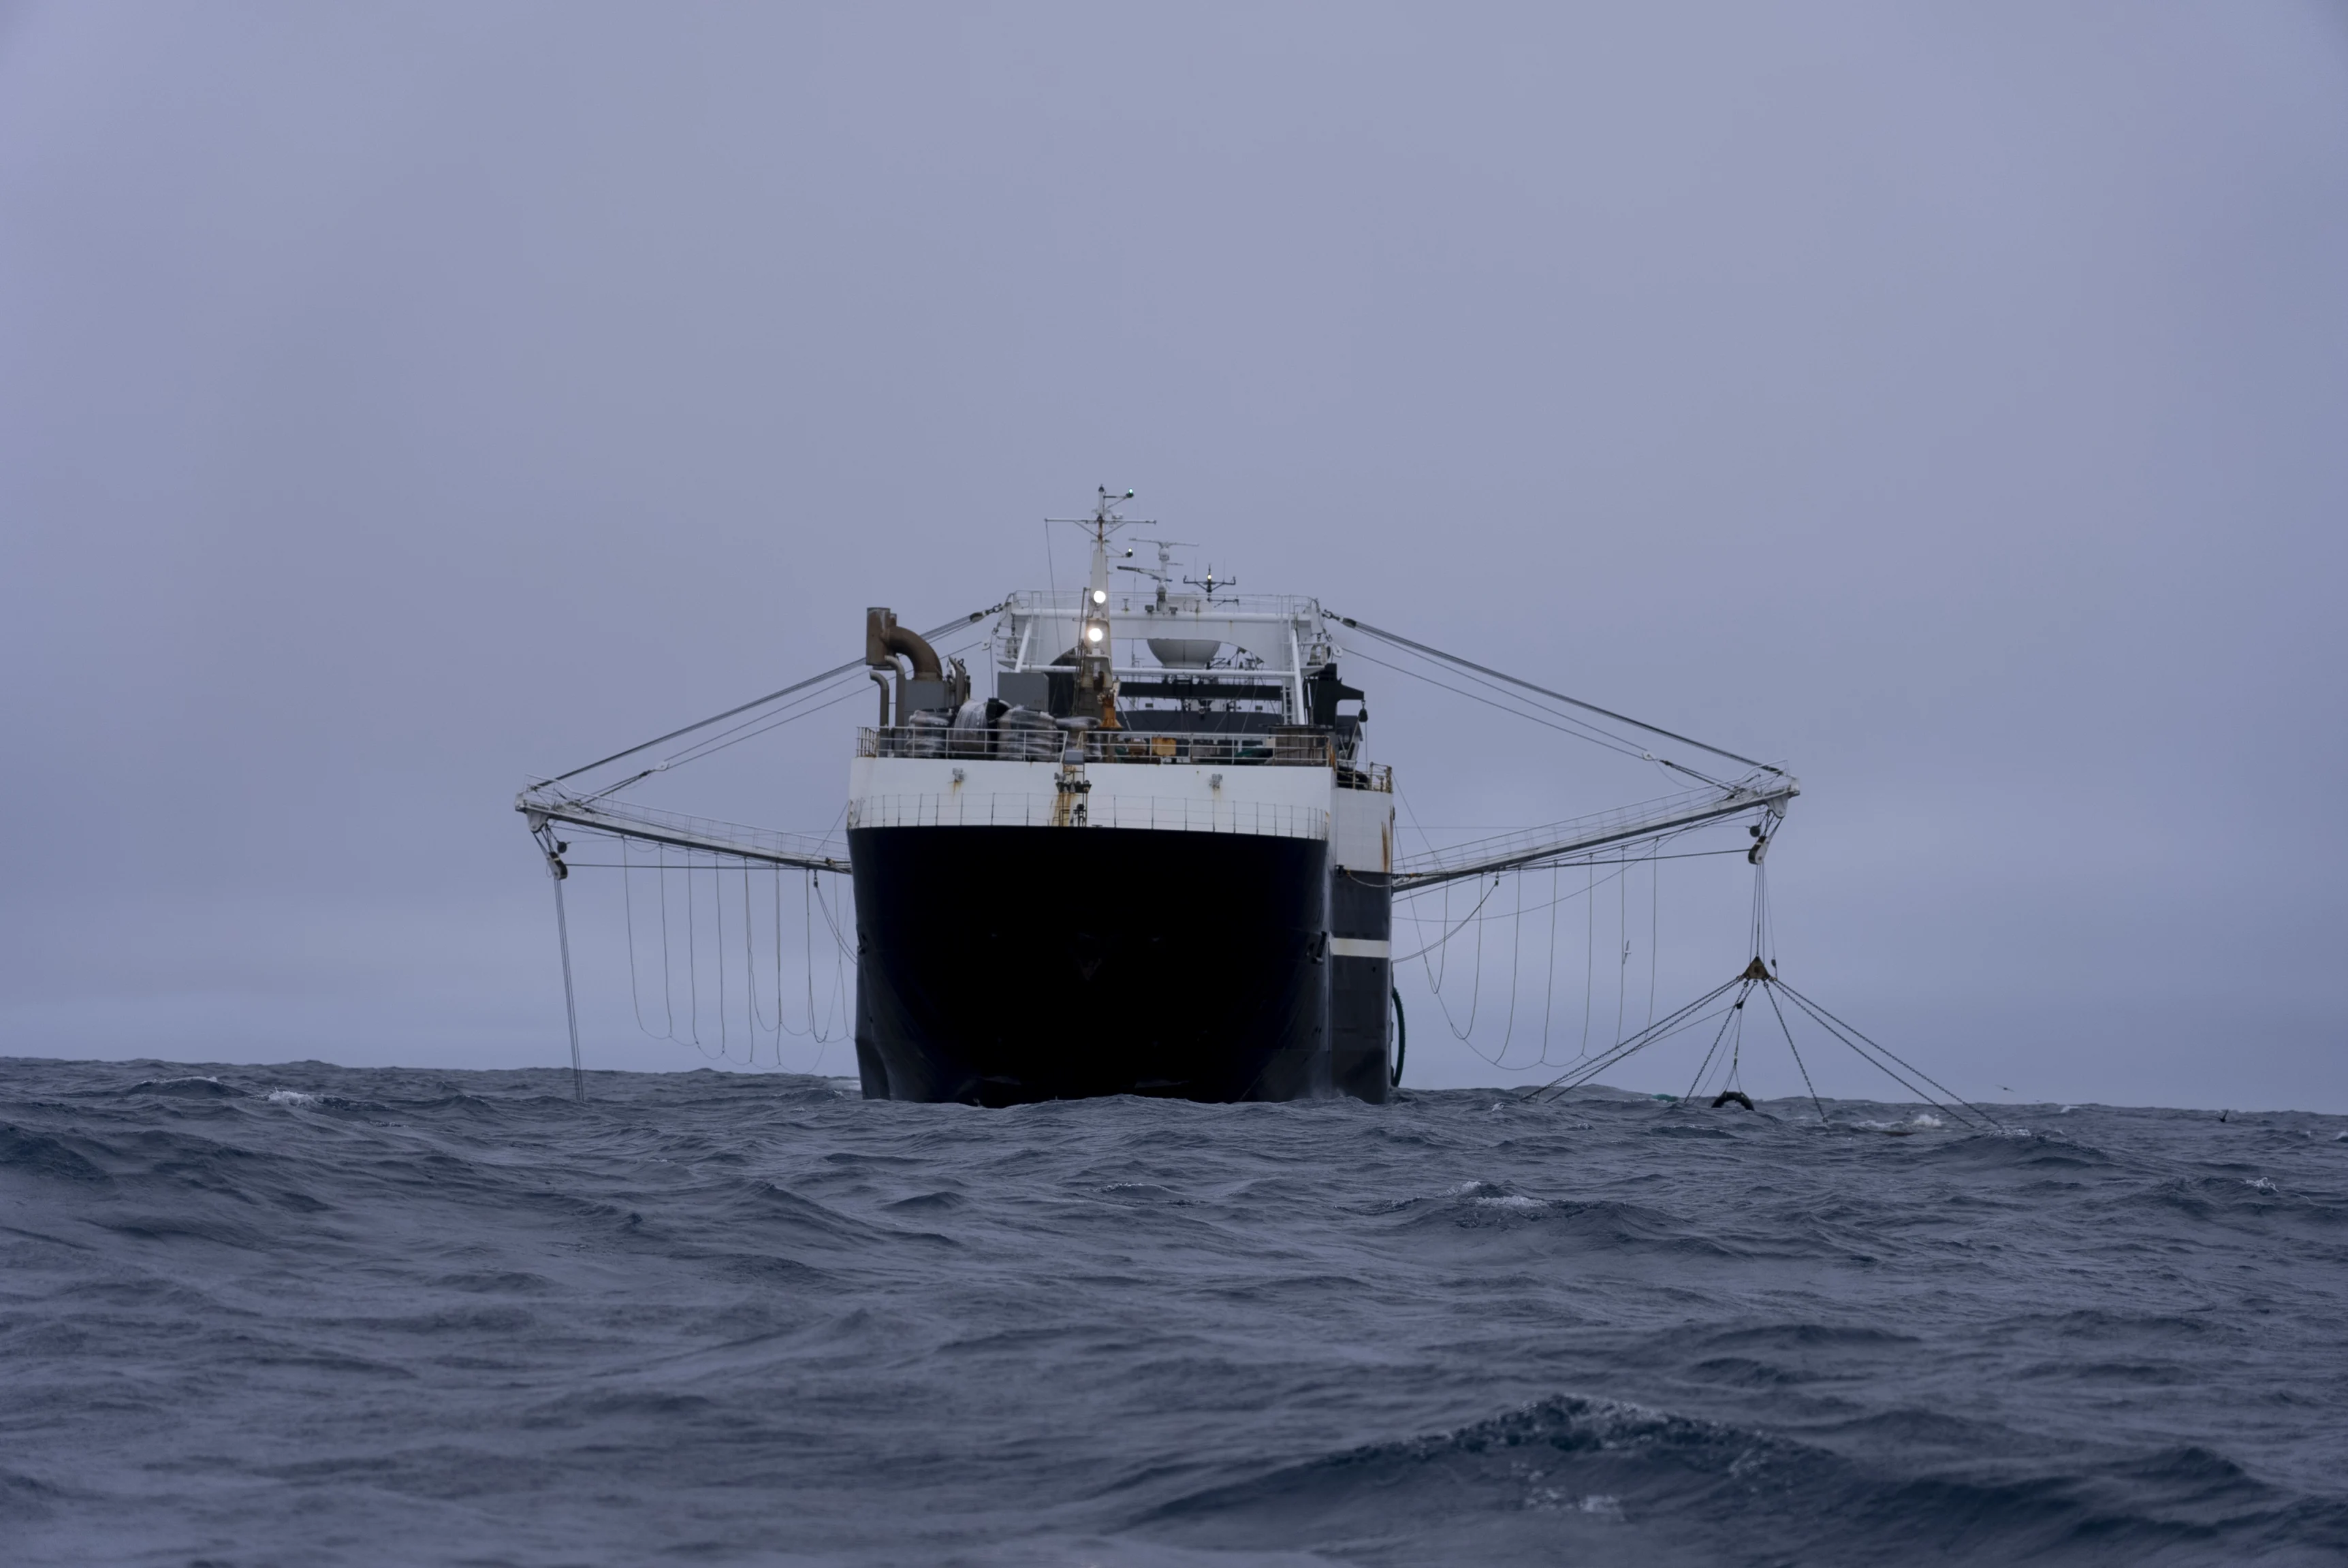
By Joshua Goodman and David Keyton 13 October 2023 (AP) – The Antarctic Endeavour glides across the water’s silky surface as dozens of fin whales spray rainbows from their blowholes into a fairy tale icescape of massive glaciers. But as a patrol of environmentalists approaches the Chilean super trawler in an inflatable boat, the cruder […]
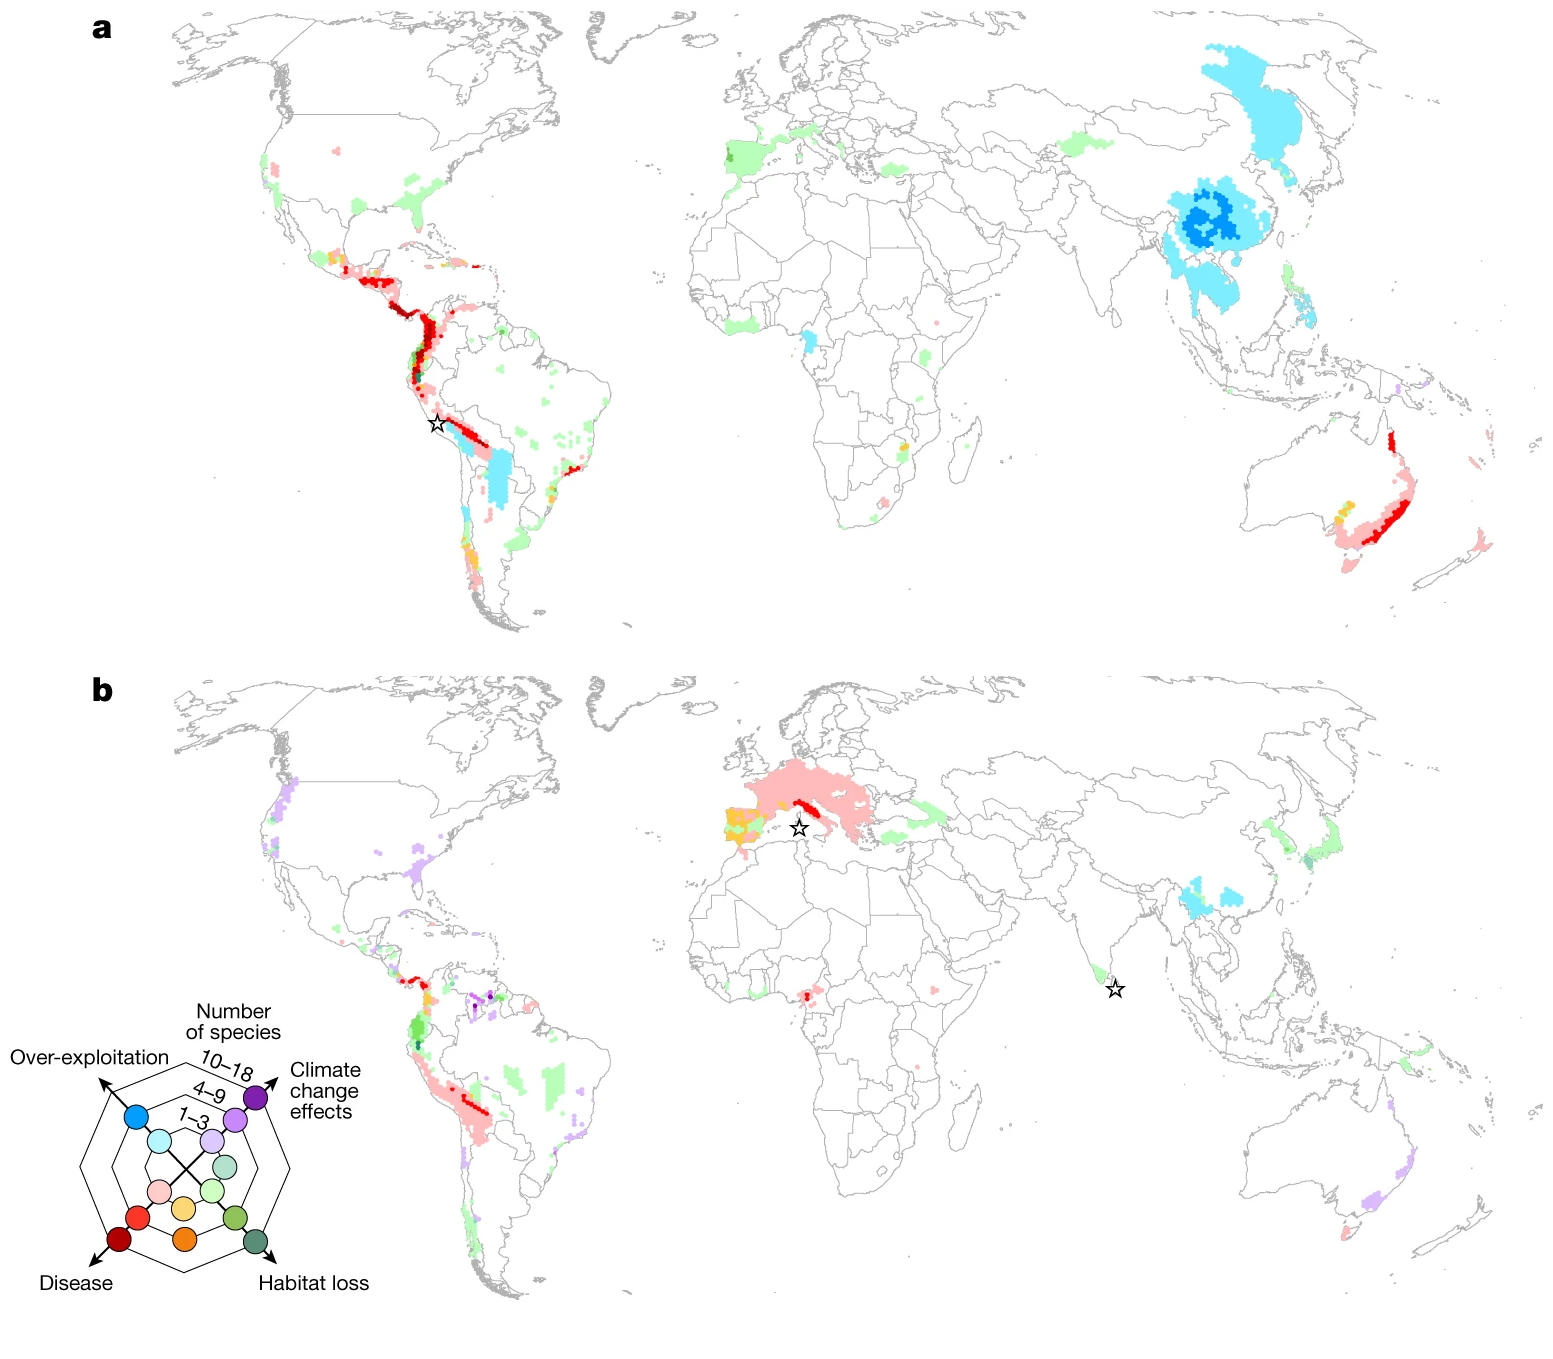
By JoAnn Adkins 4 October 2023 (FIU) – Amphibians are in trouble and in desperate need of conservation action, according to a new global assessment of the world’s amphibian population. Salamanders are experiencing the greatest decline in numbers, but frogs, toads, newts, and salamanders throughout the Neotropics — extending from South Florida and Caribbean islands […]
By Luciana Magalhaes and Samantha Pearson 17 September 2023 JUAZEIRO, Brazil – Weighing more than 100 pounds, big cats have long reigned over this hot and semi-arid region of Brazil, developing tougher paws for the scorched earth and reaching speeds of 50 miles an hour to bring down wild boar and deer. But nothing could […]
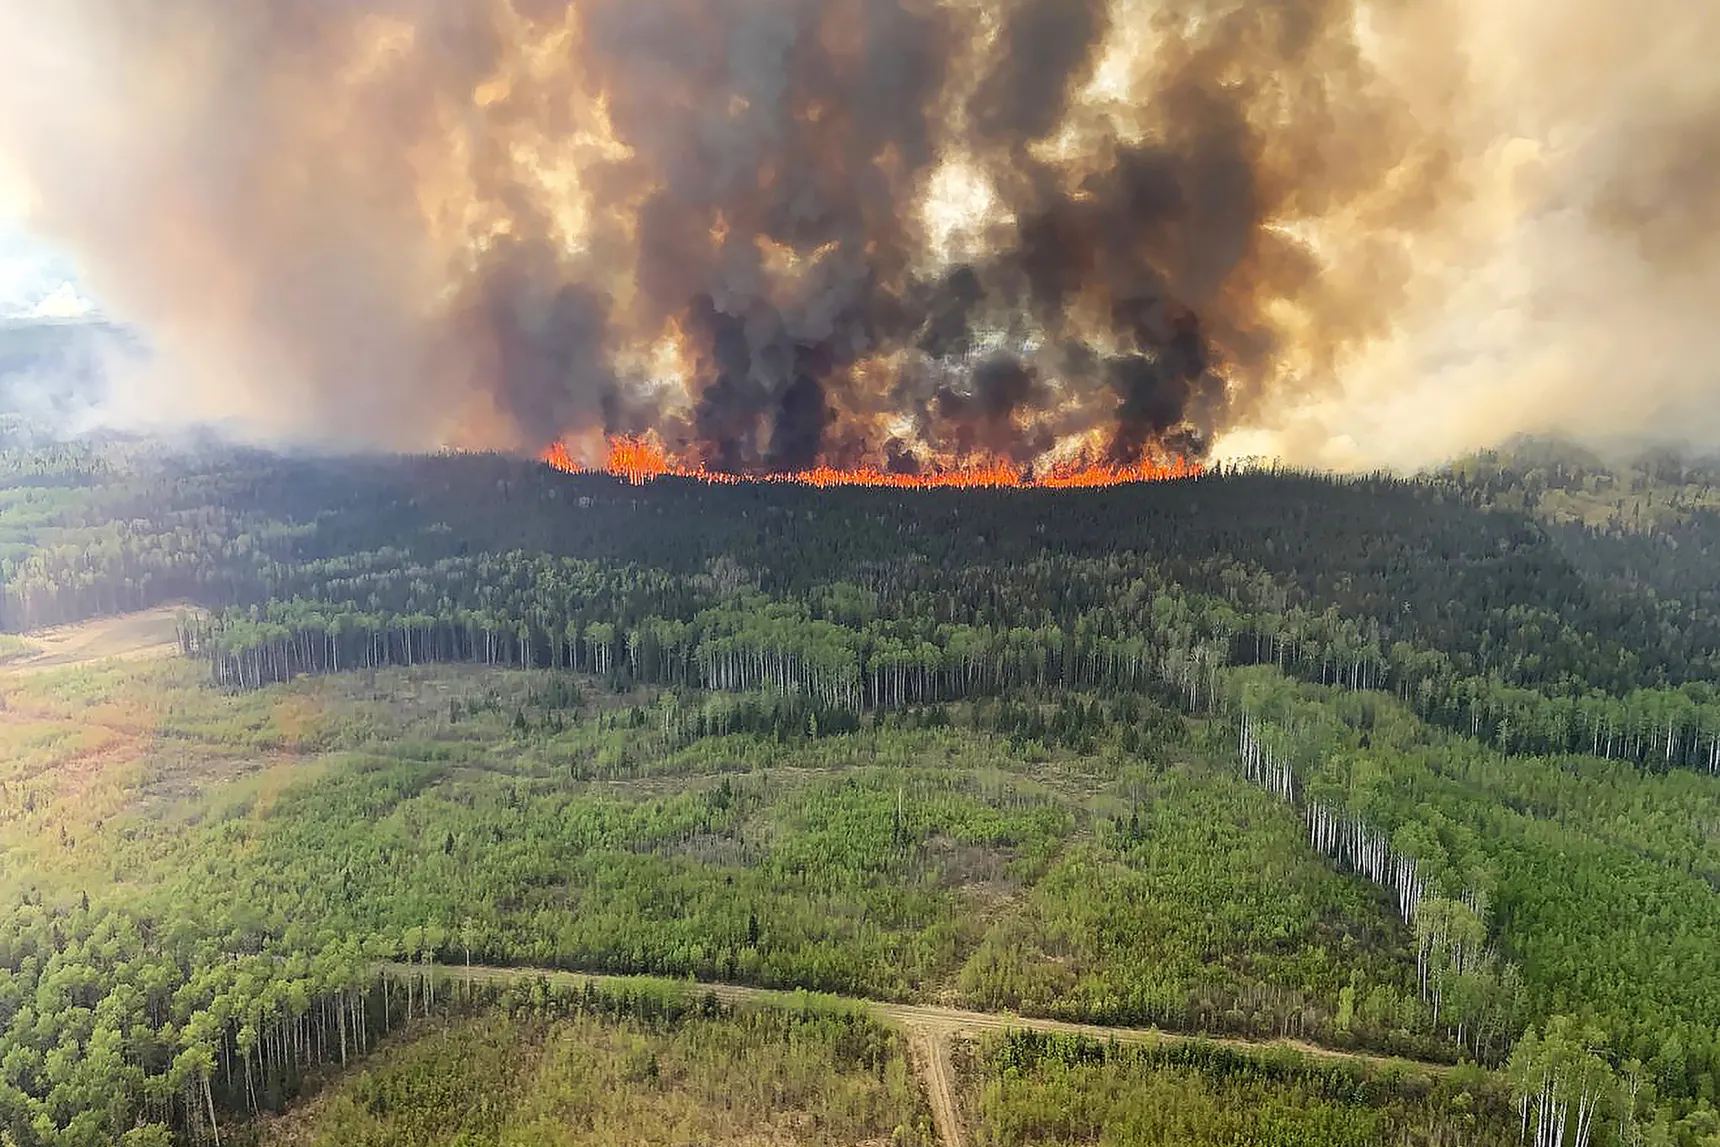
By David Wallace-Wells 6 September 2023 (The New York Times) – Canadian wildfires have this year burned a land area larger than 104 of the world’s 195 countries. The carbon dioxide released by them so far is estimated to be nearly 1.5 billion tons — more than twice as much as Canada releases through transportation, […]
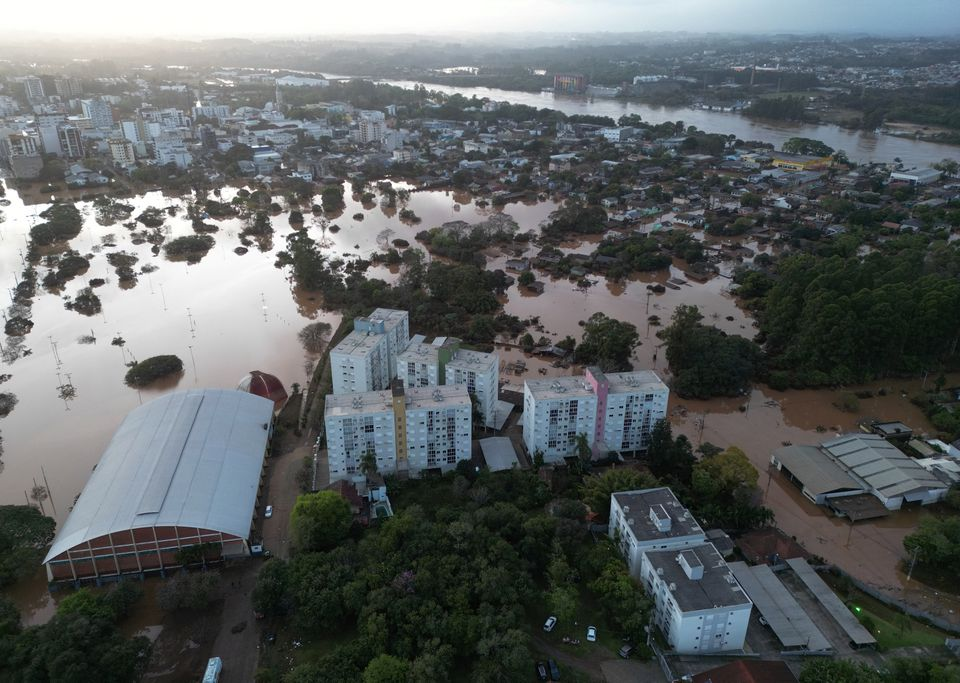
By George Wright 6 September 2023 (BBC News) – Torrential rain and winds caused by a cyclone have left at least 27 people dead in southern Brazil, with more flooding expected. The governor of Rio Grande do Sul said it was the state’s worst-ever weather disaster. Thousands have been forced from their homes, officials said. […]