Graph of the Day: Outlet Glacier Accelerations in Greenland, 2000-2010
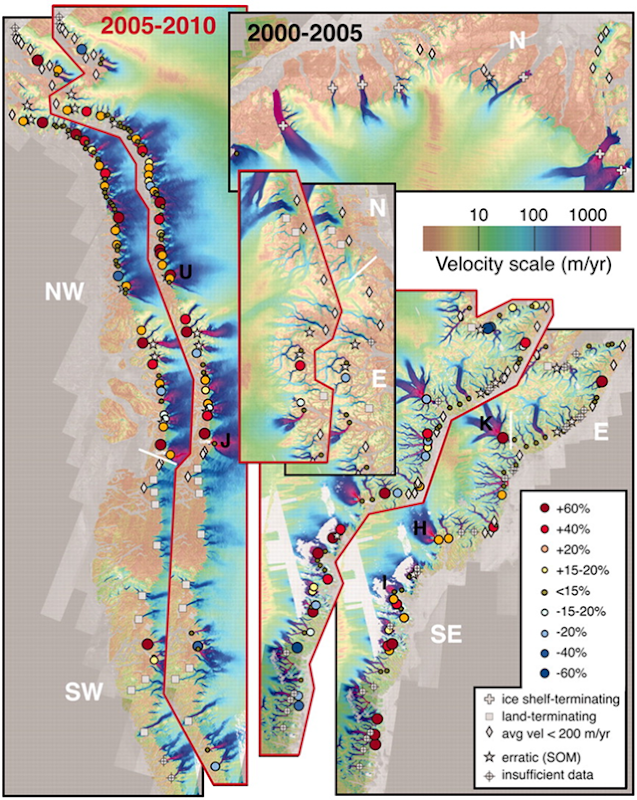
Outlet glacier categories and rates of velocity change (percentage change from beginning of 5-year period). Black-outlined images show 2000 to 2005 results, and red-outlined images are 2005 to 2010 results. The background velocity map for both periods is a 2007 to 2010 composite, with the five ice-sheet regions indicated: north (N), northwest (NW), southwest (SW), southeast (SE), and east (E). There was no change for the north during 2005 to 2010. Jakobshavn (J), Upernavik North (U), Helheim (H), Kangerdlugssuaq (K), and Ikeq Fjord (I) glaciers are indicated. Moon, et al., 2012 ABSTRACT: Earlier observations on several of Greenland’s outlet glaciers, starting near the turn of the 21st century, indicated rapid (annual-scale) and large (>100%) increases in glacier velocity. Combining data from several satellites, we produce a decade-long (2000 to 2010) record documenting the ongoing velocity evolution of nearly all (200+) of Greenland’s major outlet glaciers, revealing complex spatial and temporal patterns. Changes on fast-flow marine-terminating glaciers contrast with steady velocities on ice-shelf–terminating glaciers and slow speeds on land-terminating glaciers. Regionally, glaciers in the northwest accelerated steadily, with more variability in the southeast and relatively steady flow elsewhere. Intraregional variability shows a complex response to regional and local forcing. Observed acceleration indicates that sea level rise from Greenland may fall well below proposed upper bounds. […] Finally, our observations have implications for recent work on sea level rise. Earlier research (33) used a kinematic approach to estimate upper bounds of 0.8 to 2.0 m for 21st-century sea level rise. In Greenland, this work assumed ice-sheet–wide doubling of glacier speeds (low-end scenario) or an order of magnitude increase in speeds (high-end scenario) from 2000 to 2010. Our wide sampling of actual 2000 to 2010 changes shows that glacier acceleration across the ice sheet remains far below these estimates, suggesting that sea level rise associated with Greenland glacier dynamics remains well below the low-end scenario (9.3 cm by 2100) at present. Continued acceleration, however, may cause sea level rise to approach the low-end limit by this century’s end. Our sampling of a large population of glaciers, many of which have sustained considerable thinning and retreat, suggests little potential for the type of widespread extreme (i.e., order of magnitude) acceleration represented in the high-end scenario (46.7 cm by 2100). Our result is consistent with findings from recent numerical flow models (34).
21st-Century Evolution of Greenland Outlet Glacier Velocities