Graph of the Day: Comparison of observed and simulated climate change based on three large-scale indicators in the atmosphere, the cryosphere, and the ocean
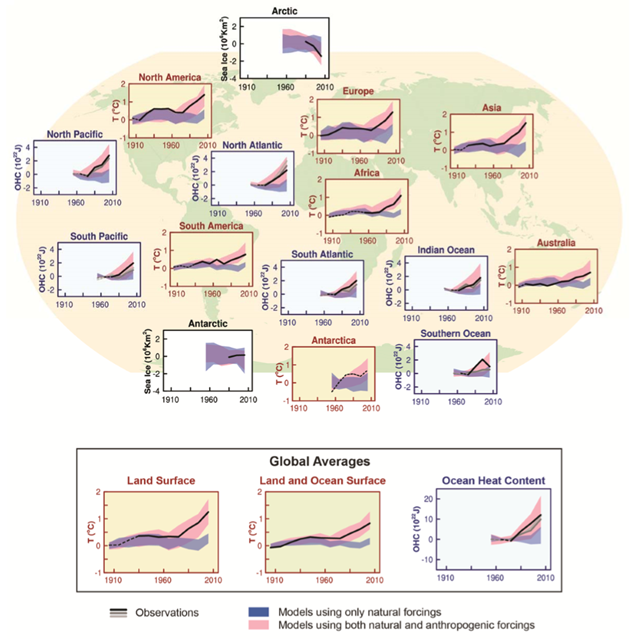
27 September 2013 (IPCC) – [This graph shows a] comparison of observed and simulated climate change based on three large-scale indicators in the atmosphere, the cryosphere and the ocean: change in continental land surface air temperatures (yellow panels), Arctic and Antarctic September sea ice extent (white panels), and upper ocean heat content in the major ocean basins (blue panels). Global average changes are also given. Anomalies are given relative to 1880–1919 for surface temperatures, 1960–1980 for ocean heat content and 1979–1999 for sea ice. All time-series are decadal averages, plotted at the centre of the decade. For temperature panels, observations are dashed lines if the spatial coverage of areas being examined is below 50%. For ocean heat content and sea ice panels the solid line is where the coverage of data is good and higher in quality, and the dashed line is where the data coverage is only adequate, and thus, uncertainty is larger. Model results shown are Coupled Model Intercomparison Project Phase 5 (CMIP5) multi-model ensemble ranges, with shaded bands indicating the 5 to 95% confidence intervals. For further technical details, including region definitions see the Technical Summary Supplementary Material. {Figure 10.21; Figure TS.12}
- It is extremely likely that more than half of the observed increase in global average surface temperature from 1951 to 2010 was caused by the anthropogenic increase in greenhouse gas concentrations and other anthropogenic forcings together. The best estimate of the human- induced contribution to warming is similar to the observed warming over this period. {10.3}
- Greenhouse gases contributed a global mean surface warming likely to be in the range of 0.5°C to 1.3°C over the period 1951−2010, with the contributions from other anthropogenic forcings, including the cooling effect of aerosols, likely to be in the range of −0.6°C to 0.1°C. The contribution from natural forcings is likely to be in the range of −0.1°C to 0.1°C, and from internal variability is likely to be in the range of −0.1°C to 0.1°C. Together these assessed contributions are consistent with the observed warming of approximately 0.6°C to 0.7°C over this period. {10.3}
- Over every continental region except Antarctica, anthropogenic forcings have likely made a substantial contribution to surface temperature increases since the mid-20th century (see Figure SPM.6). For Antarctica, large observational uncertainties result in low confidence that anthropogenic forcings have contributed to the observed warming averaged over available stations. It is likely that there has been an anthropogenic contribution to the very substantial Arctic warming since the mid-20th century. {2.4, 10.3}
- It is very likely that anthropogenic influence, particularly greenhouse gases and stratospheric ozone depletion, has led to a detectable observed pattern of tropospheric warming and a corresponding cooling in the lower stratosphere since 1961. {2.4, 9.4, 10.3}
- It is very likely that anthropogenic forcings have made a substantial contribution to increases in global upper ocean heat content (0–700 m) observed since the 1970s (see Figure SPM.6). There is evidence for human influence in some individual ocean basins. {3.2, 10.4}
- It is likely that anthropogenic influences have affected the global water cycle since 1960. Anthropogenic influences have contributed to observed increases in atmospheric moisture content in the atmosphere (medium confidence), to global-scale changes in precipitation patterns over land (medium confidence), to intensification of heavy precipitation over land regions where data are sufficient (medium confidence), and to changes in surface and sub- surface ocean salinity (very likely). {2.5, 2.6, 3.3, 7.6, 10.3, 10.4}
- There has been further strengthening of the evidence for human influence on temperature extremes since the SREX. It is now very likely that human influence has contributed to observed global scale changes in the frequency and intensity of daily temperature extremes since the mid-20th century, and likely that human influence has more than doubled the probability of occurrence of heat waves in some locations (see Table SPM.1). {10.6}
- Anthropogenic influences have very likely contributed to Arctic sea ice loss since 1979. There is low confidence in the scientific understanding of the small observed increase in Antarctic sea ice extent due to the incomplete and competing scientific explanations for the causes of change and low confidence in estimates of internal variability in that region (see Figure SPM.6). {10.5}
- Anthropogenic influences likely contributed to the retreat of glaciers since the 1960s and to the increased surface mass loss of the Greenland ice sheet since 1993. Due to a low level of scientific understanding there is low confidence in attributing the causes of the observed loss of mass from the Antarctic ice sheet over the past two decades. {4.3, 10.5}
- It is likely that there has been an anthropogenic contribution to observed reductions in Northern Hemisphere spring snow cover since 1970. {10.5}
- It is very likely that there is a substantial anthropogenic contribution to the global mean sea level rise since the 1970s. This is based on the high confidence in an anthropogenic influence on the two largest contributions to sea level rise, that is thermal expansion and glacier mass loss. {10.4, 10.5, 13.3}
- There is high confidence that changes in total solar irradiance have not contributed to the increase in global mean surface temperature over the period 1986 to 2008, based on direct satellite measurements of total solar irradiance. There is medium confidence that the 11-year cycle of solar variability influences decadal climate fluctuations in some regions. No robust association between changes in cosmic rays and cloudiness has been identified. {7.4, 10.3, Box 10.2}
Climate Change 2013: The Physical Science Basis Summary for Policymakers [pdf]