Another record high for NOAA Annual Greenhouse Gas Index in 2025 – Long-lived greenhouse gases trapped 56 percent more heat than in 1990 – Carbon dioxide reached 425.62 ppm, and its rate of increase has accelerated to 2.5 ppm per year
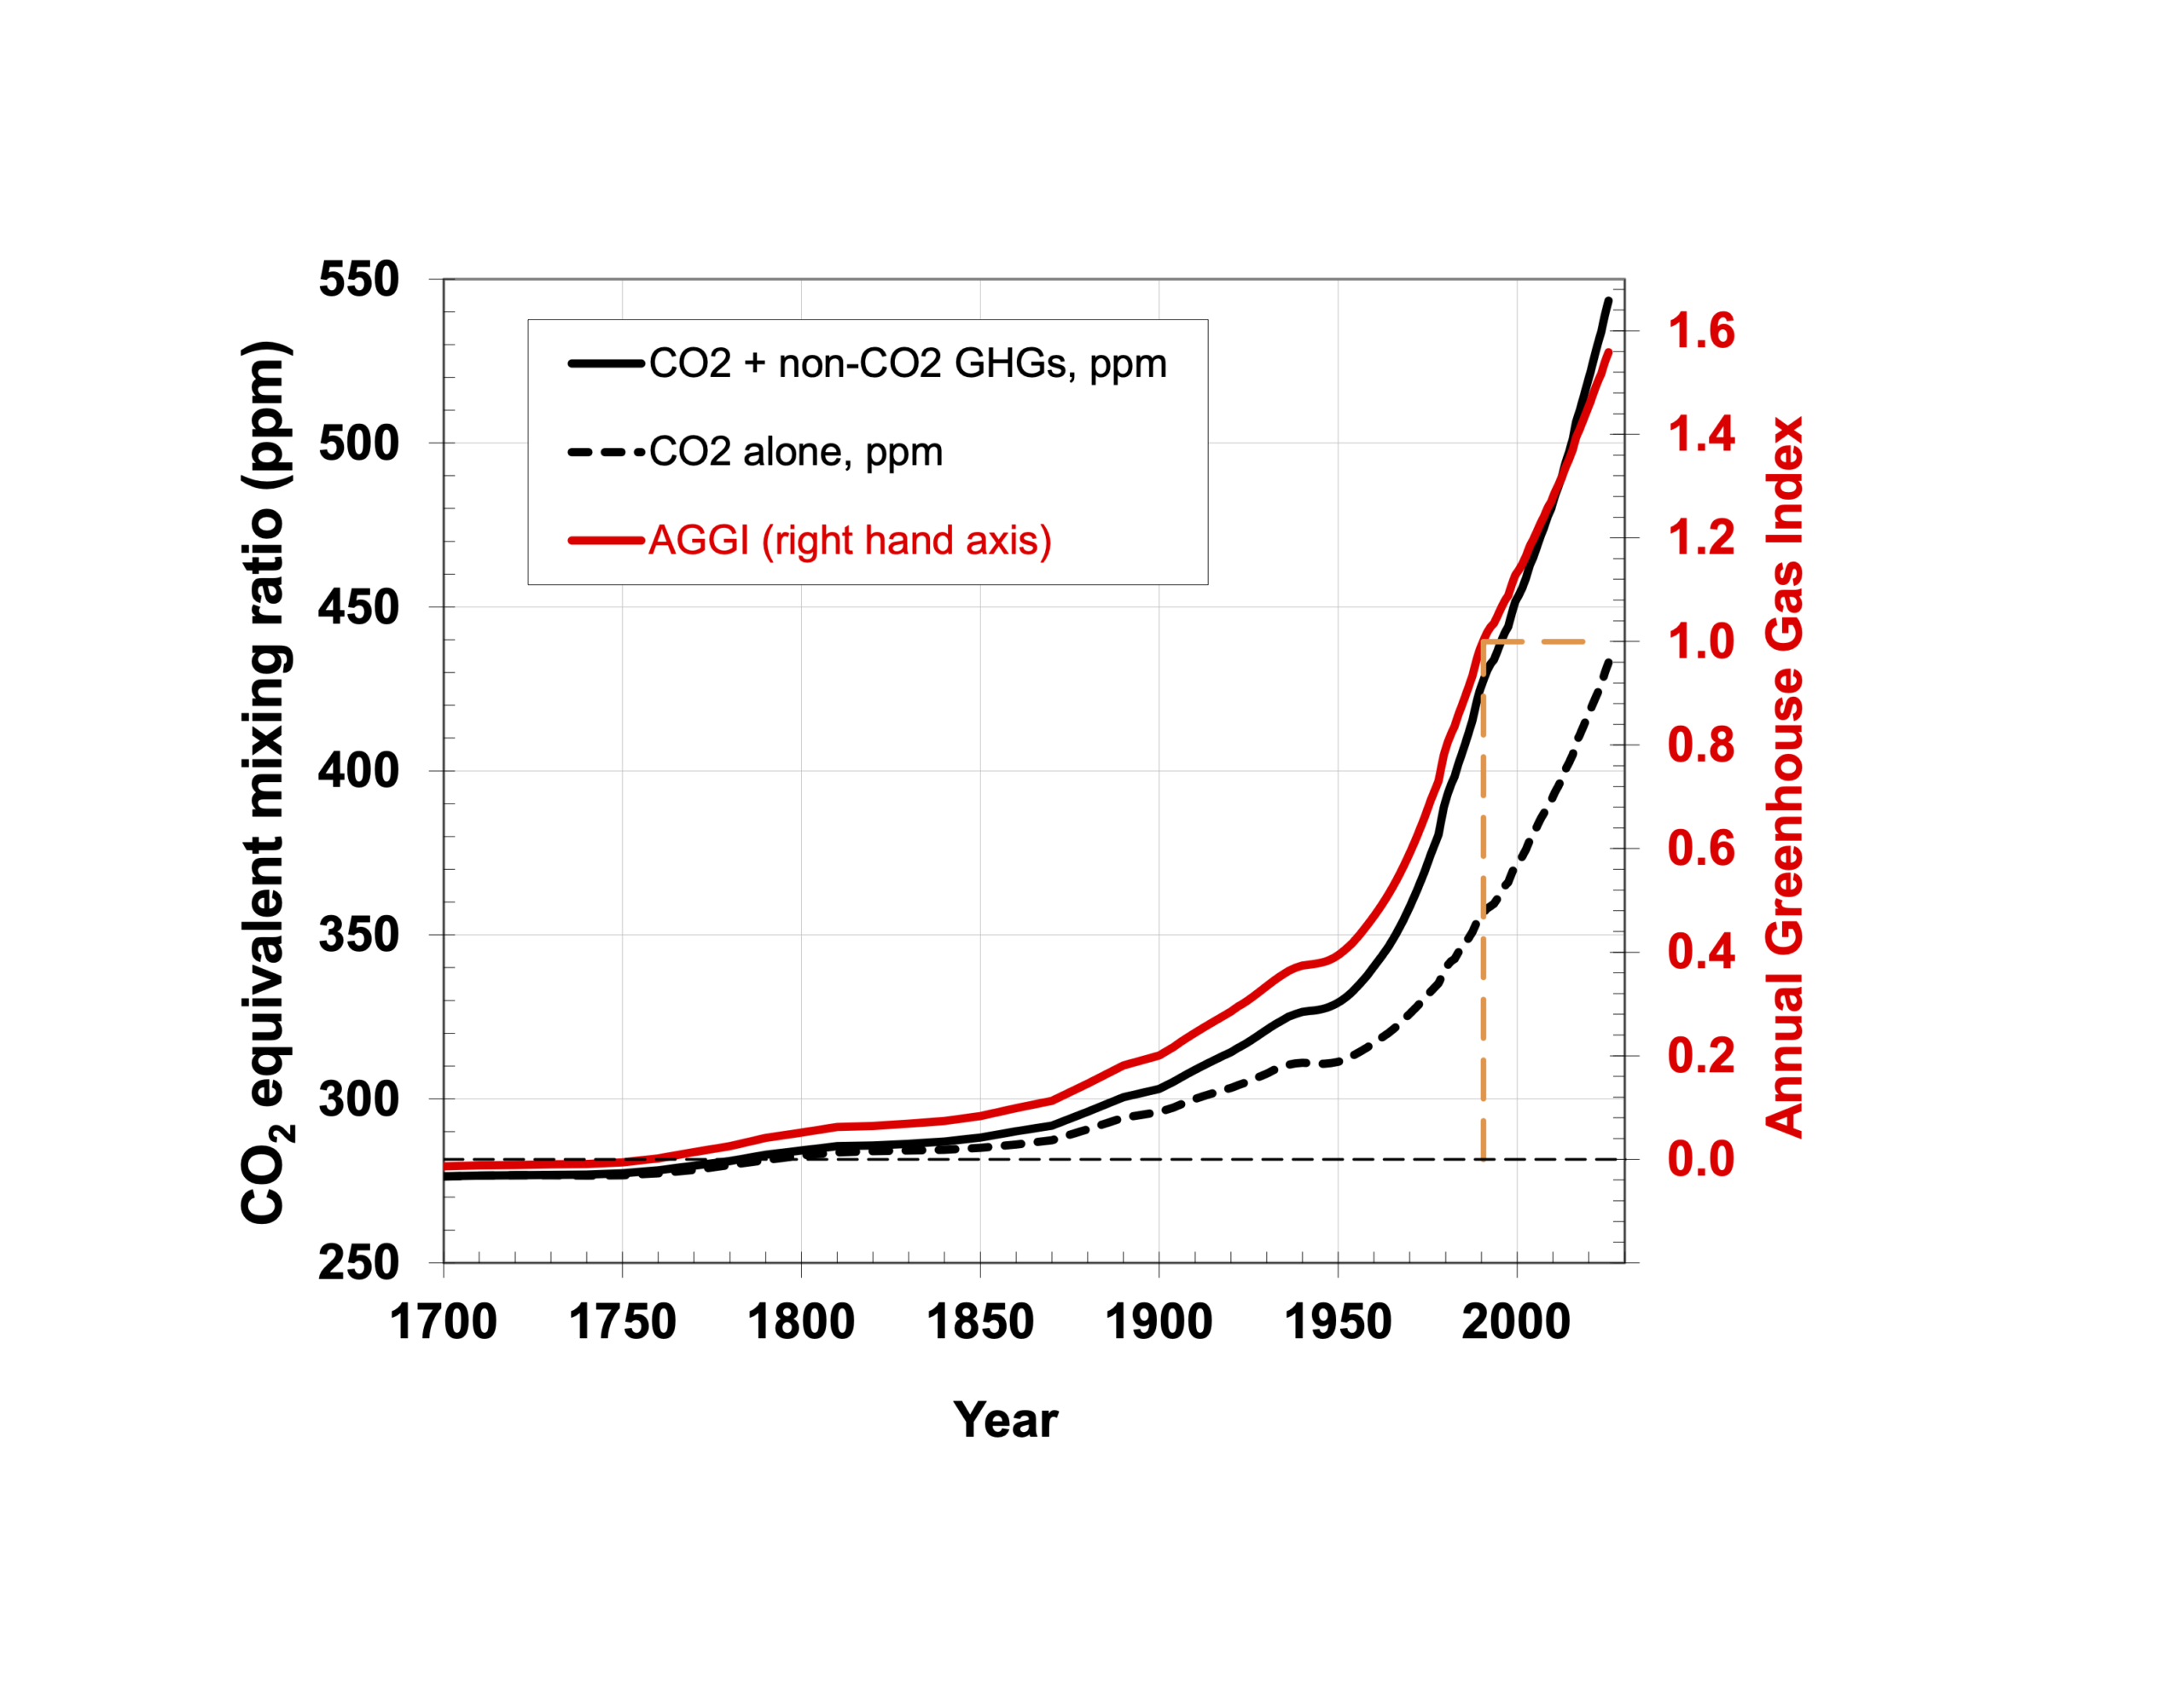
21 October 2026 (NOAA) – The AGGI quantifies radiative forcing from long-lived trace gases and its change over time. The index is derived from NOAA GML’s long-term measurements of greenhouse gas abundances in the remote atmosphere at sites across the globe; it is formulated to provide an understanding of the change in radiative forcing in any given year relative to 1990, which was an important reference year in early global climate agreements. Results from this year’s AGGI show that radiative forcing from changes in atmospheric abundances of long-lived greenhouse gases is 56 percent greater in 2025 than it was in 1990. Carbon dioxide is by far the largest contributor to the increase in radiative forcing.
[…] The NOAA Annual Greenhouse Gas Index (AGGI) is proportional to the change in heating by these long-lived gases since the onset of the Industrial Revolution. It is calculated as the ratio of total effective radiative forcing due to these gases in a given year relative to the forcing in 1990. 1990 was chosen as the reference year for the AGGI because it is the baseline year for the Kyoto Protocol, an early climate agreement. For 2025, the AGGI was 1.56, which represents a 56 percent increase in effective radiative forcing from these gases since 1990. Most of this increase (81 percent) stems from the measured atmospheric increase in CO2 over this period.
Observations
[…] NOAA’s measurements show that the mean global abundance of atmospheric CO2 in the remote marine boundary layer reached 425.62 ± 0.05 ppm in 2025 and has increased by an average of 1.94 ppm per year over the past 47 years (1979-2025). The decadal increase in atmospheric CO2 is accelerating: while it averaged about 1.6 ppm per year in the 1980s and 1.5 ppm per year in the 1990s, it averaged 2.5 ppm per year during the last decade (2016-2025). The CO2 increase from January 1, 2025 to January 1, 2026 measured by NOAA was 2.06 ± 0.08 ppm.
Measurements of air in bubbles trapped in ice cores indicate that global average CO2 abundance was stable at 270 – 280 ppm between the end of the last ice age and around 1850 at the start of the Industrial Revolution [IPCC, 2021]. After that time CO2 began rising in proportion to emissions resulting from fossil fuel combustion [Friedlingstein et al., 2025]. Only half of the CO2 arising from fuel combustion has stayed in the atmosphere, with the other half being absorbed primarily by the global oceans and, more recently, by land ecosystems [e.g., Ballantyne, et al., 2012]. […]
The mean global abundance of atmospheric methane (CH4) in the remote marine boundary layer reached 1936.03 ± 0.48 ppb in 2025, which is more than 2.5 times higher than its preindustrial value in 1750. Methane’s rate of increase in the atmosphere has varied throughout the ongoing measurement record, which began in 1983. While methane’s rate of increase averaged 8.8 ± 4.1 ppb yr-1 from 1983 through 1998, methane’s mean abundance was nearly constant from 1999 to 2006. Starting in 2007, methane’s abundance increased again and peaked at a mean of 15.2 ± 2.4 ppb yr-1 during 2020-2022. Since 2022, methane’s increase has been slightly less rapid: from 2023 through 2025, its increase averaged 7.0 ± 2.0 ppb yr-1, and the rate during 2025 was 4.77 ± 0.43 ppb yr-1.
The processes responsible for the post-2007 increase in atmospheric methane are not fully understood. However, measurements in a subset of our air samples of methane’s carbon-13:carbon-12 ratio demonstrate that the global methane increase since 2007 is largely the result of biogenic or “microbial” processes such as those coming from wetlands and/or agriculture (e.g., farm animals and rice), and not primarily from the increase in global use of fossil fuels, particularly natural gas (which is >90 percent methane) [Schaefer et al., 2016; Nisbet et al., 2019; Lan et al., 2021; Basu et al., 2022; Michel et al., 2024; Riddle-Young et al., 2025].
The mean global abundance of the long-lived gas nitrous oxide (N2O) in the marine boundary layer also continues to grow over time and in 2025 reached 338.86 ± 0.02 ppb. The annual increase during 2025 (1.23 ± 0.01 ppb yr-1) was tied with 2022 and 2014 as being the 3rd fastest measured by NOAA since measurements began in 2001; faster increases have only been measured during 2020 (1.32 ± 0.11 ppb yr-1) and 2021 (1.29 ± 0.02 ppb yr-1). While the rate of increase in atmospheric N2O is variable from year to year, it has increased on average throughout the measurements period; the mean increase during the past decade was 1.09 ± 0.20 ppb yr-1 while during the first decade of measurements it averaged 0.78 ± 0.18 ppb yr-1. Emissions of N2O arise from natural and anthropogenic processes; anthropogenic N2O emissions have increased substantially (40 percent or 1.9 Tg N yr-1) in the past 4 decades (1980–2020), with the vast majority of that increase coming from agricultural-related activities (Tian et al., 2024).
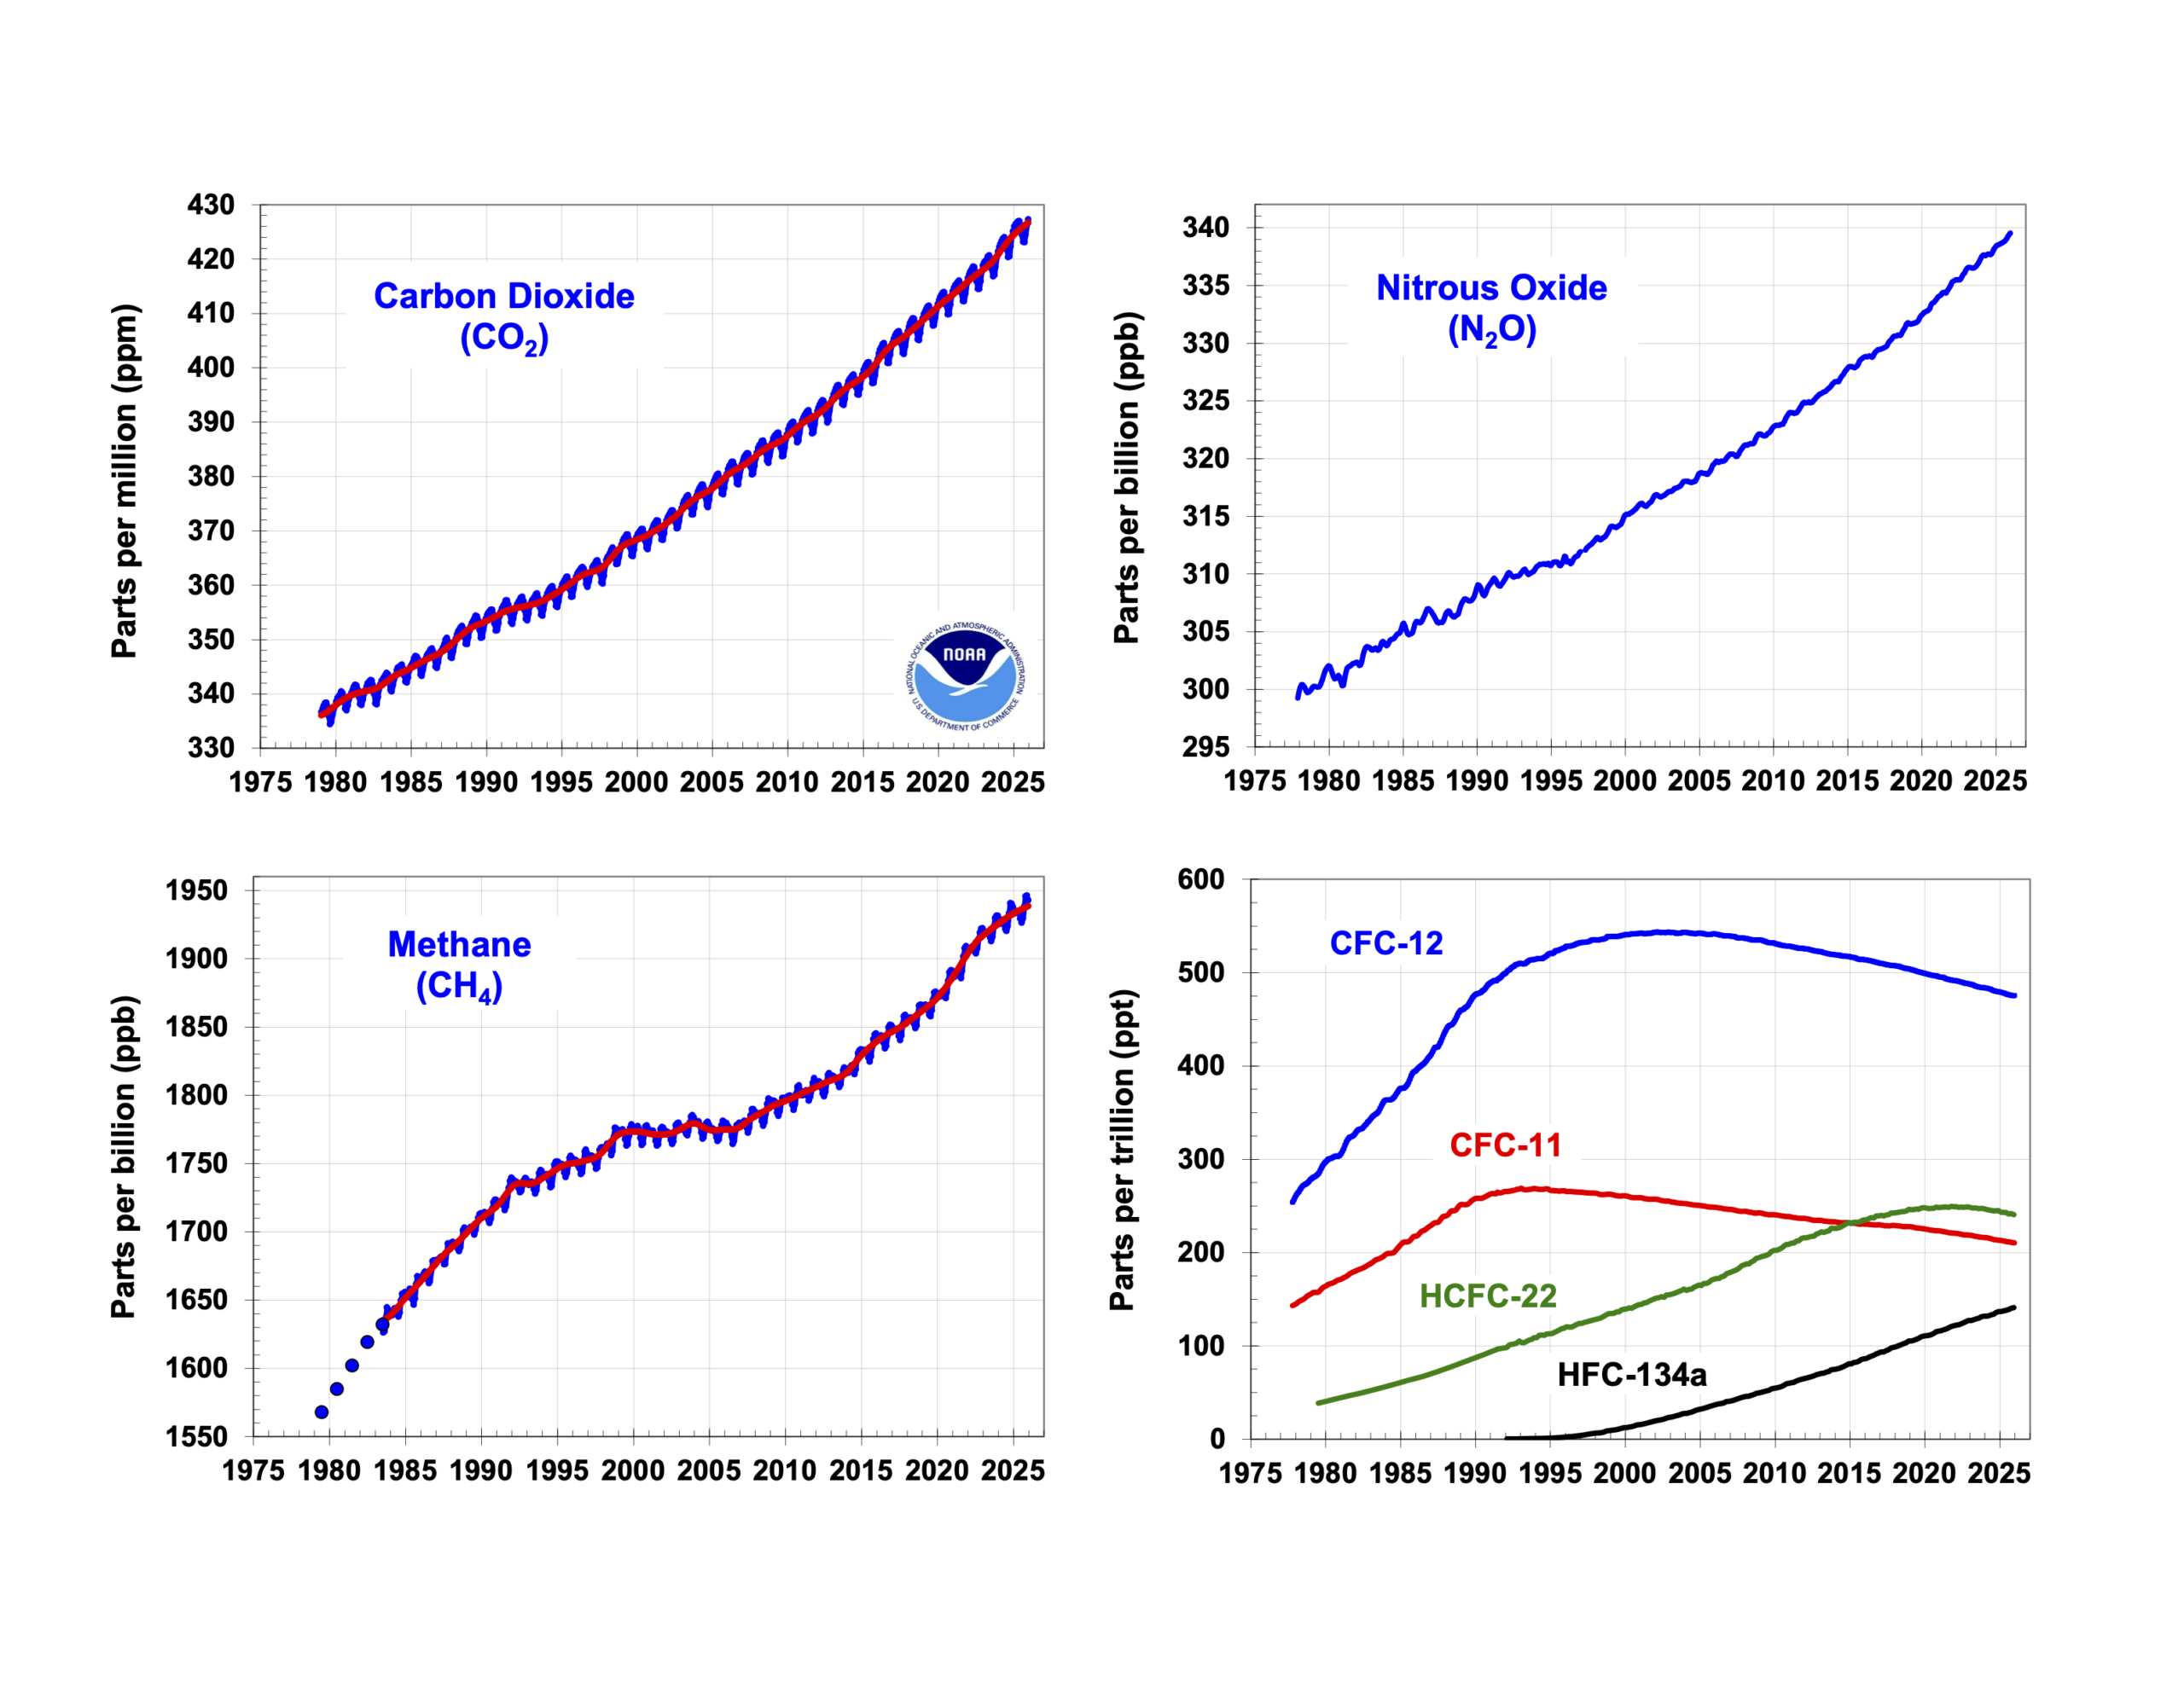
Among the minor greenhouse gases measured by NOAA GML, the main contributors to radiative forcing are the CFCs. The global surface atmospheric abundances of the three most abundant CFCs were all decreasing by the mid-2000s and have since continued to decline. This decrease has persisted even as CFC-11 emissions temporarily increased from 2013 to 2018 [Montzka et al., 2021]. After 2018, CFC-11 emissions rapidly dropped and have since been slowly decreasing. The atmospheric abundances of HCFCs, which are first generation substitutes for CFCs, have recently peaked and started to decline (Western et al., 2024). Overall atmospheric trends measured for the CFCs and HCFCs reflect large declines in emissions in response to global controls on production and trade of these gases by the fully adjusted and amended Montreal Protocol on Substances that Deplete the Ozone Layer. Atmospheric abundances of all but one saturated HFCs continue to increase in the global atmosphere (Liang et al., 2022); the abundance of HFC-365mfc has decreased since 2022 perhaps owing to controls on HFC production in the Kigali Amendment to the Montreal Protocol.
2025 Results
NOAA’s measurements of atmospheric composition change indicate that the AGGI reached the value of 1.56 in 2025. This value represents a 56 percent increase in effective radiative forcing arising from long-lived gases since 1990. In absolute terms, this increase equates to an additional 3.59 W m-2 of heat being retained by Earth’s climate system relative to preindustrial times.
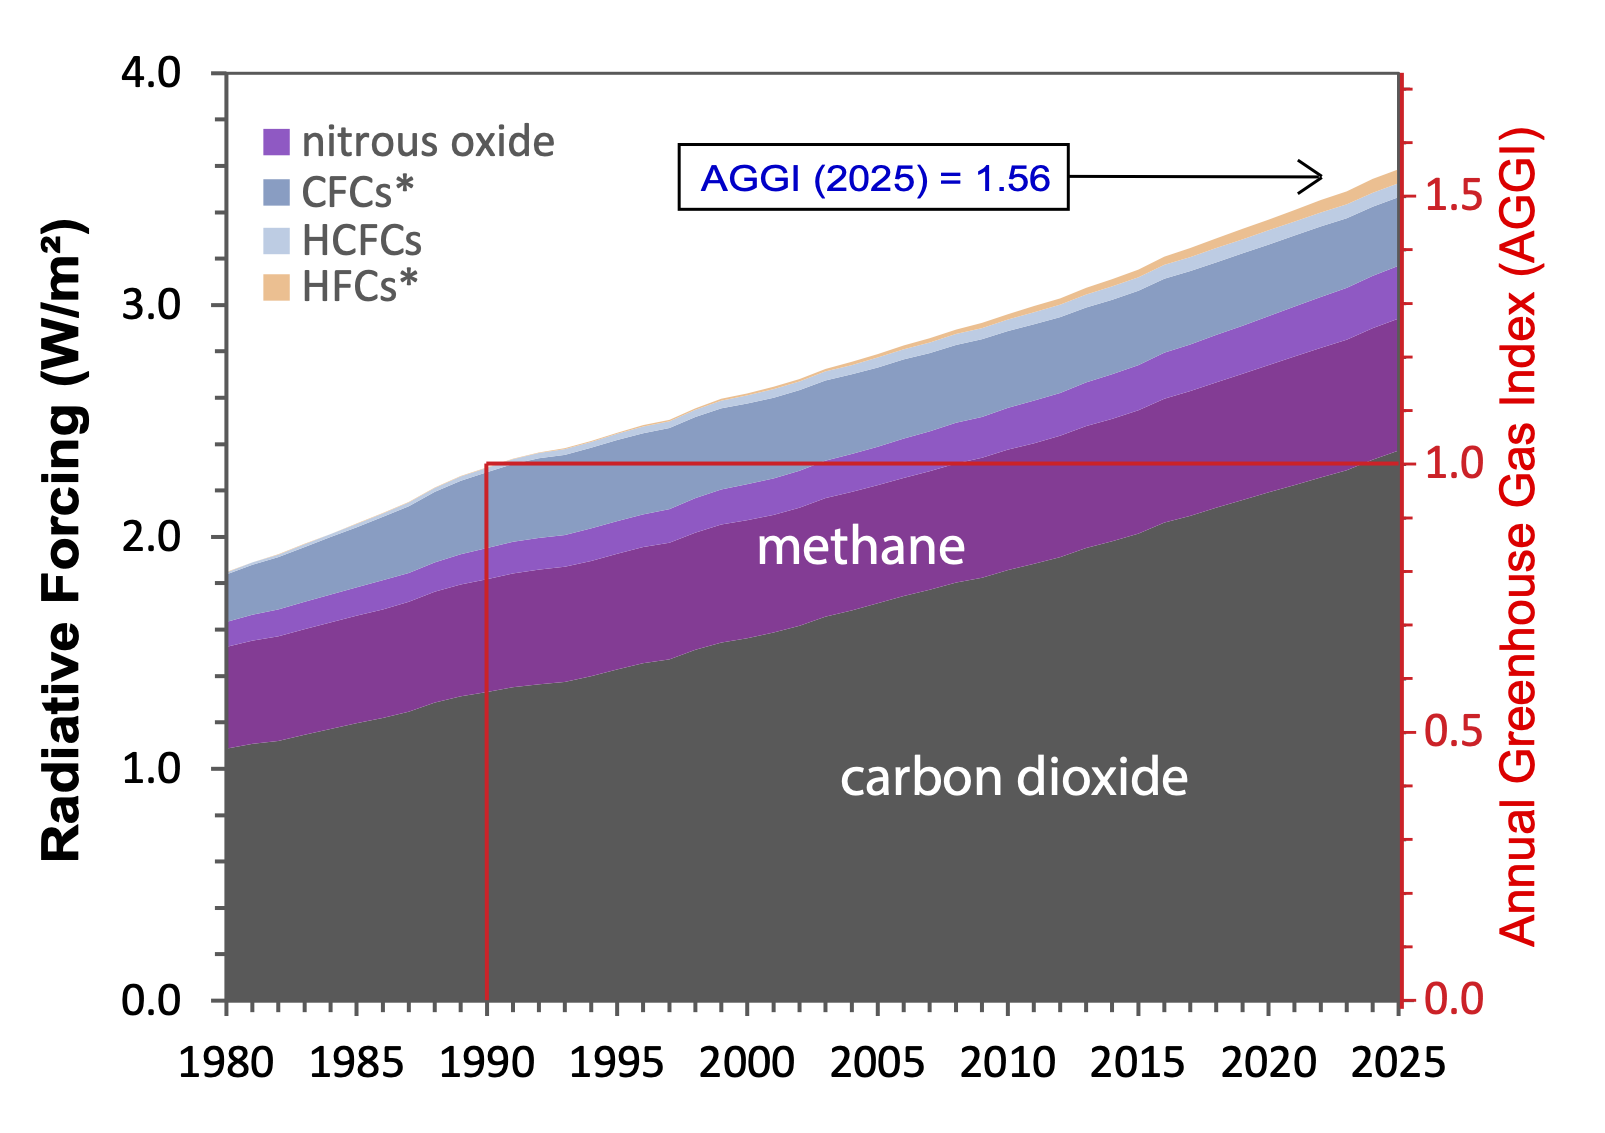
Radiative forcing from the main long-lived gases (CO2, CH4, N2O) and groupings of minor gases (CFCs, HCFCs, and the HFCs primarily) is shown through 2025 in Figure 3. Carbon dioxide was by far the largest contributor to effective radiative forcing from these gases (2.37 W m-2 or 66 percent of the total) and methane was the second largest contributor (0.57 W m-2 or 16 percent of the total).
The atmospheric abundance and effective radiative forcing of the three main long-lived greenhouse gases continue to increase. While the combined effective radiative forcing of these and all the other long-lived, well-mixed greenhouse gases included in the AGGI rose 56 percent from 1990 to 2025 (by ~1.29 W m-2), CO2 has accounted for about 81 percent of this increase (~1.0 W m-2), which makes it by far the largest contributor to increases in effective radiative forcing from long-lived gases since 1990. The second largest contributor to the increase since 1990 was N2O with a 0.096 W m-2 increase, followed by methane with a 0.083 W m-2 increase.
While radiative forcing from CFCs and related gases (CFC* in Figure 3) has declined in recent years, the warming influence from this group of chemicals remains larger than the combined warming influence from both the first- and second-generation substitutes (HCFCs plus HFCs). Over the past decade, cumulative radiative forcing from these three chemical classes has changed very little (< 0.01 W m-2), as the declines from CFCs and, in recent years, for HCFCs have been offset by increases overall from HFCs. Of the ozone-depleting gases and their substitutes, the largest contributors to effective radiative forcing in 2025 were CFC-12, followed by CFC-11, HCFC-22, HFC-134a, and CFC-113. While the radiative forcing from HFCs is currently small relative to all other greenhouse gases (1.7 percent in 2025), the potential for large future increases led to the adoption of controls on HFC production in the Kigali Amendment to the Montreal Protocol.
| Year | CO2 | CH4 | N2O | CFCs* | HCFCs | HFCs* | Total (W m-2) | CO2-eq (ppm) | AGGI | % change |
|---|---|---|---|---|---|---|---|---|---|---|
| 2016 | 2.062 | 0.535 | 0.199 | 0.318 | 0.059 | 0.036 | 3.209 | 507 | 1.395 | 2.4 |
| 2017 | 2.092 | 0.538 | 0.201 | 0.316 | 0.060 | 0.039 | 3.245 | 510 | 1.410 | 1.6 |
| 2018 | 2.125 | 0.541 | 0.205 | 0.314 | 0.060 | 0.041 | 3.287 | 514 | 1.428 | 1.8 |
| 2019 | 2.159 | 0.544 | 0.208 | 0.312 | 0.061 | 0.044 | 3.328 | 518 | 1.446 | 1.8 |
| 2020 | 2.192 | 0.549 | 0.212 | 0.309 | 0.061 | 0.047 | 3.369 | 522 | 1.464 | 1.8 |
| 2021 | 2.223 | 0.554 | 0.216 | 0.306 | 0.061 | 0.050 | 3.410 | 526 | 1.482 | 1.8 |
| 2022 | 2.256 | 0.560 | 0.219 | 0.303 | 0.061 | 0.053 | 3.453 | 531 | 1.501 | 1.9 |
| 2023 | 2.287 | 0.564 | 0.223 | 0.301 | 0.061 | 0.056 | 3.491 | 534 | 1.517 | 1.6 |
| 2024 | 2.333 | 0.567 | 0.226 | 0.298 | 0.060 | 0.059 | 3.543 | 540 | 1.540 | 2.3 |
| 2025 | 2.372 | 0.569 | 0.229 | 0.295 | 0.060 | 0.062 | 3.587 | 544 | 1.559 | 1.9 |
A broader context
Changes in radiative forcing before 1978 are derived from atmospheric measurements of CO2, started by C.D. Keeling [Keeling et al., 1958], and from measurements of CO2 and other greenhouse gases in air trapped in snow (firn) and ice in Antarctica and Greenland [Etheridge et al., 1996; 1998; Butler et al., 1999]. These results define atmospheric composition changes going back to 1750 and radiative forcing changes since pre-industrial times (Figure 4). This longer-term view shows how increases in greenhouse gas abundances over the past ~70 years (since 1950) have accounted for nearly three-fourths of the total increase in the AGGI over the past 270 years. It also shows how the long-term change has been dominated by changes in atmospheric CO2 abundances.
While the AGGI is presented as an index to provide a straightforward (i.e., nondimensional) representation of changes in the radiative forcing supplied by long-lived gases since 1990, there is value in considering the absolute heat being added to Earth’s climate system from these greenhouse gases at their current abundances. The extra 3.59 W m-2 of warming influence supplied in 2025 by the increased abundances of long-lived greenhouse gases relative to pre-industrial time represents approximately 1.5 percent of the heat intercepted by the Earth from the Sun on an ongoing basis (240 W m-2) after accounting for the energy reflected back to space (planetary albedo = 0.294; Williams, 2024). [more]