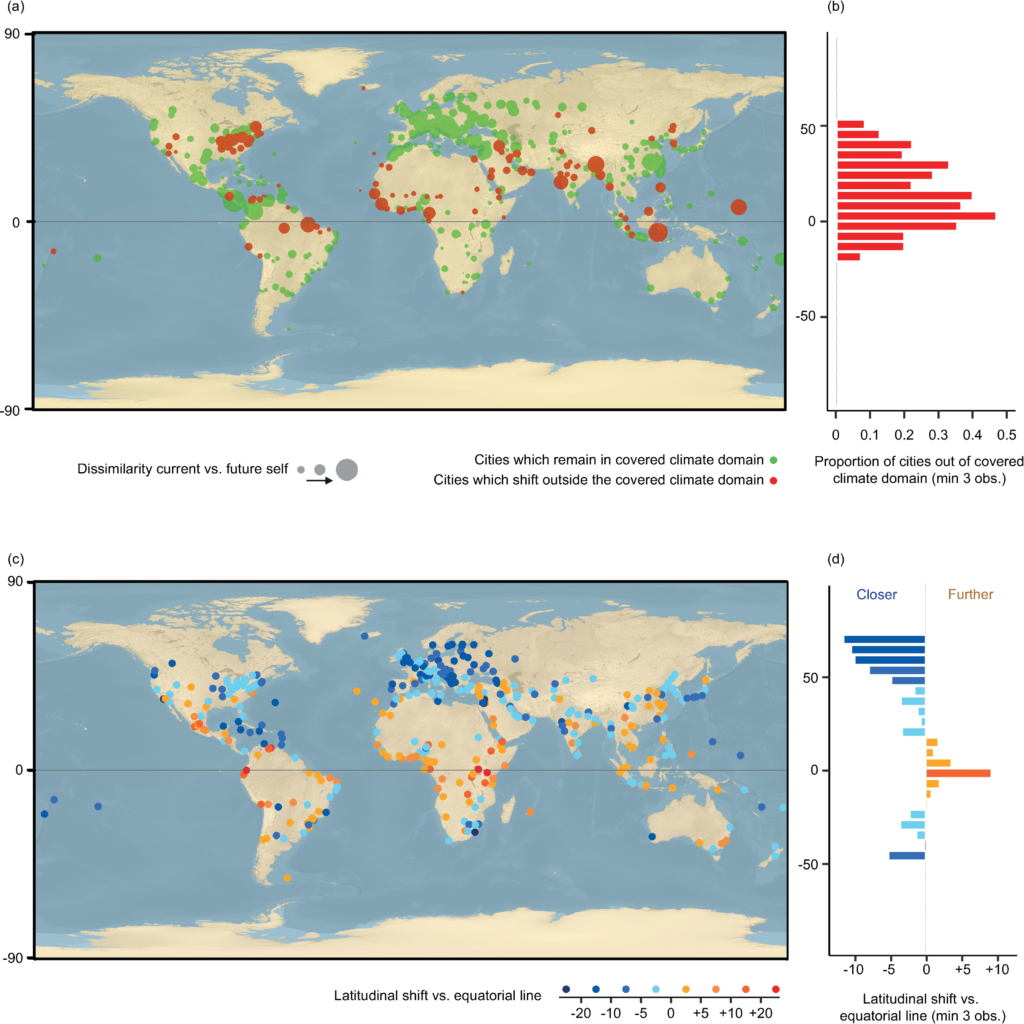
Extent of climate changes in major cities of the world by 2050. a, b, the extent of change in climate conditions. Cities predicted to have climates that no major city has experienced before are colored in red (mostly within the tropics). Cities for which future climate conditions reflect current conditions in other major cities of the world are shown in green. The size of the dots represents the magnitude of change between current and future climate conditions. b, The proportion of cities shifting away from the covered climate domain (concentrated in the tropics). c,d, The extent of latitudinal shifts in relation to the equatorial line. Cities shifting towards the equator are colored with a blue gradient (mostly outside the tropics), while cities shifting away from the equator are colored with a yellow to red gradient (mostly within the tropics). d, A summary of the shift by latitude is illustrated in a barchart, with shifts averaged by bins of 5 degrees. Graphic: Bastin, et al., 2019 / PLOS ONE

By Stephen Leahy
10 July 2019

(National Geographic) – Climate forecast for 2050: New York City winters will have the weather of today’s Virginia Beach, damp and cold London will be hot and dry like Barcelona, wet Seattle will be like drier San Francisco, and Washington D.C. will be more like today’s Nashville but with even greater variation in temperatures and precipitation. Those predictions are according to the first global analysis of how some cities’ climate conditions will shift under climate change.

“We wanted to know what’s the most conservative estimate of what the climate will be for 520 major cities in 2050,” said Tom Crowther, a researcher at ETH Zürich, and senior author of the study published today in the peer-reviewed science journal PLOS ONE.

“The changes we found are huge,” Crowther says in an interview.

To illustrate their findings the Crowther Lab in Switzerland created a global data map that pairs one city’s future climate conditions with current ones. For example Minneapolis in 2050 will be more like Kansas City, with Minneapolis’s warmest month shooting up from around 80 degrees Fahrenheit on average to more than 90F in 2050.

Generally speaking, cities in the Northern Hemisphere will have the climates cities more than 620 miles to their south have today, he said.
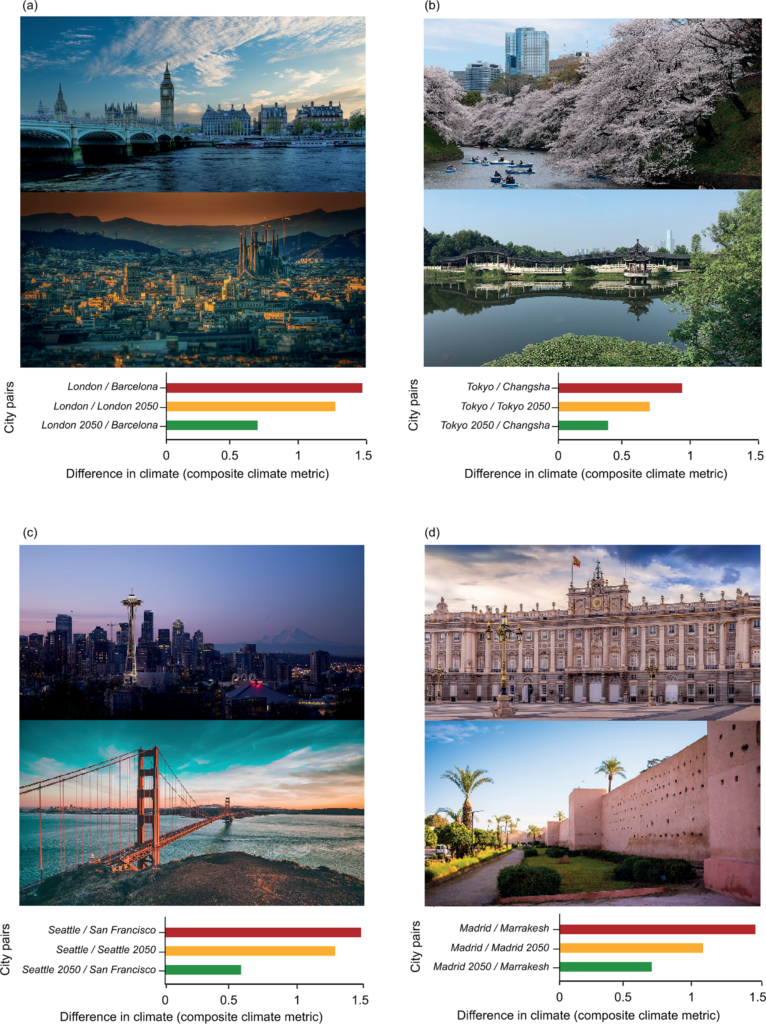
Future cities and similar current climate counterpart. Difference between future and current climate for four cities and an example of their similar current counterpart. Illustration of the results of the analysis for London (a; counterpart: Barcelona), Buenos Aires (b; counterpart: Sidney), Nairobi (c; counterpart:Beirut) and Portland (d; counterpart:San Antonio). The red bar represents the difference between the current climate of the city of interest (e.g. London in (a)) and the current climate of the city to which the city of interest (e.g. London in (a)) will have the most similar climate by 2050 (e.g. Barcelona in (a)). The yellow bar the difference between the current and future climate of the city of interest (e.g. current London and London 2050 in (a)). The green bar represents the difference between the future climate of the city of interest (London 2050) and the current climate of the most similar counterpart (e.g. Barcelona in (a)). Graphic: Bastin, et al., 2019 / PLOS ONE

In Europe, summers and winters will get considerably warmer by 2050, with average increases of 3.5°C and 4.7°C, respectively, compared with 2000.

There are no good pairings or analogues for more than 22 percent of the world’s major cities—those with one million or more people currently, researchers found. Those 115 cities, including Washington and 16 other U.S. cities, will have unprecedented climate conditions by 2050 compared to what they saw in 2000, the baseline for the study.

That doesn’t mean that Washington will be hotter than Riyadh, Saudi Arabia, today. It means that there is no current match for the wide climate variations in temperatures, seasonality, and precipitation the city will experience, said Crowther.

The vast majority of the 115 cities that will experience “novel” climates are in the tropics and include metropolises like Kuala Lumpur, Jakarta, Rangoon, and Singapore. Changes in tropical cities will be less in terms of temperature increases, but will be dominated by more frequent extreme precipitation events and the severity and intensity of droughts.

“The fate of major tropical cities remains uncertain as many will experience unprecedented climate conditions,” the study concludes. [more]

By 2050, many U.S. cities will have weather like they’ve never seen
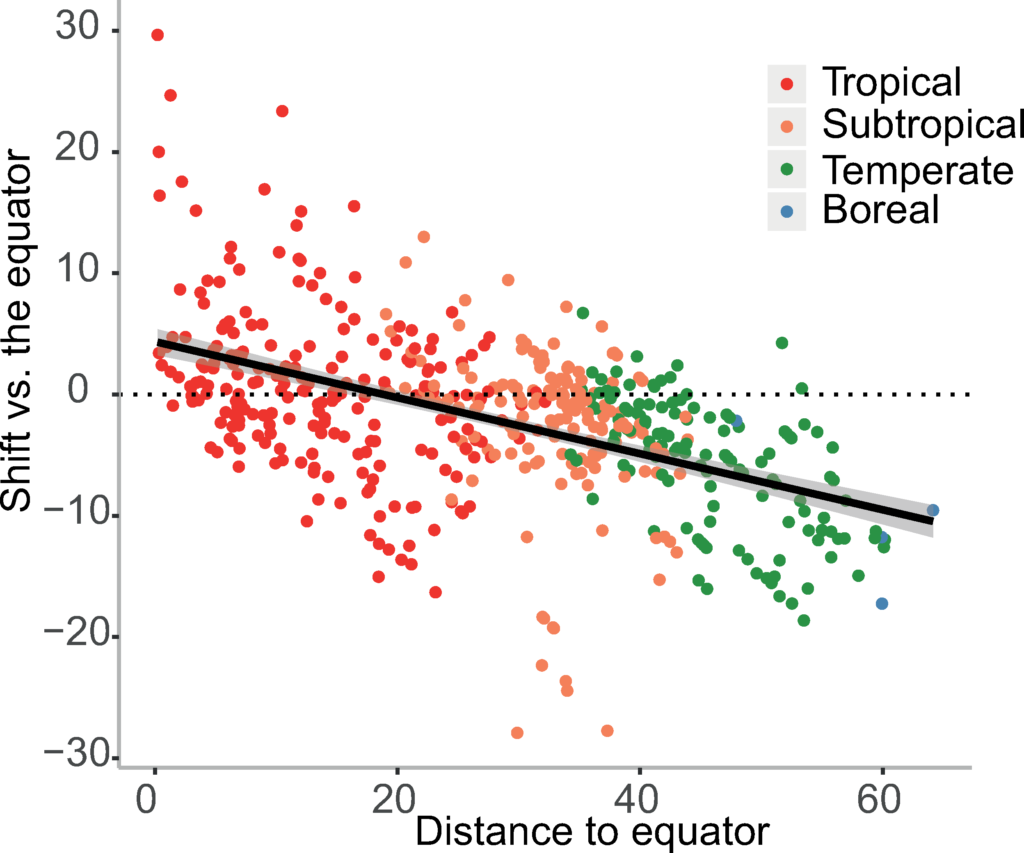

Latitudinal shift of cities relative to their distance to the equator (in degrees). Cities below 20 degrees North/South tend to move away from the equator (positive latitudinal shift) while cities beyond 20 degrees North/South tend to move closer to the equator (negative latitudinal shift). Cities are colored according to the aggregated ecoregion of the world to which they belong, with the tropical in red, the subtropical in orange, the temperate in green and the boreal in blue. Graphic: Bastin, et al., 2019 / PLOS ONE

Understanding climate change from a global analysis of city analogues
ABSTRACT: Combating climate change requires unified action across all sectors of society. However, this collective action is precluded by the ‘consensus gap’ between scientific knowledge and public opinion. Here, we test the extent to which the iconic cities around the world are likely to shift in response to climate change. By analyzing city pairs for 520 major cities of the world, we test if their climate in 2050 will resemble more closely to their own current climate conditions or to the current conditions of other cities in different bioclimatic regions. Even under an optimistic climate scenario (RCP 4.5), we found that 77% of future cities are very likely to experience a climate that is closer to that of another existing city than to its own current climate. In addition, 22% of cities will experience climate conditions that are not currently experienced by any existing major cities. As a general trend, we found that all the cities tend to shift towards the sub-tropics, with cities from the Northern hemisphere shifting to warmer conditions, on average ~1000 km south (velocity ~20 km.year-1), and cities from the tropics shifting to drier conditions. We notably predict that Madrid’s climate in 2050 will resemble Marrakech’s climate today, Stockholm will resemble Budapest, London to Barcelona, Moscow to Sofia, Seattle to San Francisco, Tokyo to Changsha. Our approach illustrates how complex climate data can be packaged to provide tangible information. The global assessment of city analogues can facilitate the understanding of climate change at a global level but also help land managers and city planners to visualize the climate futures of their respective cities, which can facilitate effective decision-making in response to on-going climate change.

Understanding climate change from a global analysis of city analogues