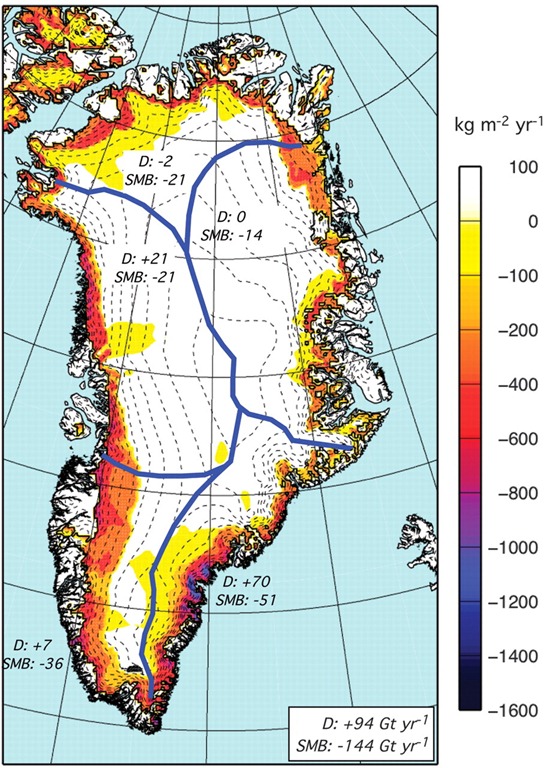
Graph of the Day: Changes in Greenland Ice Sheet Mass Distribution, 2003-2008
Distribution of 2003–2008 mass changes across the ice sheet. The period (2003–2008) was chosen to coincide with the GRACE and IceSAT epochs. Numbers indicate basin-integrated mass loss rates due to SMB and D (in Gt year–1). Numbers in the lower right corner represent the values for the whole ice sheet, indicating the dominant surface contribution to GrIS mass loss during 2003–2008. Colors represent the rate of surface mass change. To mimic the spatial distribution of GrIS mass loss during the GRACE and ICESat (Ice, Cloud, and Land Elevation Satellite) operational period, we performed a linear regression on 2003–2008 cumulative anomalies of D and SMB components, integrated over five major drainage basins (north, northeast, southeast, southwest, and northwest; fig. S2). The contributions from D and SMB to the basin-integrated mass change are given as numbers in Fig. 3, whereas the contributions from individual SMB components are listed in table S1. …
Michiel van den Broeke, et al., Partitioning Recent Greenland Mass Loss, Science 13 November 2009: Vol. 326. no. 5955, pp. 984 – 986, DOI: 10.1126/science.1178176
