Marker for the collapse of key Atlantic current discovered – “We are approaching the tipping point”
By Stephanie Pappas
9 February 2024
(Live Science) – Scientists have discovered a key warning sign before a crucial Atlantic current collapses and plunges the Northern Hemisphere into climate chaos.
The Atlantic Meridional Overturning Circulation (AMOC) carries warm water north from the Southern Hemisphere, where it releases heat and freezes. The freezing process concentrates salt in the non-frozen portion of the ocean water; this extra-saline water sinks, travels back south and picks up heat again, restarting the conveyor belt. (The Gulf Stream is part of this belt.)
This release of heat helps keep Europe, and to some extent North America, balmier than it otherwise would be. But sediment records over the past 100,000 years suggest that, at times, the AMOC has shut down abruptly, leading to major climate shifts over mere decades.
Once the Atlantic Ocean circulation collapses, the resulting climate impacts are nearly irreversible on human timescales, as our earlier research has shown.
Prof. Henk Dijkstra, Institute for Marine and Atmospheric Research Utrecht, Utrecht University
Scientists believe we could be veering towards this scenario once again — potentially as early as 2025 — as a result of climate change. However, until now researchers had no way of telling if the current is on the path toward one of these tipping points.
In a new study, published today (Feb. 9) in the journal Science Advances, scientists found that the flow of fresh water into the Atlantic Ocean at a latitude of 34 degrees south (the latitude where South Africa sits) may indicate a key warning sign for an impending AMOC collapse. The team found that about 25 years before the AMOC collapses, this flow reaches a minimum).
Scientists don’t have a long enough record of observations of freshwater flow at this spot to predict how far away the AMOC is from a tipping point right now. However, they do know that this flow has been declining.
“We are approaching the tipping point, but we cannot deduce the distance to the tipping point,” study first author René M. van Westen, a postdoctoral researcher in marine and atmospheric science at Utrecht University, told Live Science.
Because the rising and sinking of the AMOC depends on the salinity of the water, this circulation is very sensitive to influxes of fresh water, van Westen said. As the climate warms and precipitation patterns change, the patterns of freshwater flow into the ocean change, too.
![Surface temperature response during Atlantic Meridional Overturning Circulation (AMOC) collapse. (A) Yearly averaged 2-m surface temperature trend (model years 1750 to 1850). The markers indicate nonsignificant trends [P > 0.05, two-sided t test (23)]. (B) Similar to (A) but now for the February 2-m surface temperature trend. The red dots indicate five different cities used in (C) and (D). Note the different color bar ranges between (A) and (B). (C) Temperature difference (with respect to model year 1600) for five different cities, including the AMOC strength. The trends are determined over model years 1750 to 1850 (yellow shading) during which the AMOC strength strongly decreases. (D) Monthly temperature trends for the five different cities. Graphic: van Westen, et al., 2024 / Science Advances](https://desdemonadespair.net/wp-content/uploads/2024/05/image-43.png)
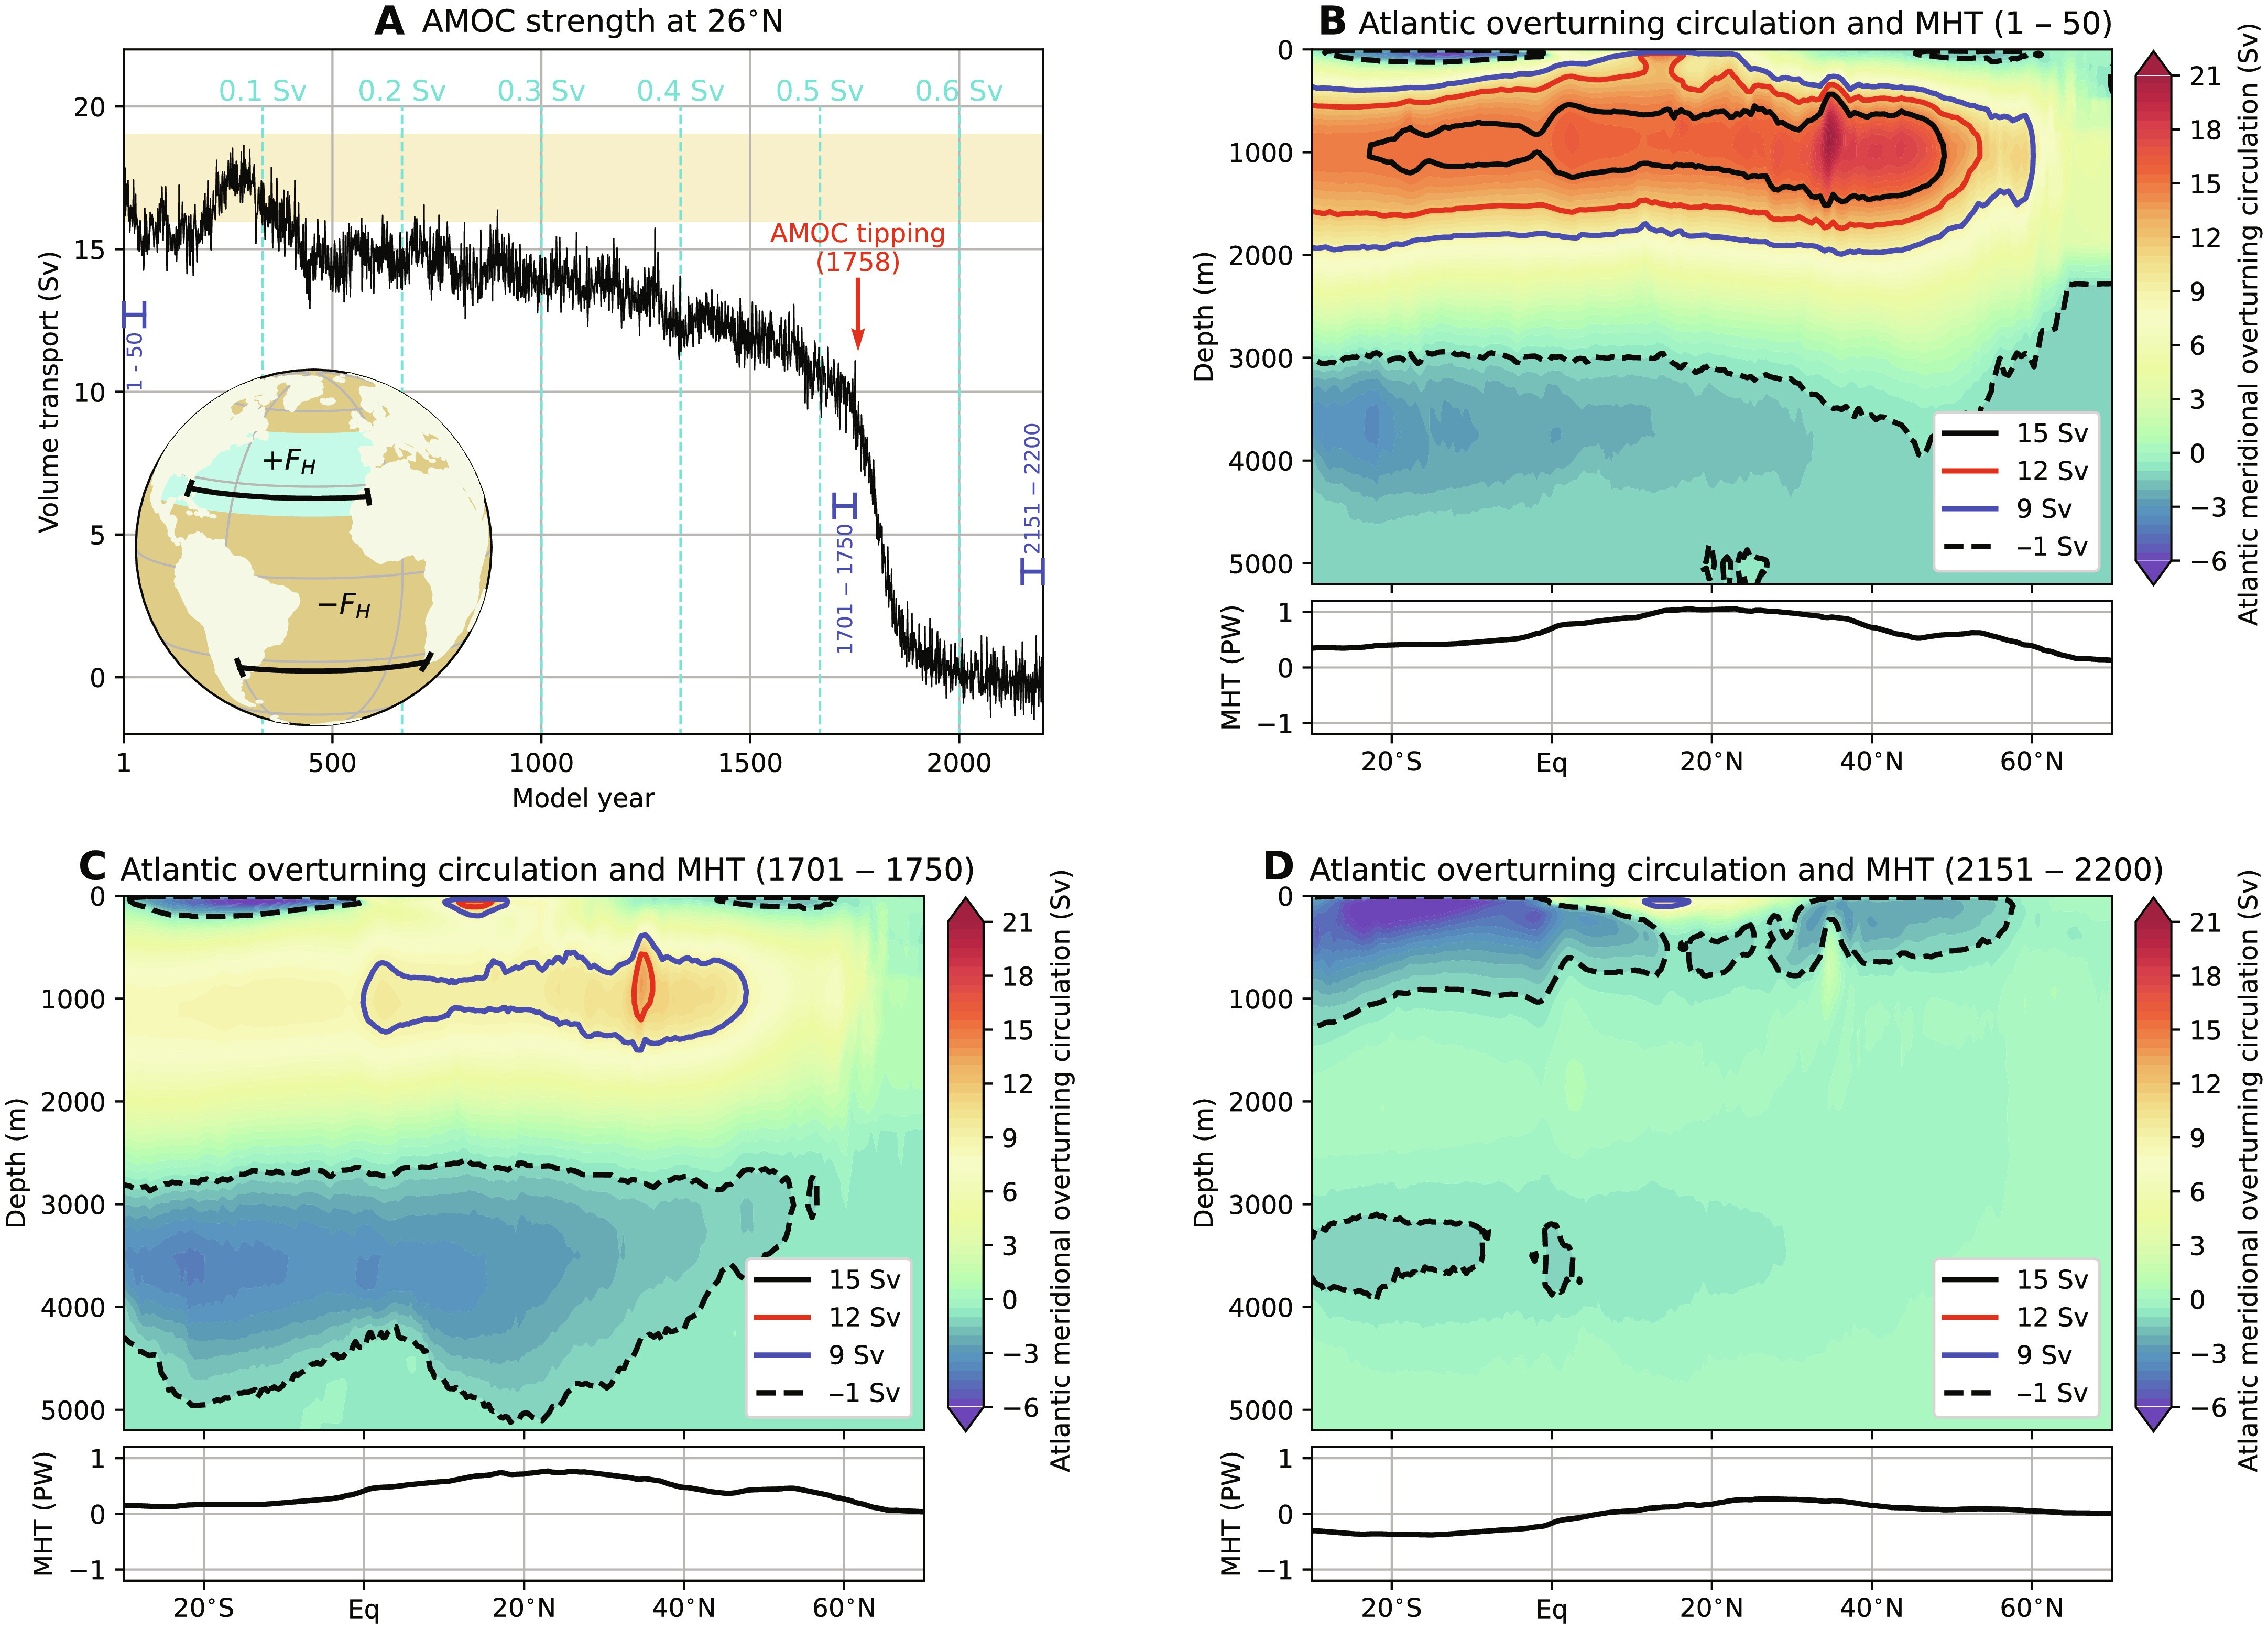
It’s difficult to predict the outcomes, though, and finding the AMOC’s tipping point requires simulating a gradual increase in freshwater flow in the northern Atlantic over more than 2,000 years, van Westen said. This is a long and computationally expensive process, but trying to cut corners by simulating large freshwater pulses is not as realistic or precise.
The researchers modeled this gradual freshwater increase using state-of-the-art climate models. They found a long negative trend in freshwater flow at 34 degrees south — the southern border of the Atlantic Ocean — reaching a minimum about 25 years before the AMOC collapses. The minimum is not tied to a specific salinity value, but rather is relative to the patterns that came before, so researchers aren’t sure how these conditions compare to today’s. The AMOC collapse led to a complete lack of circulation and a loss of about 75% of the heat transport from south to north.
If the AMOC were to collapse in the near future, the consequences would be dire. Without the AMOC, the Northern Hemisphere would get colder, and the southern hemisphere would get warmer, though by a lesser degree . The effects vary by region, but Europe would be hard hit, van Westen said, cooling between 9 and 18 degrees Fahrenheit (5 to 10 degrees Celsius) within a century. That’s a huge swing, even compared with the current level of climate change, which is already having impacts.
“On average, the global climate warms by about 0.2 degrees C [0.36 F] per decade,” van Westen said.
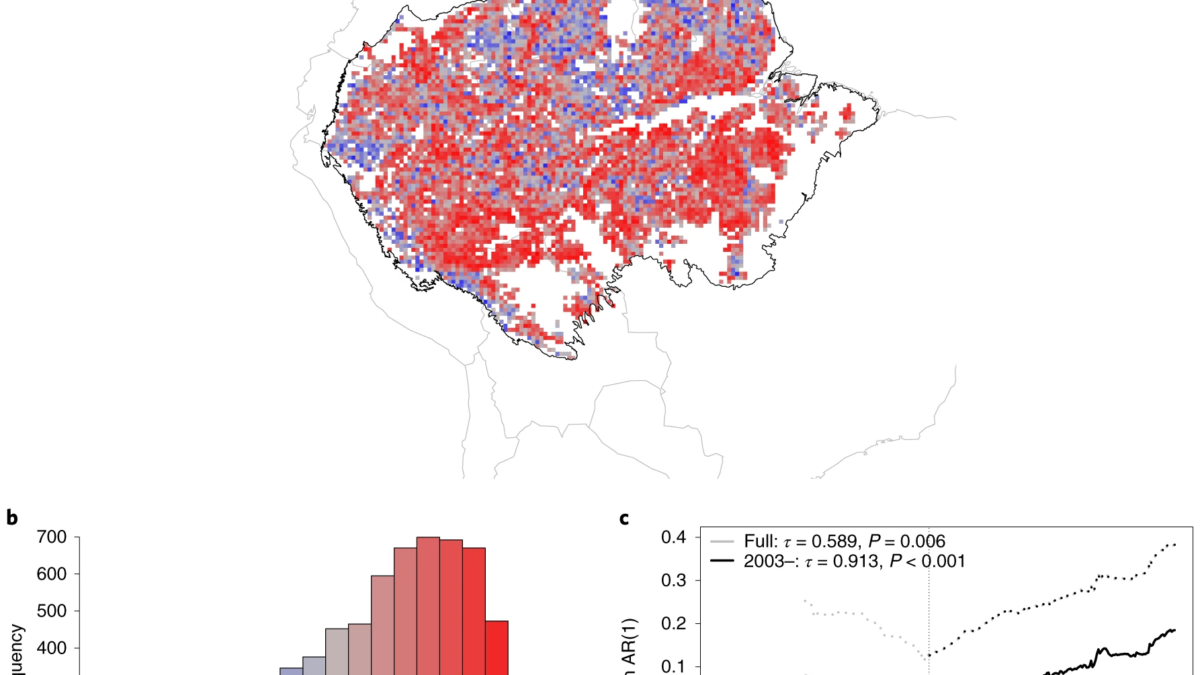
The collapse of the AMOC would also lead to changes in precipitation around the globe. For example, the wet and dry seasons in the Amazon rainforest would swap places, leading to major ecological impacts, the researchers wrote in the paper.
“We know under climate change that this AMOC will gradually weaken and this [freshwater] parameter will become more negative, so it will destabilize the AMOC further,” van Westen says. The message, he added, is that the need to halt climate change is urgent: “We need to stop emitting as a global society.”
‘We are approaching the tipping point’: Marker for the collapse of key Atlantic current discovered
Physics-based early warning signal shows that AMOC is on tipping course
ABSTRACT: One of the most prominent climate tipping elements is the Atlantic meridional overturning circulation (AMOC), which can potentially collapse because of the input of fresh water in the North Atlantic. Although AMOC collapses have been induced in complex global climate models by strong freshwater forcing, the processes of an AMOC tipping event have so far not been investigated. Here, we show results of the first tipping event in the Community Earth System Model, including the large climate impacts of the collapse. Using these results, we develop a physics-based and observable early warning signal of AMOC tipping: the minimum of the AMOC-induced freshwater transport at the southern boundary of the Atlantic. Reanalysis products indicate that the present-day AMOC is on route to tipping. The early warning signal is a useful alternative to classical statistical ones, which, when applied to our simulated tipping event, turn out to be sensitive to the analyzed time interval before tipping.
Physics-based early warning signal shows that AMOC is on tipping course