Record-breaking algae bloom takes aim at Florida beaches – “This year could be the biggest year yet”
By Dinah Voyles Pulver
14 March 2023
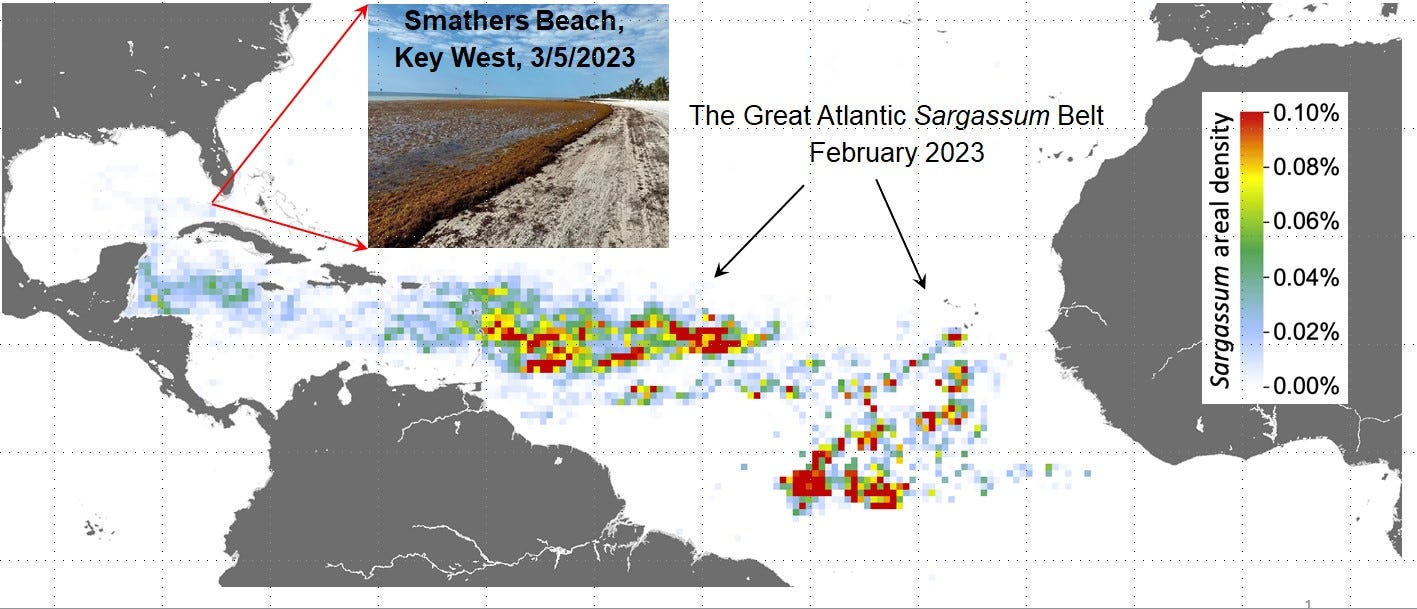
(USA TODAY) – Beachgoers in Florida and the Caribbean could be greeted by heavy blankets of smelly seaweed in the weeks ahead as a 5,000-mile swath of sargassum drifts westward and piles onto white sandy beaches.
Sargassum, a naturally occurring type of macroalgae, has grown at an alarming rate this winter. The belt stretches across the Atlantic Ocean from Africa to Florida and the Yucatan Peninsula and is as much as 200 to 300 miles wide.
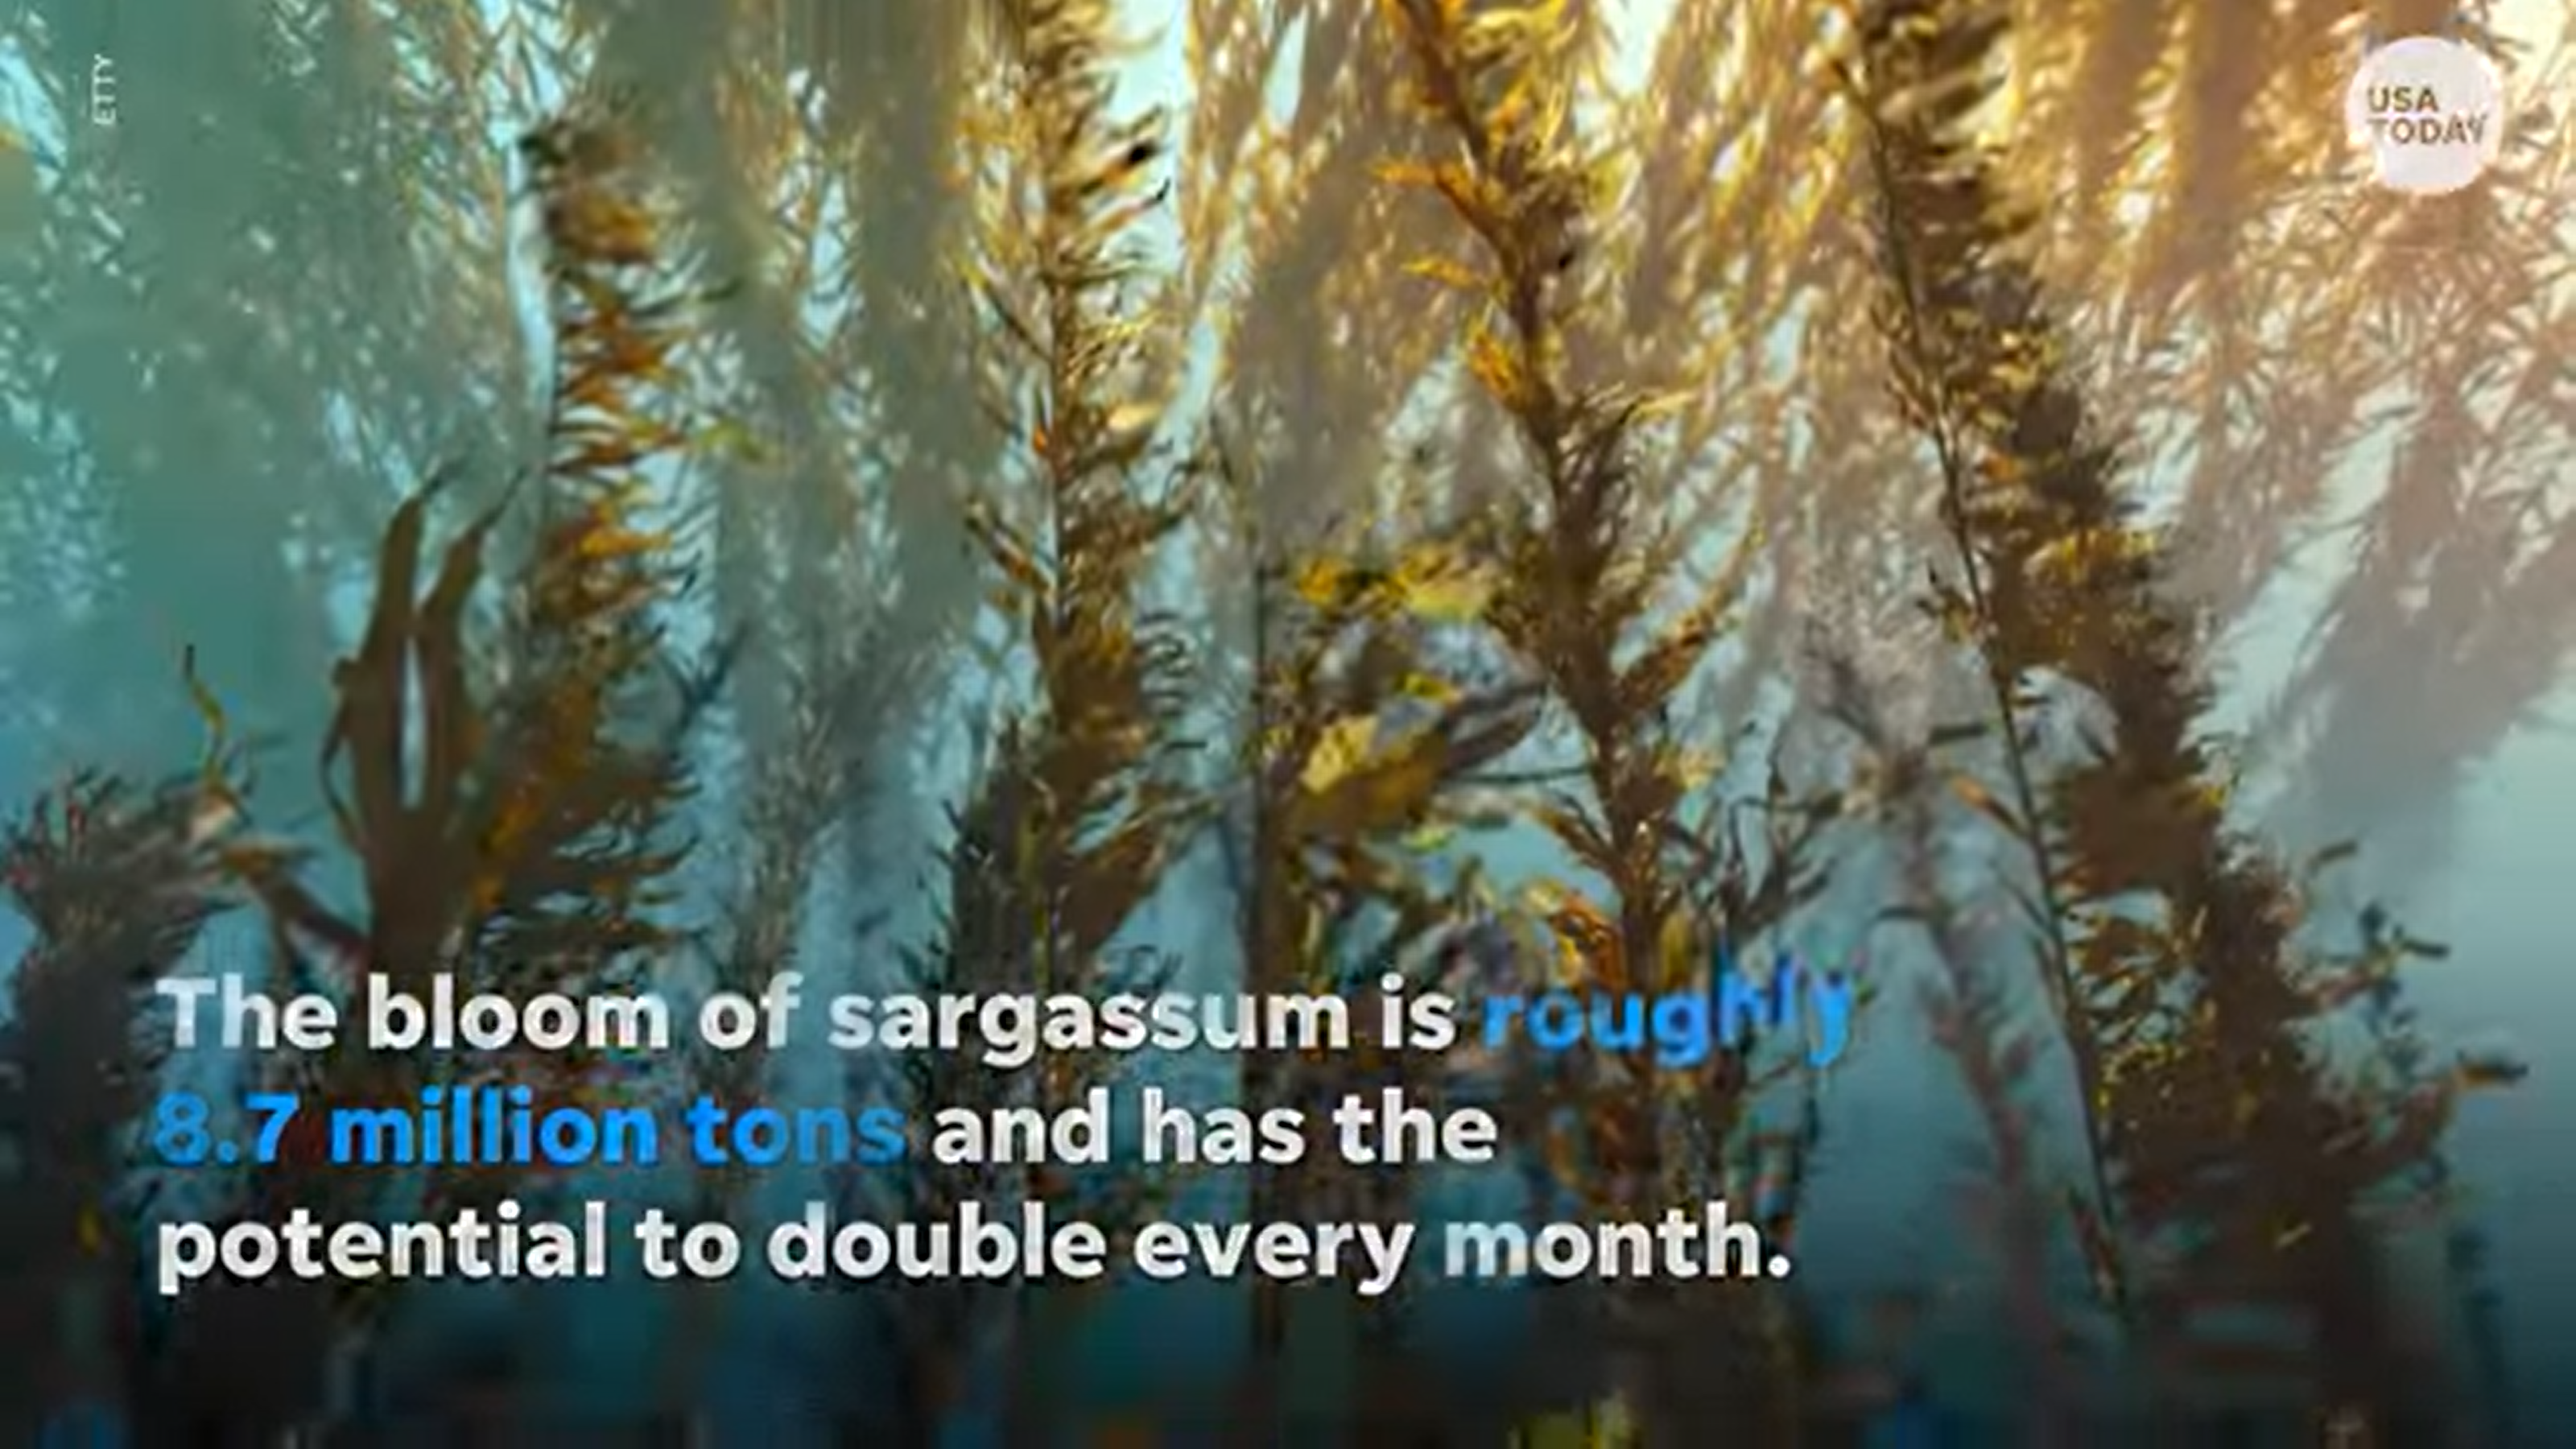
“This year could be the biggest year yet,” even bigger than previous growths, said Brian Lapointe, an algae specialist and research professor at Florida Atlantic University’s Harbor Branch Oceanographic Institute.
The belt is already beginning to wash up in the Florida Keys and Barbados and elsewhere in the region, but researchers don’t know where the bulk of it could wind up.
The monstrous seaweed bloom is just one more example of a growing global invasion of macro and microscopic algal blooms thriving on an increasing supply of nutrients such as nitrogen in freshwater and marine ecosystems.
What is causing the algal blooms?
In addition to the unsightly piles of sargassum along the coast, some species produce toxins that affect the food chain or deplete the oxygen in the water when they start to decay, causing fish kills and the die-off of other marine species.
Here’s what to know:
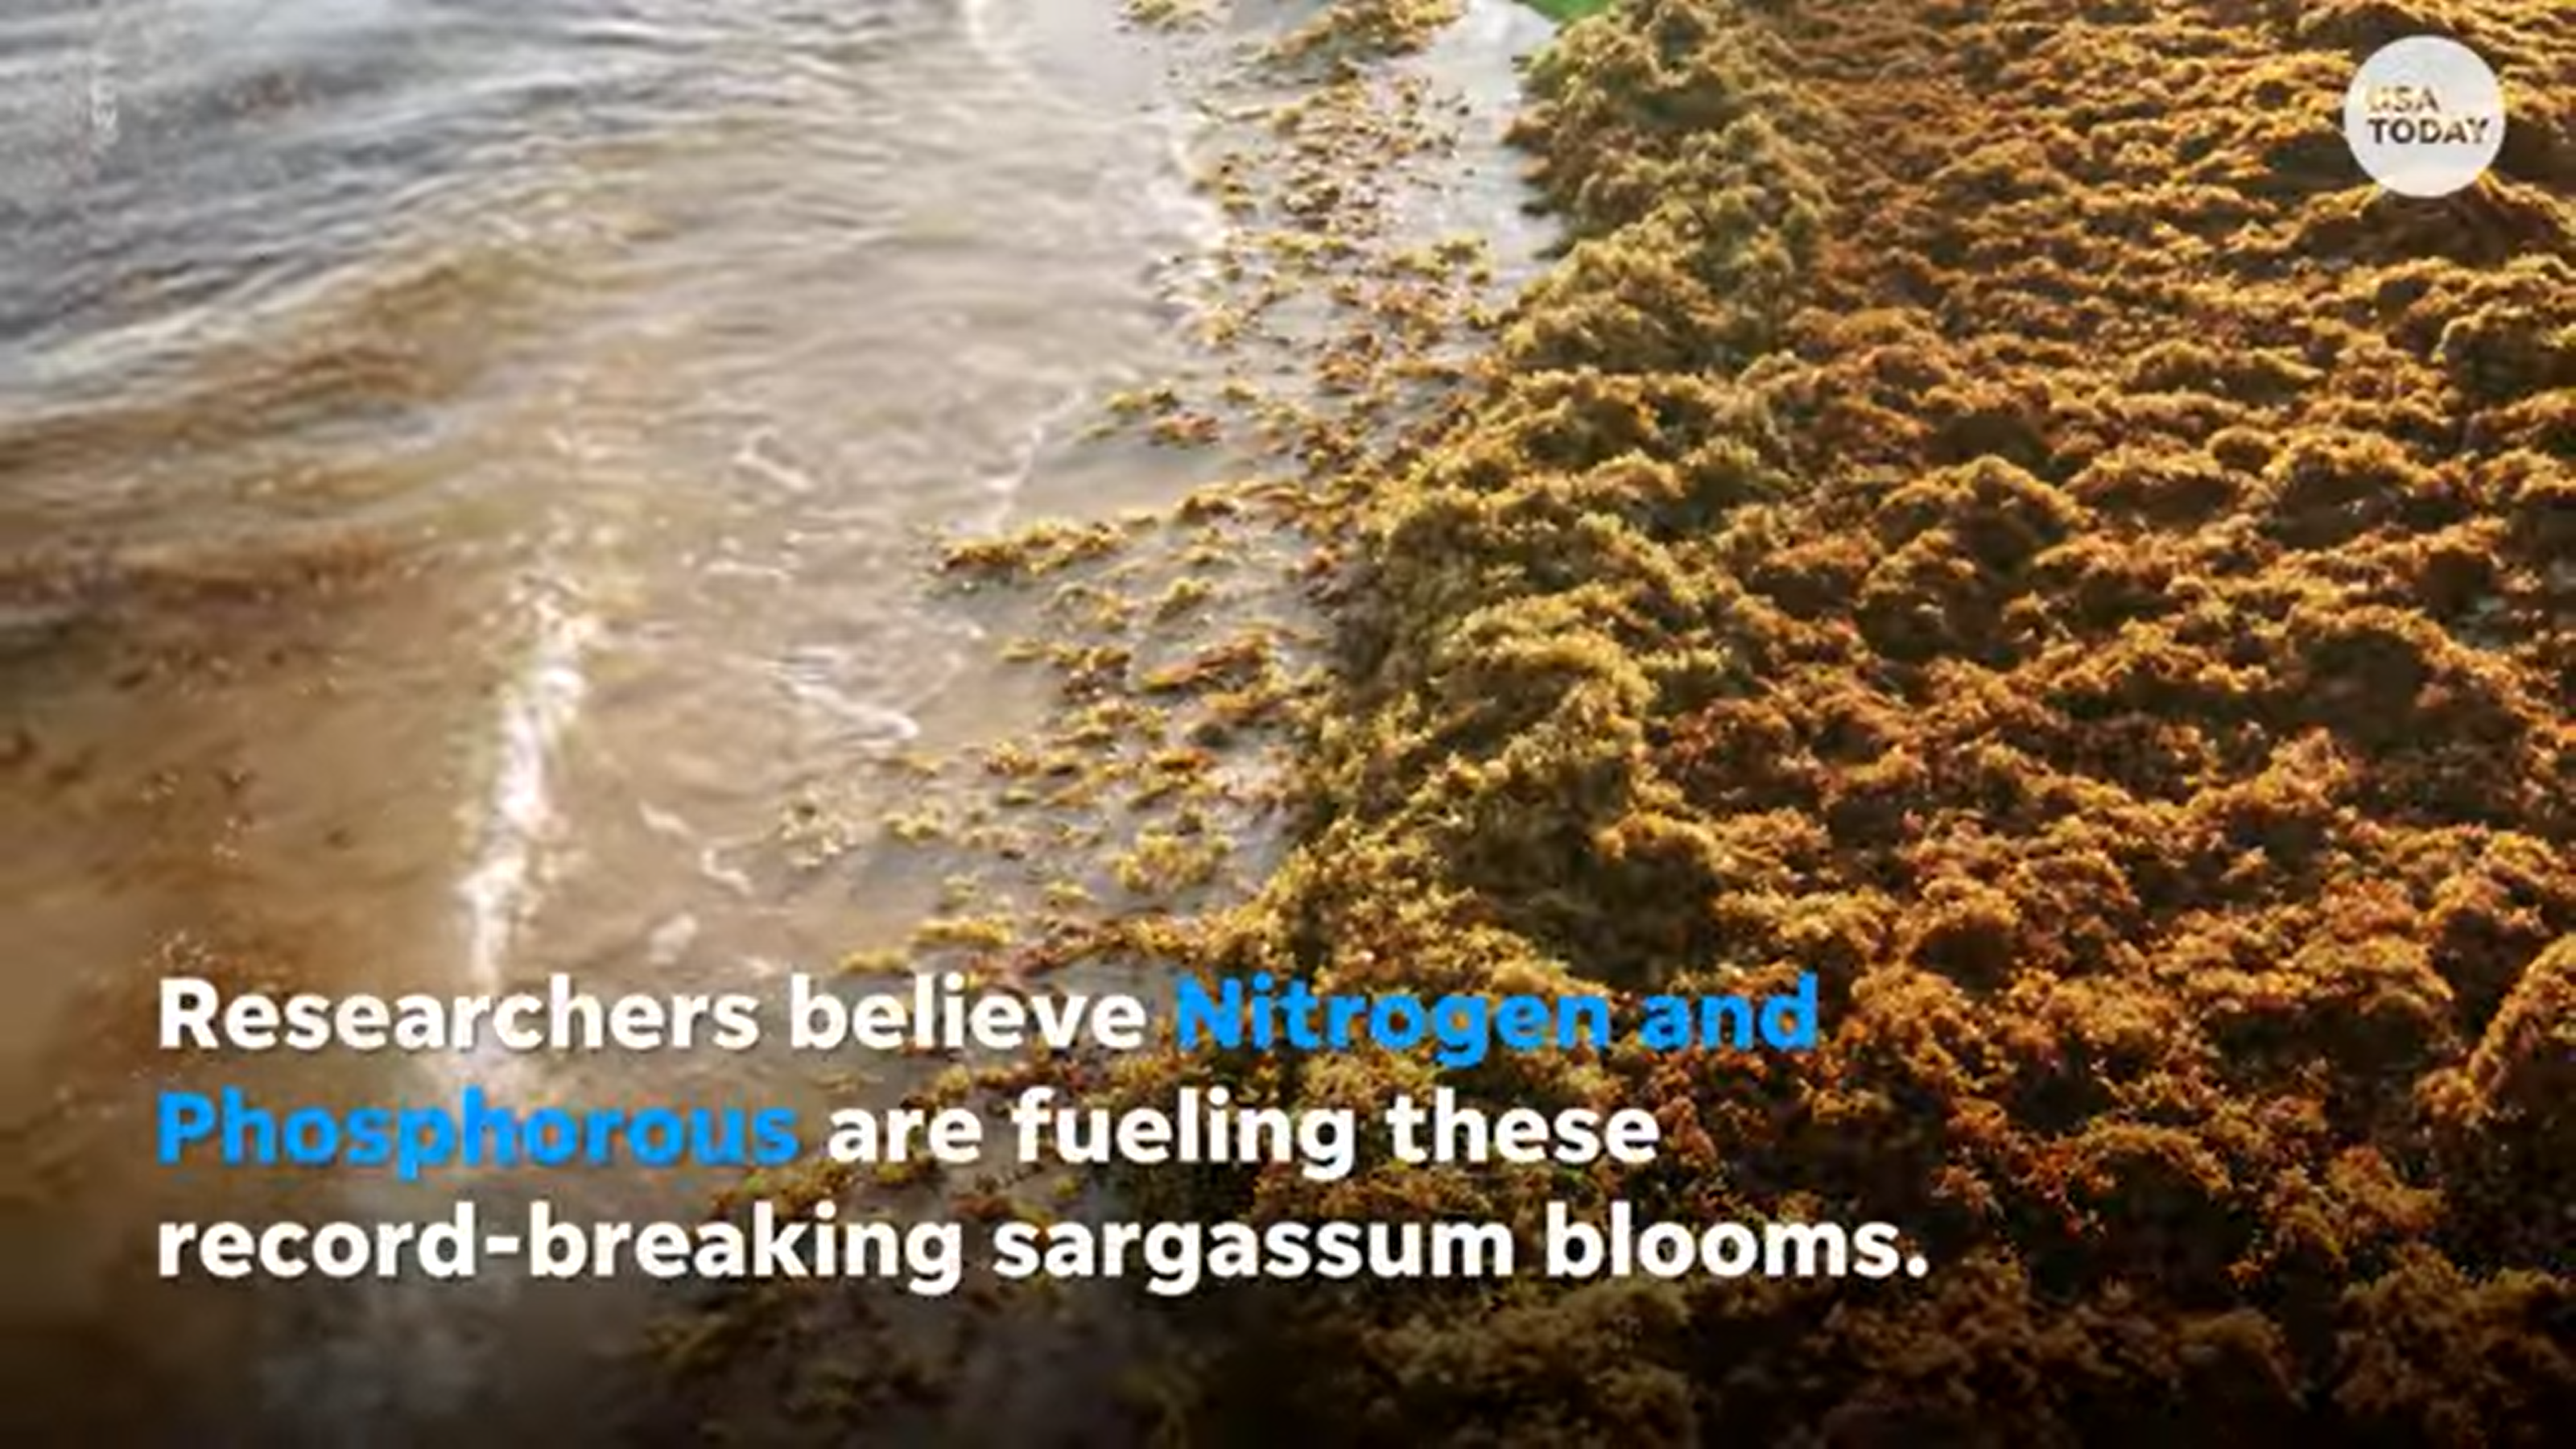
- Cause: The algal blooms are linked to human activities, such as lawn fertilizers, wastewater and agricultural runoff, that increasingly send pollutants into rivers, lakes, and oceans.
- Key quote: “These nutrients are the common thread that ties all the algal blooms together,” whether it’s sargassum, red tide, or blue green algae, Lapointe said. It’s also linked to the “brown tide” bloom in Florida’s Indian River Lagoon that has been blamed for killing thousands of acres of seagrass, leading to the starving deaths of hundreds of manatees.
- Looking ahead: Such algal blooms are expected to occur more often and cover larger areas of the globe, potentially harming other aquatic ecosystems, fisheries and coastal resources, reported a group of international researchers in a coastal phytoplankton study published this month in the journal Nature.
Not all algal blooms are bad. Many can occur naturally and can have positive effects.
Isn’t sargassum naturally occurring?
Yes. Christopher Columbus wrote about floating mats of it in the Atlantic Ocean.
“It’s not a bad thing to have the sargassum in the ocean,” said Brian Barnes, an assistant research professor at the University of South Florida in Tampa. Sea turtle hatchlings swim from Florida beaches to the Sargasso Sea in the Atlantic, where they spend their early lives floating and foraging in the grass.
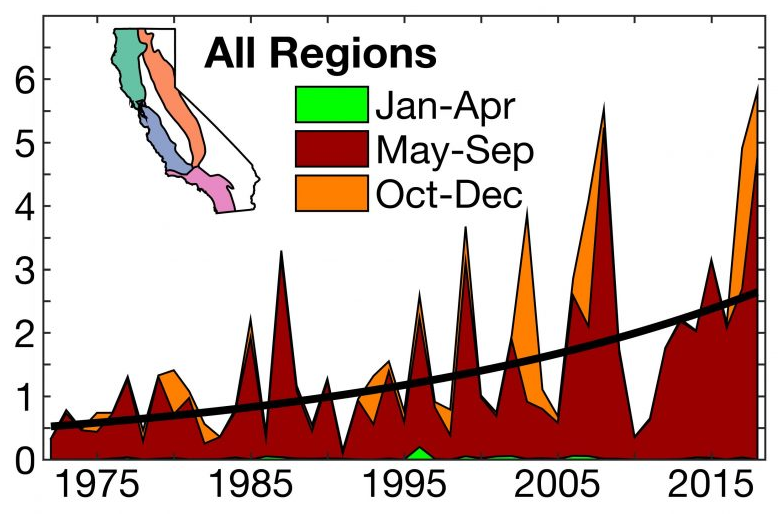
“If it all stays offshore, we wouldn’t really have a problem,” Barnes said. But the macroalgae has mushroomed in size over the past 12 years or so, which makes it more likely to see large piles of seaweed that make it difficult to walk, sit or play on beaches.
The trend was first documented on satellite in 2011.
In some cases, there’s so much seaweed that local governments must use heavy equipment and dump trucks to haul it away, LaPointe said.
He has linked the surge in sargassum to flow from the Mississippi River, extreme flooding in the Amazon basin, and the mouth of the Congo, where upwelling and vertical mixing of the ocean can bring up nutrients that feed the blooms. He said deforestation and burning also may contribute.
Phytoplankton blooms increasing in size and frequency
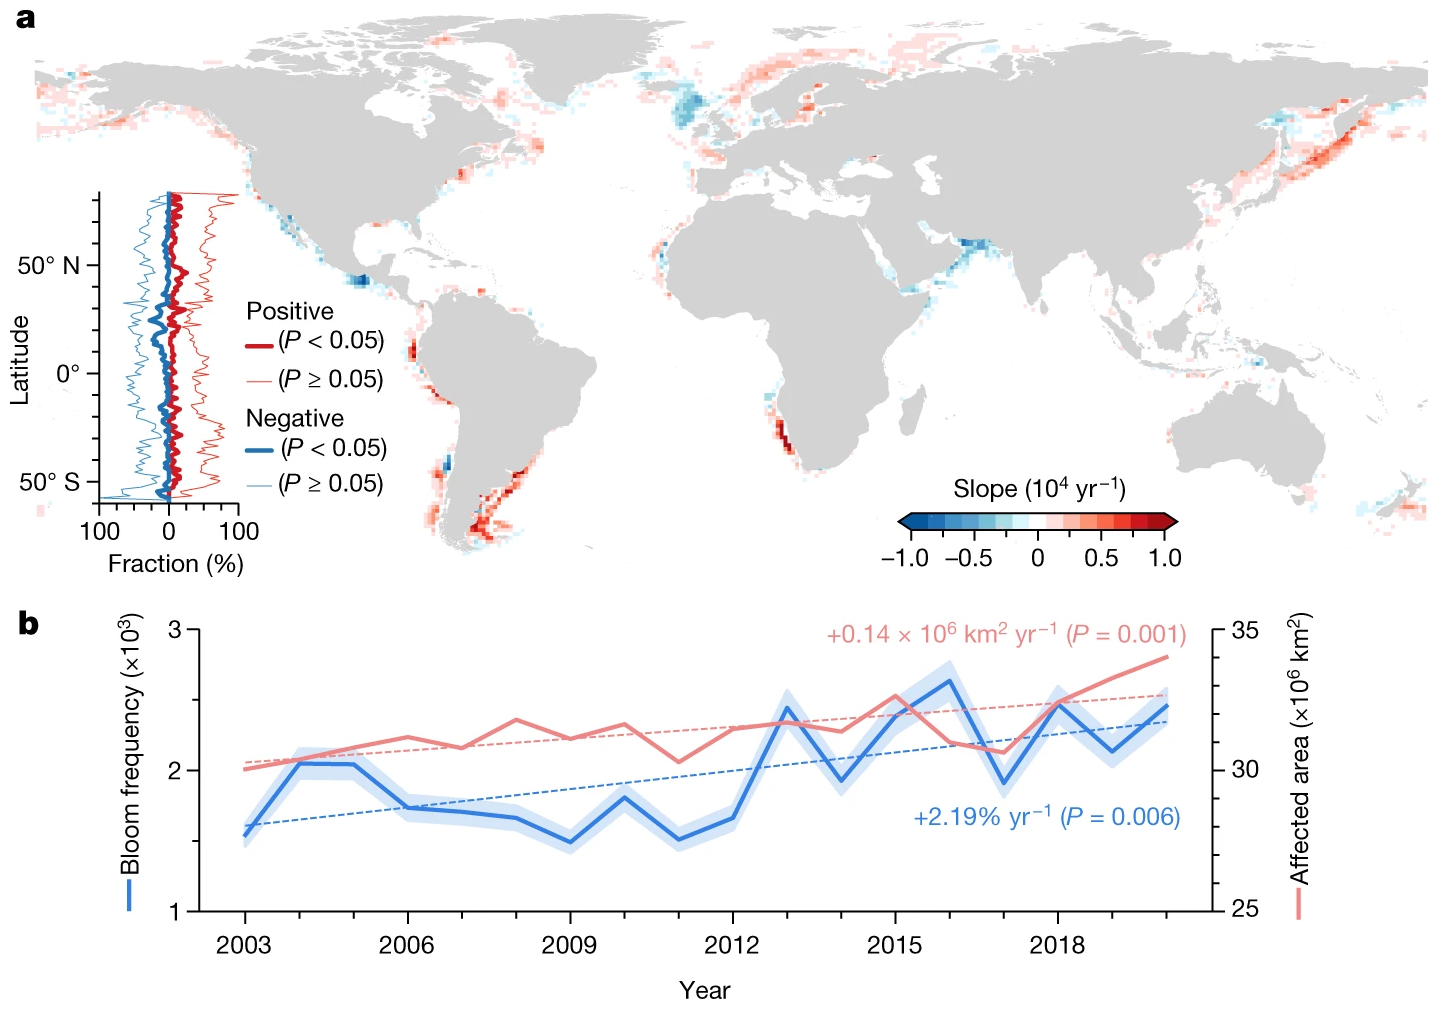
Blooms of much smaller algae – a microscopic species known as phytoplankton – increased in size and frequency around the world from 2003 to 2020, the researchers concluded in the Nature study.
“We’ve seen something pretty similar in a lot of the things we study,” Barnes said. “We’re seeing such massive blooms now.”
The coastal phytoplankton study, by researchers at the Southern University of Science and Technology in China and elsewhere, used images from NASA’s Aqua satellite. They found:
- Blooms affected more than 8% of the global ocean area in 2020, a 13.2% increase from 2003.
- Bloom frequency increased globally at a rate of nearly 60%.
- Europe and North America had the largest bloom areas.
- Africa and South America saw the most frequent blooms, more than 6.3 a year.
- Australia had the lowest frequency and smallest affected area.
Is climate change affecting algae blooms?
Blooms have been at least indirectly linked to climate change in several ways, but especially to the warming temperatures that bring more extreme rainfall that washes silt and pollutants into waterways.
The authors of the coastal phytoplankton study, Lapointe and other researchers have found:
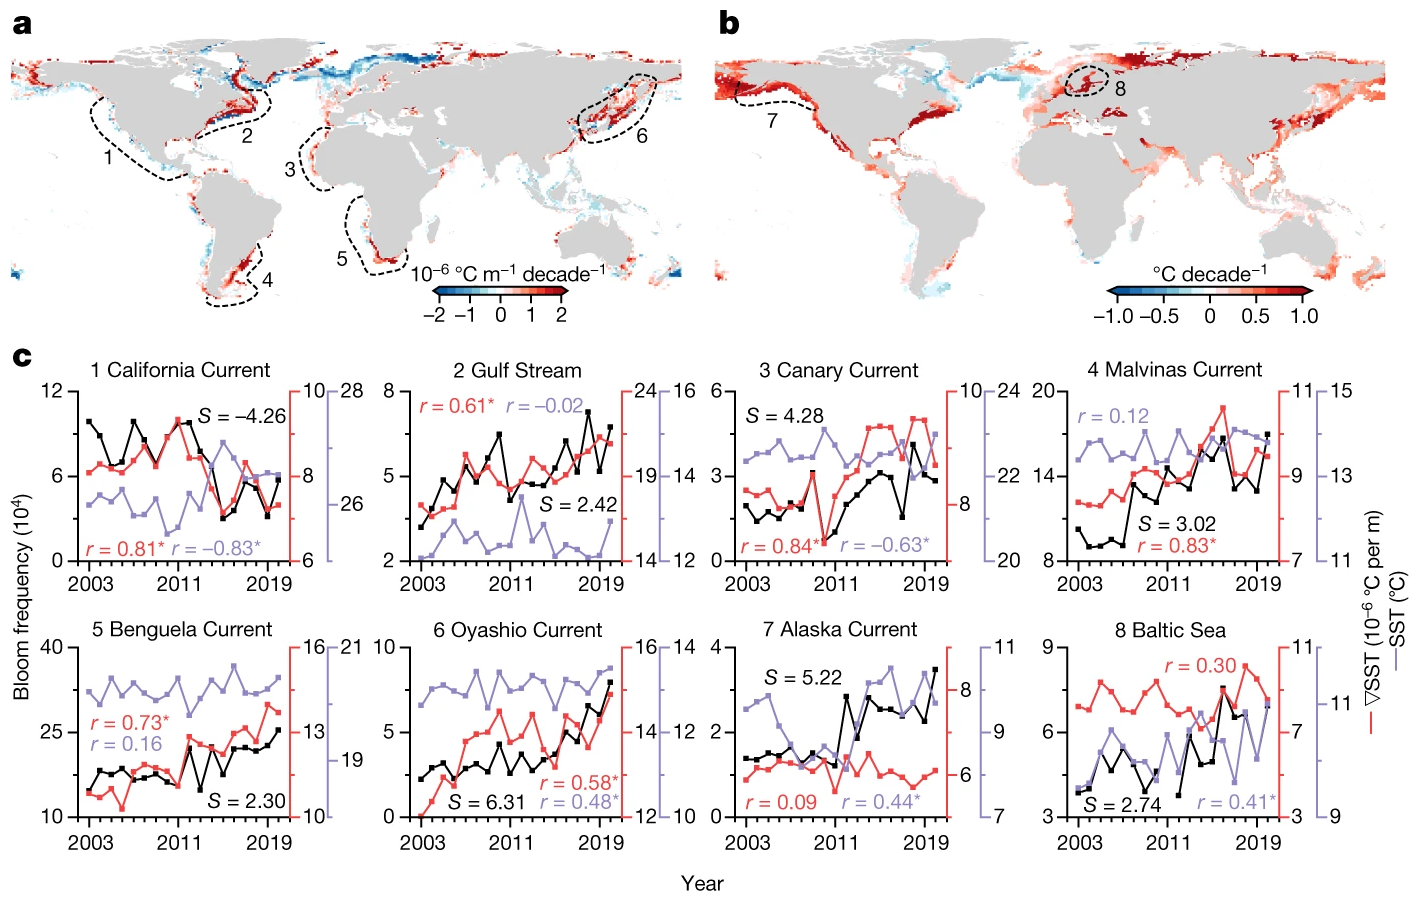
- A correlation in some regions between changes in sea surface temperatures and ocean circulation.
- Warmer temperatures coincided with blooms in high latitude regions such as Alaska and the Baltic Sea.
- Climate change can affect ocean circulation and the movement of nutrients that feed phytoplankton blooms.
- Global climate events, such as El Nino, also show connections to bloom frequency and movement.
- Algal-bloom-favorable seasons in temperate seas have increased with warmer temperatures.
[more]
Big, stinky blob of algae takes aim at Florida beaches. What’s causing it? Is it climate change?
Coastal phytoplankton blooms expand and intensify in the 21st century
ABSTRACT: Phytoplankton blooms in coastal oceans can be beneficial to coastal fisheries production and ecosystem function, but can also cause major environmental problems1,2—yet detailed characterizations of bloom incidence and distribution are not available worldwide. Here we map daily marine coastal algal blooms between 2003 and 2020 using global satellite observations at 1-km spatial resolution. We found that algal blooms occurred in 126 out of the 153 coastal countries examined. Globally, the spatial extent (+13.2%) and frequency (+59.2%) of blooms increased significantly (P < 0.05) over the study period, whereas blooms weakened in tropical and subtropical areas of the Northern Hemisphere. We documented the relationship between the bloom trends and ocean circulation, and identified the stimulatory effects of recent increases in sea surface temperature. Our compilation of daily mapped coastal phytoplankton blooms provides the basis for global assessments of bloom risks and benefits, and for the formulation or evaluation of management or policy actions.
Coastal phytoplankton blooms expand and intensify in the 21st century