Increase in atmospheric methane set another record during 2021 – Carbon dioxide levels also record a big jump – “The evidence is consistent, alarming, and undeniable”

7 April 2022 (NOAA) – For the second year in a row, NOAA scientists observed a record annual increase in atmospheric levels of methane, a powerful, heat-trapping greenhouse gas that’s the second biggest contributor to human-caused global warming after carbon dioxide.
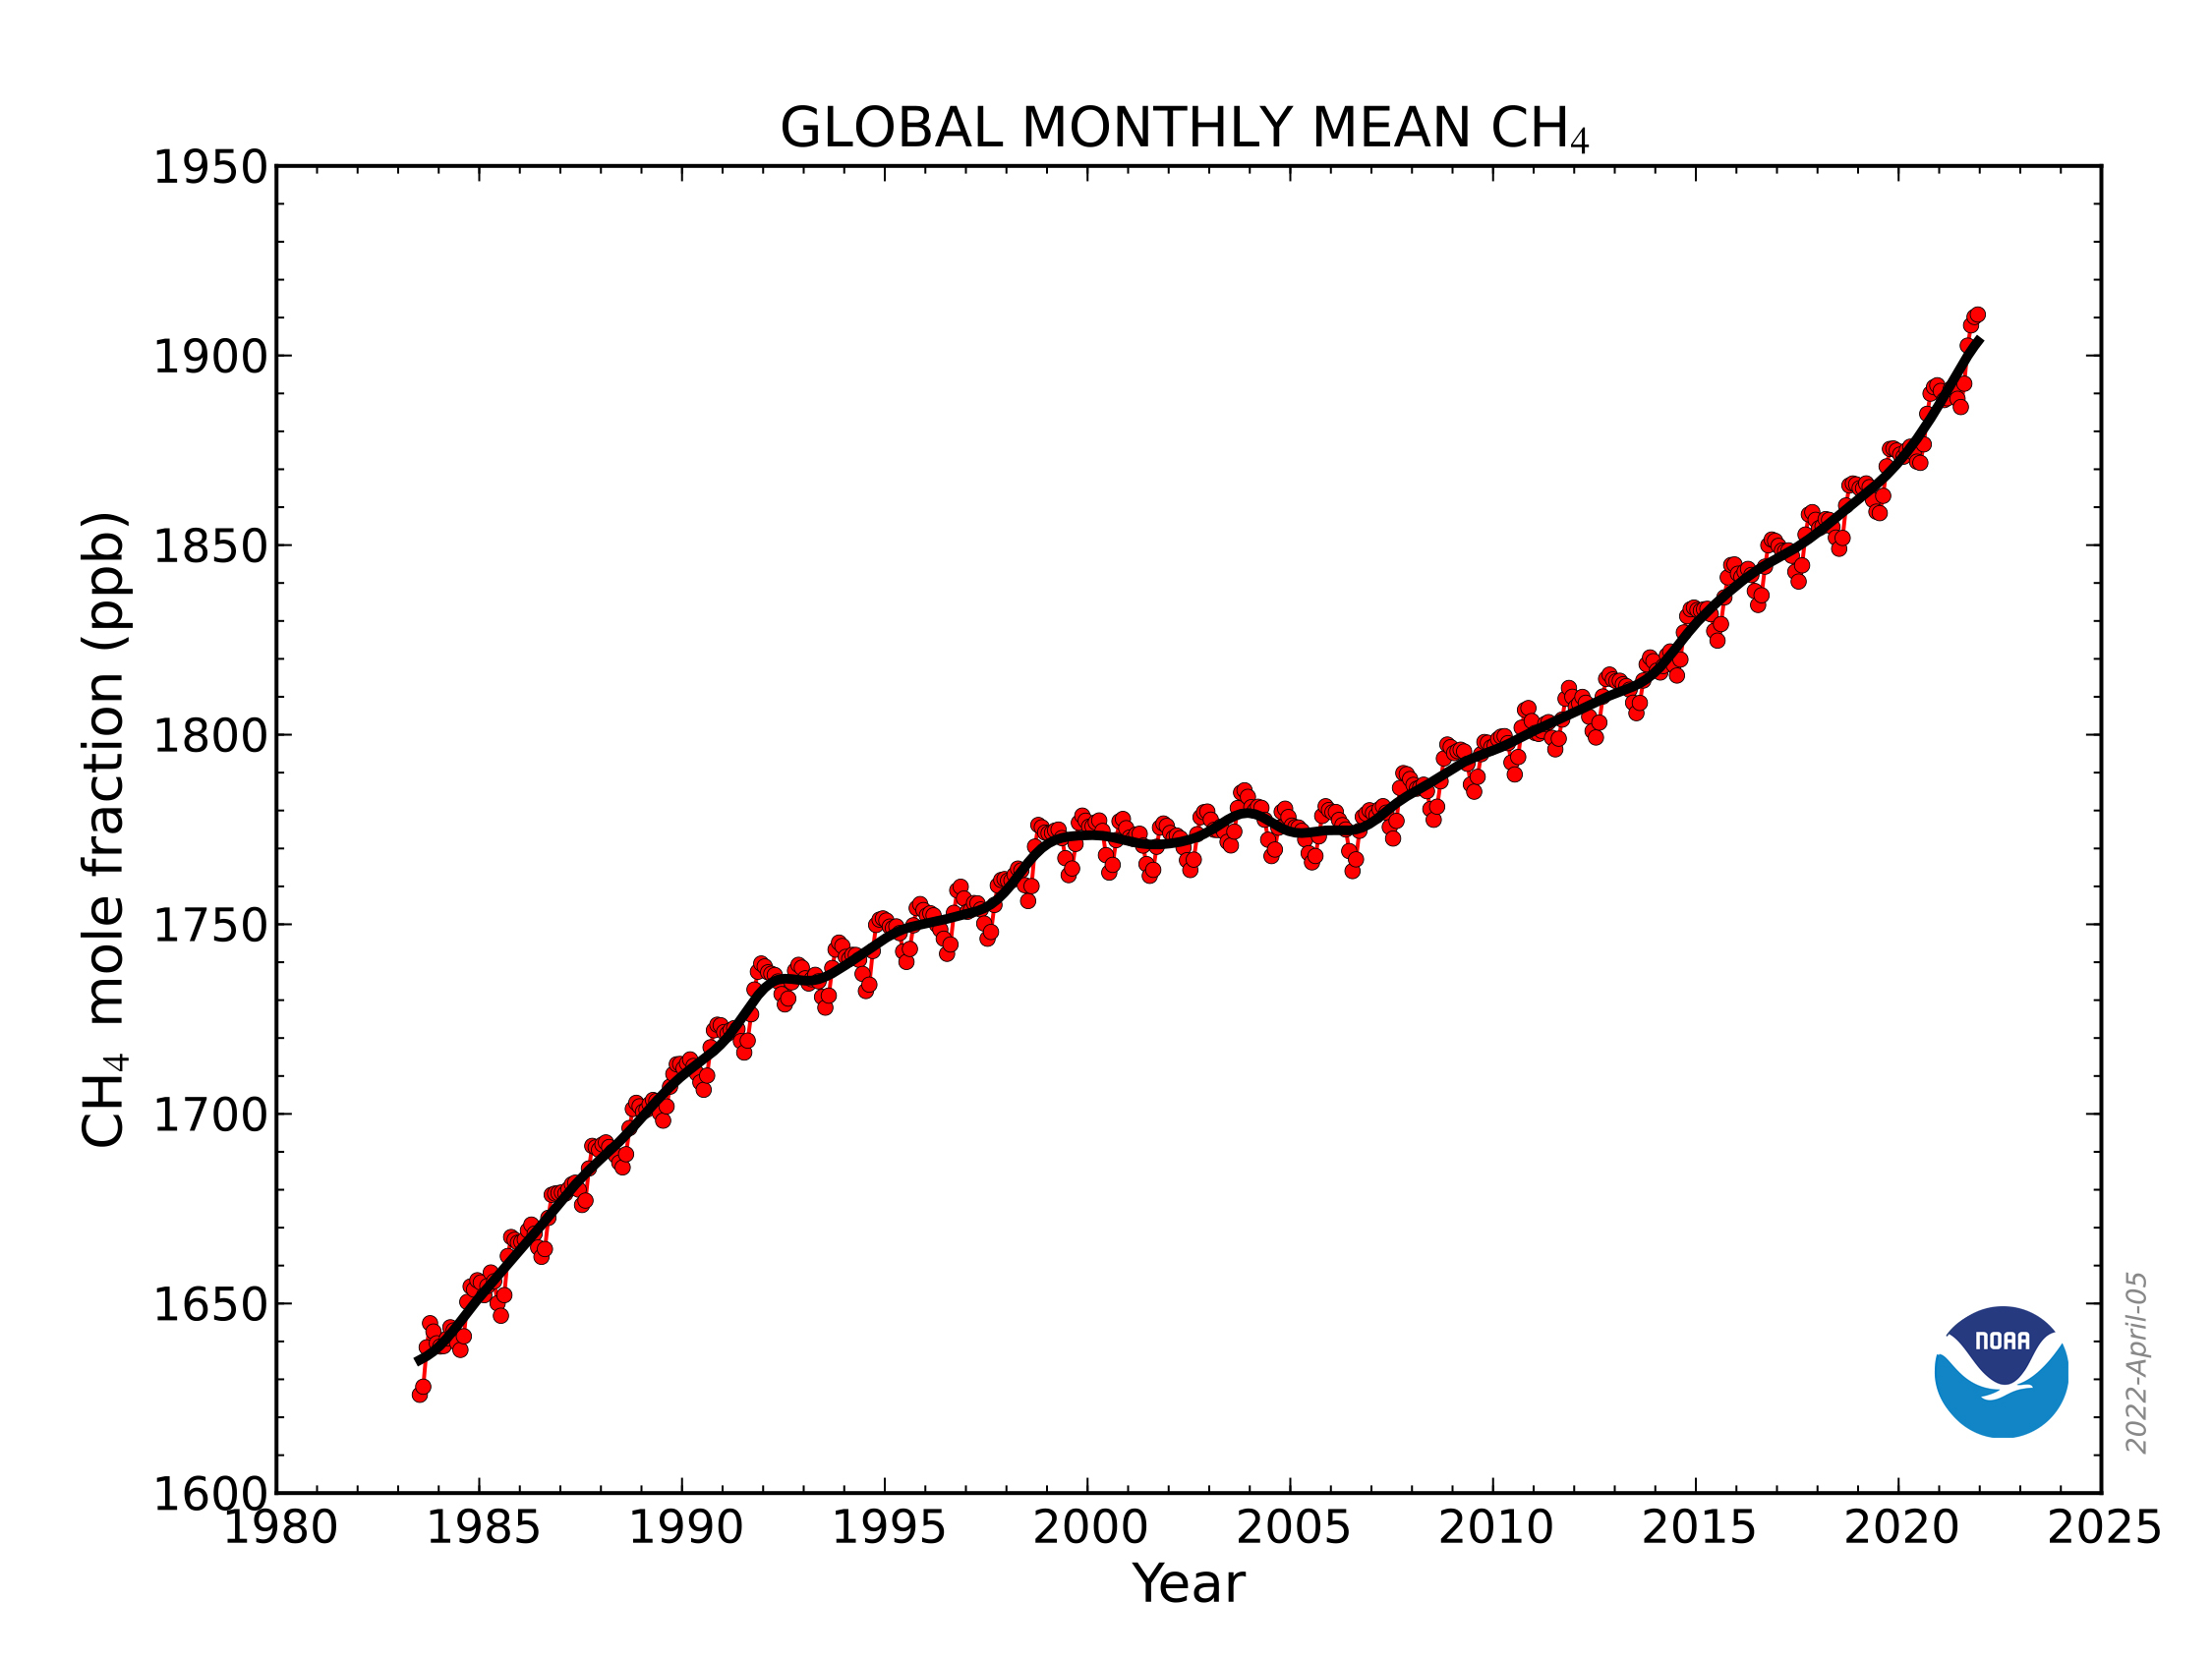
NOAA’s preliminary analysis showed the annual increase in atmospheric methane during 2021 was 17 parts per billion (ppb), the largest annual increase recorded since systematic measurements began in 1983. The increase during 2020 was 15.3 ppb. Atmospheric methane levels averaged 1,895.7 ppb during 2021, or around 162% greater than pre-industrial levels. From NOAA’s observations, scientists estimate global methane emissions in 2021 are 15% higher than the 1984-2006 period.
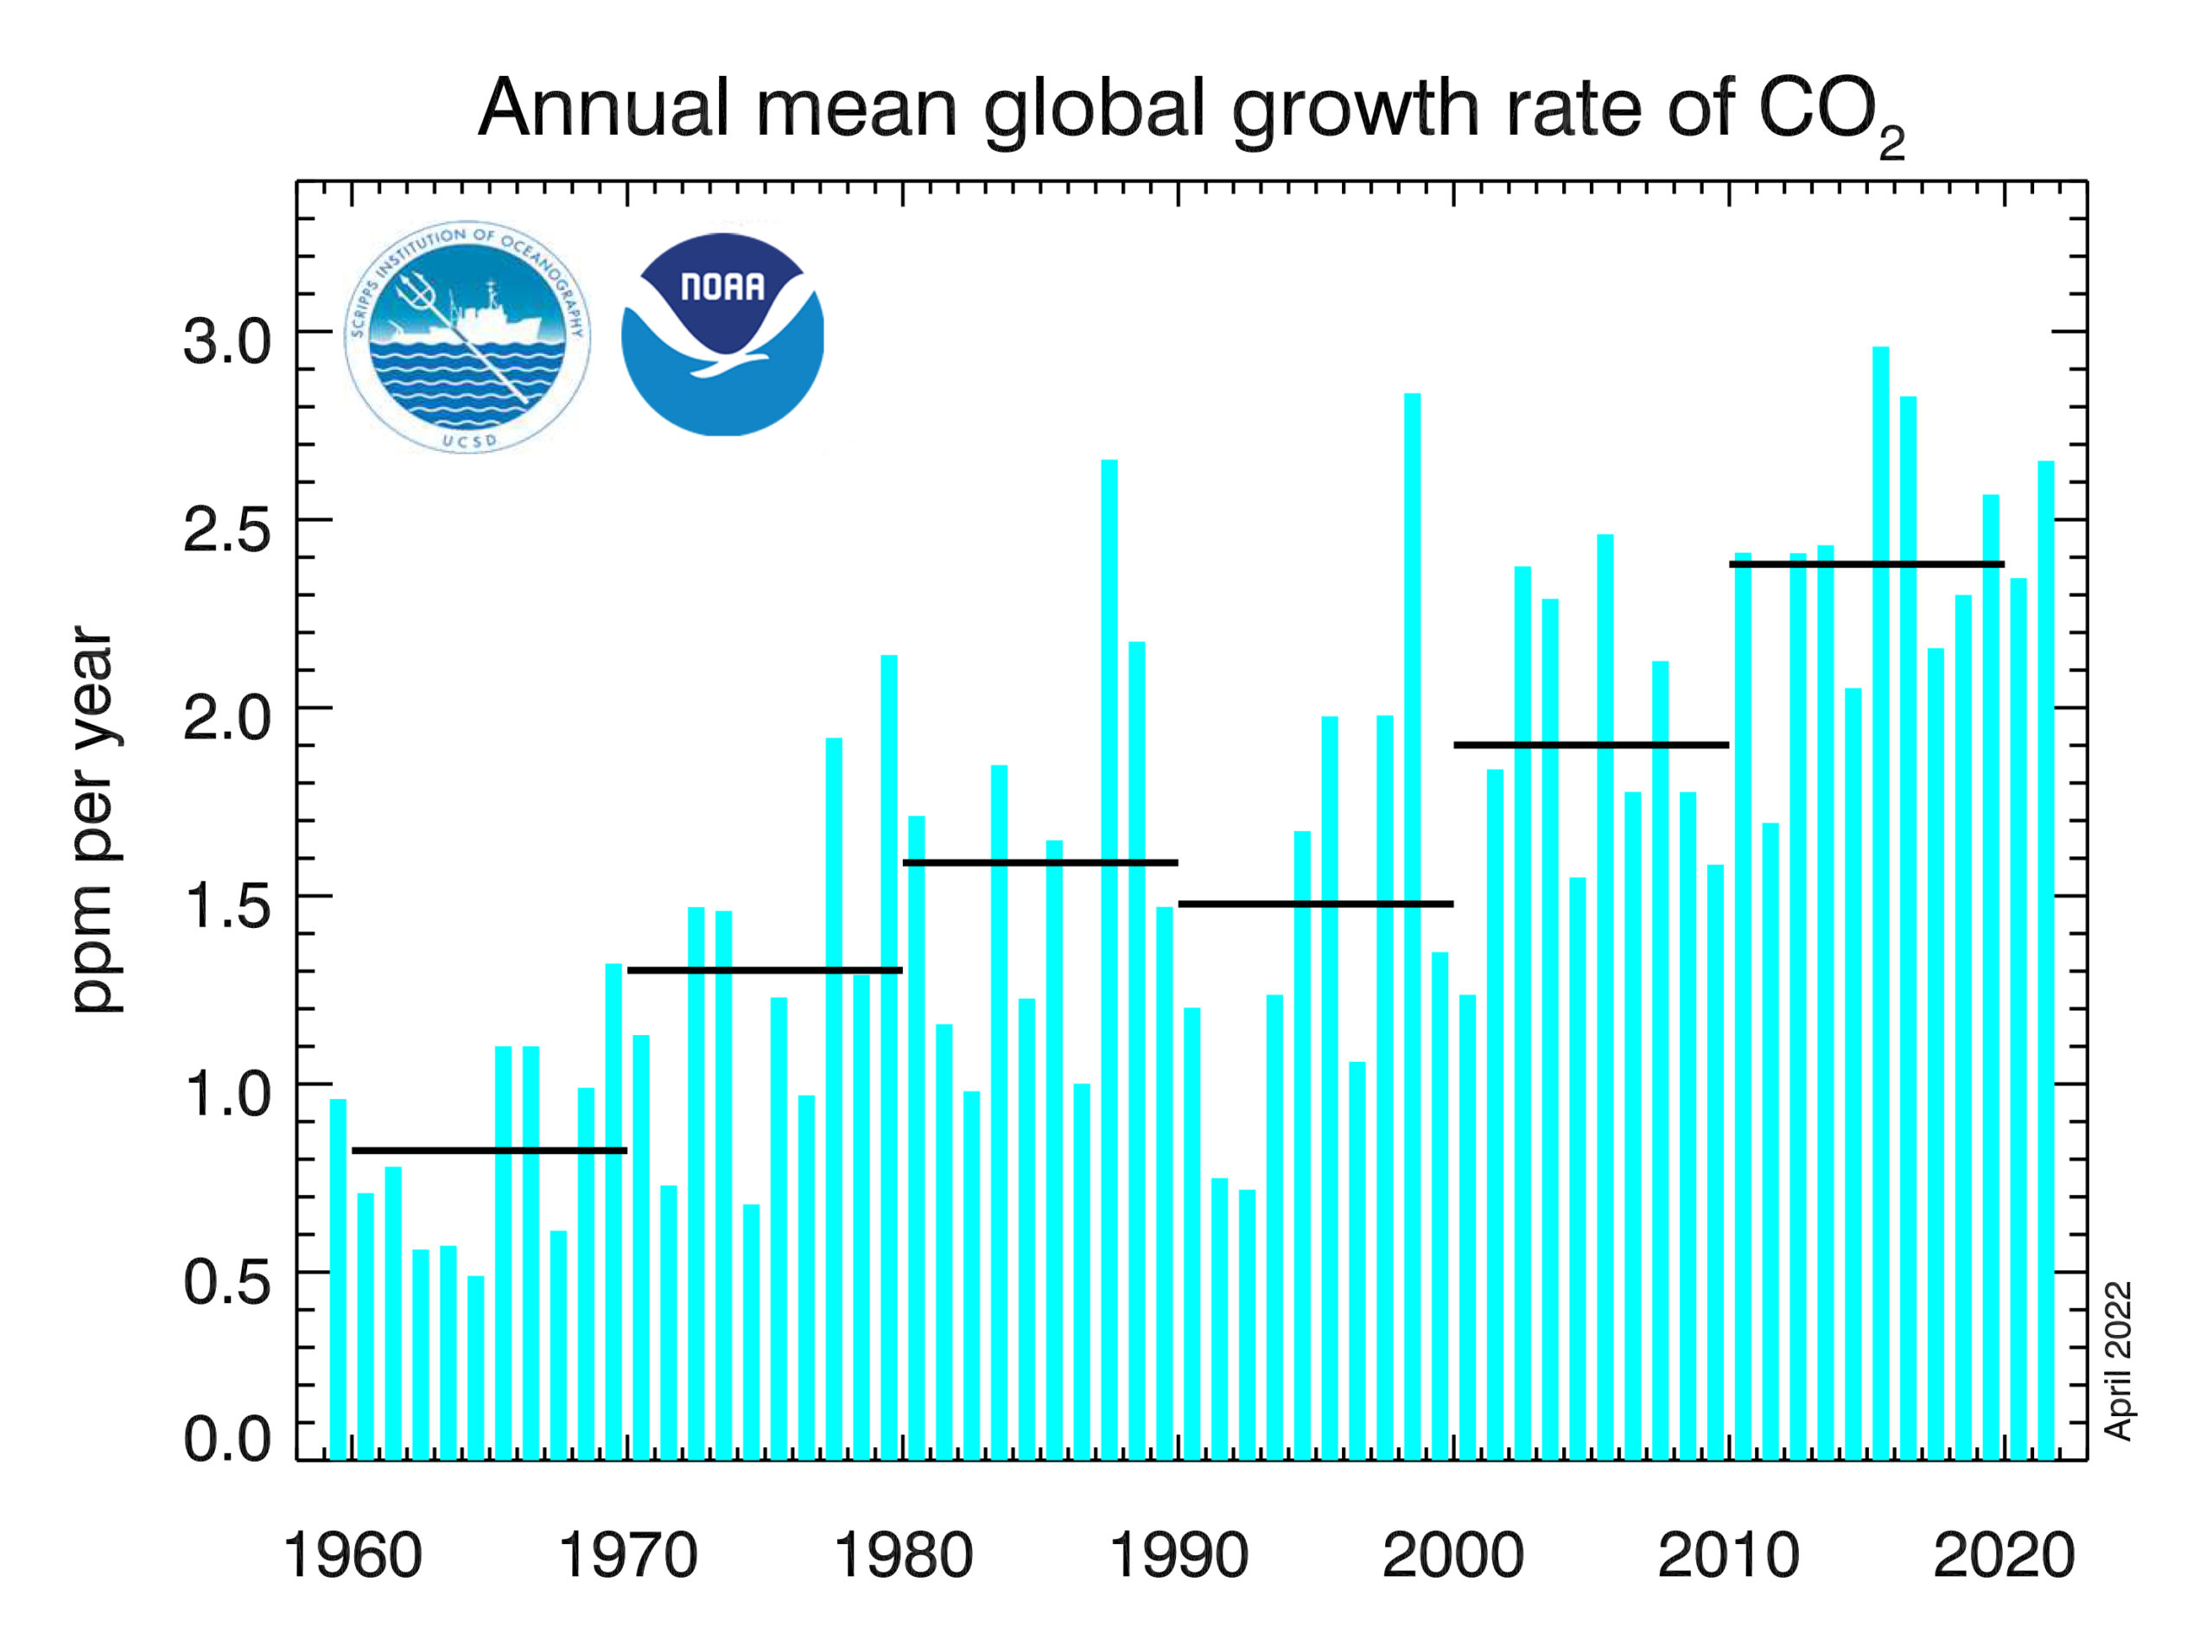
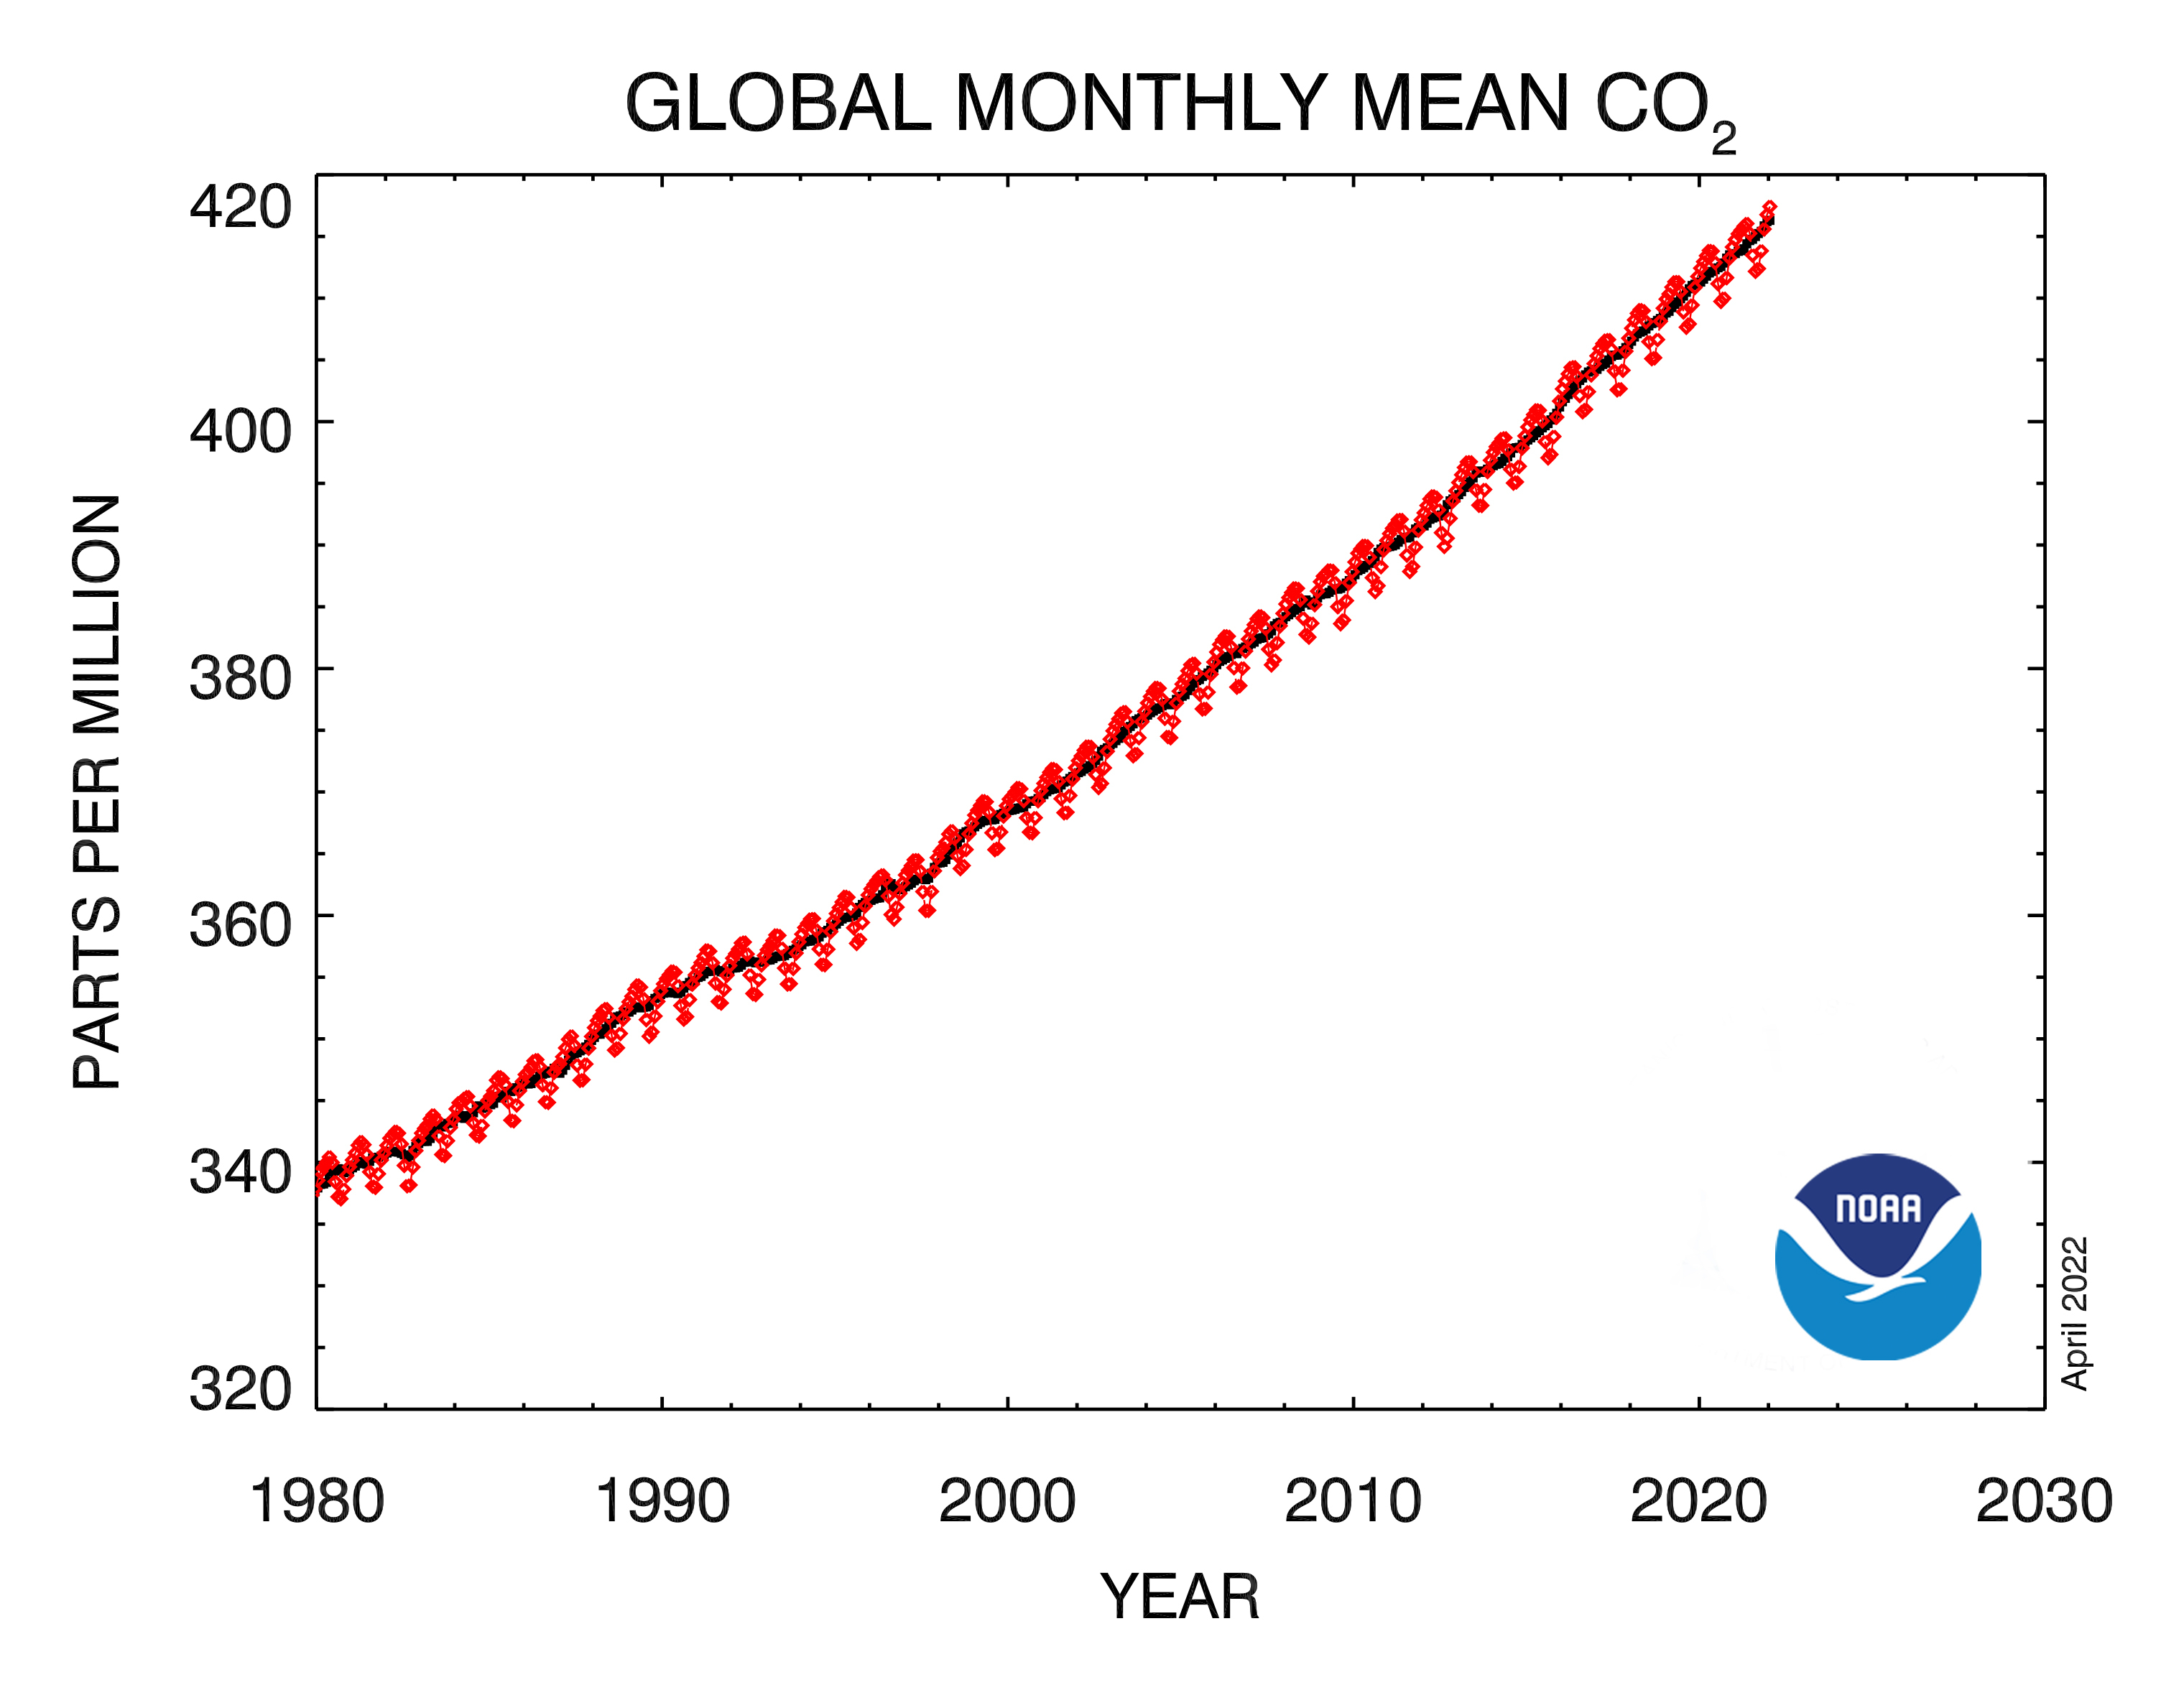
Meanwhile, levels of carbon dioxide also continue to increase at historically high rates. The global surface average for carbon dioxide during 2021 was 414.7 parts per million (ppm), which is an increase of 2.66 ppm over the 2020 average. This marks the 10th consecutive year that carbon dioxide increased by more than 2 parts per million, which represents the fastest sustained rate of increase in the 63 years since monitoring began.
“Our data show that global emissions continue to move in the wrong direction at a rapid pace,” said Rick Spinrad, Ph.D., NOAA Administrator. “The evidence is consistent, alarming and undeniable. We need to build a Climate Ready Nation to adapt for what’s already here and prepare for what’s to come. At the same time, we can no longer afford to delay urgent and effective action needed to address the cause of the problem — greenhouse gas pollution.”

Carbon dioxide remains the biggest climate change threat
While there’s been scientific debate on the cause of the ongoing surge in methane levels, carbon dioxide pollution has always been the primary driver of human-caused climate change. An estimated 36 billion tons of carbon dioxide were emitted into the atmosphere last year by human activity; roughly 640 million tons of methane were emitted during the same period. The atmospheric residence time of methane is approximately nine years, whereas some of the carbon dioxide emitted today will continue to warm the planet for thousands of years.
Atmospheric levels of carbon dioxide are now comparable to where they were during the mid-Pliocene epoch, around 4.3 million years ago. During that period, sea level was about 75 feet higher than today, the average temperature was 7 degrees Fahrenheit higher than in pre-industrial times, and studies indicate large forests occupied areas of the Arctic that are now tundra.
“The effect of carbon dioxide emissions is cumulative,” said Pieter Tans, senior scientist with the Global Monitoring Laboratory. “About 40% of the Ford Model T emissions from 1911 are still in the air today. We’re halfway to doubling the abundance of carbon dioxide that was in the atmosphere at the start of the Industrial Revolution.”
Control of many methane sources technically possible today
While carbon dioxide remains in the atmosphere for much longer than methane, methane is roughly 25 times more powerful at trapping heat in the atmosphere, and has an important short-term influence on the rate of climate change.
Methane in the atmosphere is generated by many different sources, such as fossil fuel production, transport and use, from the decay of organic matter in wetlands, and as a byproduct of digestion by ruminant animals such as cows. Determining which specific sources are responsible for variations in annual increases of methane is complex, but scientists estimate that fossil fuel production and use contributes roughly 30% of the total methane emissions. These industrial sources of methane are relatively simple to pinpoint and control using current technology.
“Reducing methane emissions is an important tool we can use right now to lessen the impacts of climate change in the near term, and rapidly reduce the rate of warming,” Spinrad said. “Let’s not forget that methane also contributes to ground-level ozone formation, which causes roughly 500,000 premature deaths each year around the world.”
Previous NOAA methane research that utilized stable carbon isotopic analysis performed by the Institute of Arctic and Alpine Research at the University of Colorado indicates that biological sources of methane such as wetlands or ruminant agriculture are a primary driver of post-2006 increases. NOAA scientists are concerned that the increase in biological methane may be the first signal of a feedback loop caused in part by more rain over tropical wetlands that would largely be beyond humans’ ability to control.
“Reducing fossil methane emissions is a necessary step toward mitigating climate change,” said Xin Lan, a CIRES scientist working at NOAA’s Global Monitoring Laboratory. “But the extreme longevity of the carbon dioxide emissions in the atmosphere means that we need to aggressively reduce fossil fuel pollution to zero as soon as possible if we want to avoid the worst impacts from a changing climate.”

NOAA’s air sampling monitors the pulse of the planet
NOAA’s Global Monitoring Laboratory annually collects more than 15,000 air samples from monitoring stations around the world and analyzes them in a state-of-the-science laboratory in Boulder, Colorado. Every spring, NOAA calculates the global average levels of four primary greenhouse gases — carbon dioxide, methane, nitrous oxide, and sulfur hexafluoride — observed during the previous year.
The global averages were calculated using air samples from a subset of sites from the Global Greenhouse Gas Reference Network, which is composed of NOAA’s four baseline observatories in Hawaii, Alaska, American Samoa and the South Pole, and from samples collected at about 50 other cooperative sampling sites around the world. Air samples used for the calculation are predominantly of well-mixed marine boundary layer air, representative of a large region of the atmosphere.
Observations sustained over many decades, by NOAA and others, show that the rate of carbon dioxide increase has tracked global emissions. Despite international pledges to reduce emissions, climate scientists have seen no measurable progress in reducing greenhouse gas pollution.
“It’s going to take a lot of hard work to reverse these trends, and clearly that’s not happening,” said Ariel Stein, director of the Global Monitoring Laboratory. “So, it is crucial that we continue to sustain integrated and robust monitoring and verification systems to help assess the current state of the atmospheric greenhouse gas burden, as well as determine the effectiveness of future greenhouse gas emission reduction measures.”
Contact
- Theo Stein, theo.stein@noaa.gov, (303) 497-6288
Increase in atmospheric methane set another record during 2021


One Response
Comments are closed.