U.S. hospitals are in serious trouble – “Too many facilities are pulling from the same labor pool, and if that pool is sick, where are the reinforcements?”

By Ed Yong
7 January 2022
(The Atlantic) – When a health-care system crumbles, this is what it looks like.
Much of what’s wrong happens invisibly. At first, there’s just a lot of waiting. Emergency rooms get so full that “you’ll wait hours and hours, and you may not be able to get surgery when you need it,” Megan Ranney, an emergency physician in Rhode Island, told me. When patients are seen, they might not get the tests they need, because technicians or necessary chemicals are in short supply. Then delay becomes absence. The little acts of compassion that make hospital stays tolerable disappear. Next go the acts of necessity that make stays survivable. Nurses might be so swamped that they can’t check whether a patient has their pain medications or if a ventilator is working correctly. People who would’ve been fine will get sicker. Eventually, people who would have lived will die. This is not conjecture; it is happening now, across the United States. “It’s not a dramatic Armageddon; it happens inch by inch,” Anand Swaminathan, an emergency physician in New Jersey, told me.
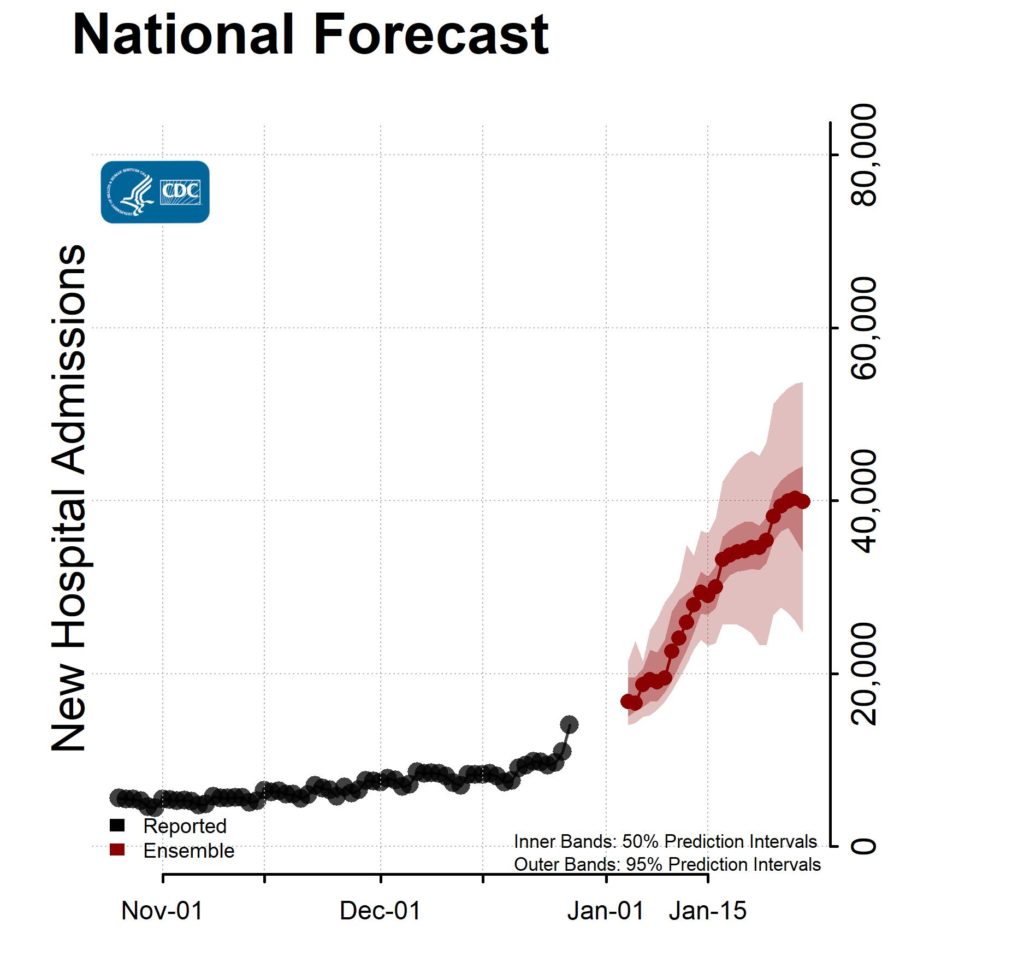
In this surge, COVID-19 hospitalizations rose slowly at first, from about 40,000 nationally in early November to 65,000 on Christmas. But with the super-transmissible Delta variant joined by the even-more-transmissible Omicron, the hospitalization count has shot up to 110,000 in the two weeks since then. “The volume of people presenting to our emergency rooms is unlike anything I’ve ever seen before,” Kit Delgado, an emergency physician in Pennsylvania, told me. Health-care workers in 11 different states echoed what he said: Already, this surge is pushing their hospitals to the edge. And this is just the beginning. Hospitalizations always lag behind cases by about two weeks, so we’re only starting to see the effects of daily case counts that have tripled in the past 14 days (and are almost certainly underestimates). By the end of the month, according to the CDC’s forecasts, COVID will be sending at least 24,700 and up to 53,700 Americans to the hospital every single day.
This surge is, in many ways, distinct from the ones before. About 62 percent of Americans are fully vaccinated, and are still mostly protected against the coronavirus’s worst effects. When people do become severely ill, health-care workers have a better sense of what to expect and what to do. Omicron itself seems to be less severe than previous variants, and many of the people now testing positive don’t require hospitalization. But such cases threaten to obscure this surge’s true cost.
Omicron is so contagious that it is still flooding hospitals with sick people. And America’s continued inability to control the coronavirus has deflated its health-care system, which can no longer offer the same number of patients the same level of care. Health-care workers have quit their jobs in droves; of those who have stayed, many now can’t work, because they have Omicron breakthrough infections. “In the last two years, I’ve never known as many colleagues who have COVID as I do now,” Amanda Bettencourt, the president-elect of the American Association of Critical-Care Nurses, told me. “The staffing crisis is the worst it has been through the pandemic.” This is why any comparisons between past and present hospitalization numbers are misleading: January 2021’s numbers would crush January 2022’s system because the workforce has been so diminished. Some institutions are now being overwhelmed by a fraction of their earlier patient loads. “I hope no one you know or love gets COVID or needs an emergency room right now, because there’s no room,” Janelle Thomas, an ICU nurse in Maryland, told me.
Here, then, is the most important difference about this surge: It comes on the back of all the prior ones. COVID’s burden is additive. It isn’t reflected just in the number of occupied hospital beds, but also in the faltering resolve and thinning ranks of the people who attend those beds. “This just feels like one wave too many,” Ranney said. The health-care system will continue to pay these costs long after COVID hospitalizations fall. Health-care workers will know, but most other people will be oblivious—until they need medical care and can’t get it. [more]
Hospitals Are in Serious Trouble

COVID-19 Forecasts: Hospitalizations
5 January 2022 (CDC) – Reported and forecasted new COVID-19 hospital admissions as of 3 January 2021.
Interpretation of Forecasts of New Hospitalizations
- Current forecasts may not fully account for the emergence and rapid spread of the Omicron variant or changes in reporting during the holidays and should be interpreted with caution.
- This week’s national ensemble predicts that the number of new daily confirmed COVID-19 hospital admissions will likely increase, with 24,700 to 53,700 new confirmed COVID-19 hospital admissions likely reported on January 28, 2022.
- The state- and territory-level ensemble forecasts predict that over the next four weeks, the number of daily confirmed COVID-19 hospital admissions will likely increase in 38 jurisdictions, which are indicated in the forecast plots below. Trends in numbers of future reported hospital admissions are uncertain or predicted to remain stable in the other states and territories.
- Ensemble forecasts combine diverse independent team forecasts into one forecast. They have been among the most reliable forecasts in performance over time, but even the ensemble forecasts do not reliably predict rapid changes in the trends of reported cases, hospitalizations, and deaths. They should not be relied upon for making decisions about the possibility or timing of rapid changes in trends.
- The figure shows the number of new confirmed COVID-19 hospital admissions reported in the United States each day from October 26 through December 27 and forecasted new COVID-19 hospital admissions per day over the next 4 weeks, through January 28.
- This week, ensemble forecasts of new reported COVID-19 hospital admissions included forecasts from 7 modeling groups, each of which contributed a forecast for at least one jurisdiction.
- Models make various assumptions about the levels of social distancing and other interventions, which may not reflect recent changes in behavior. See model descriptions below for details on the assumptions and methods used to produce the forecasts.
Download national forecast data excel [XLS – 16 KB]
State Forecasts
State-level forecasts show the predicted number of new COVID-19 hospital admissions per day for the next 4 weeks by state. Each state forecast figure uses a different scale due to differences in the number of new COVID-19 hospital admissions per day between states and only forecasts meeting a set of ensemble inclusion criteria are shown. Further details are available here: https://covid19forecasthub.org/doc/ensemble/. Plots of the state-level ensemble forecasts and the underlying data can be downloaded below.
Additional forecast data and information on forecast submission are available at the COVID-19 Forecast Hub.
Forecast Inclusion, Evaluation, and Assumptions
The teams with forecasts included in the ensembles are displayed below. Forecasts are included when they meet a set of submission and data quality requirements, further described here: https://covid19forecasthub.org/doc/ensemble.
Ensemble and individual team forecast performance is evaluated using a variety of metrics, including the assessment of prediction interval coverage, available at https://delphi.cmu.edu/forecast-eval/.
Reported daily new hospital admissions can vary due to variable staffing and inconsistent reporting patterns within the week. Thus, daily variations in the reported numbers and the forecasts may not fully represent the true number of confirmed COVID-19 hospital admissions in each jurisdiction on a specific day.
The forecasts make different assumptions about social distancing measures and use different methods and data sets to estimate the number of new hospital admissions. Additional individual model details are available here: https://github.com/cdcepi/COVID-19-Forecasts/blob/master/COVID-19_Forecast_Model_Descriptions.md.
Intervention assumptions fall into multiple categories:
- These modeling groups make assumptions about how levels of social distancing will change in the future:
- Columbia University (Model: Columbia)
- These modeling groups assume that existing social distancing measures in each jurisdiction will continue through the projected 4-week time period:
- Georgia Institute of Technology, College of Computing (Model: GT-DeepCOVID)
- Johns Hopkins University, Applied Physics Lab (Model: JHU-APL)
- Johns Hopkins University, Applied Physics Lab (Model: Gecko)
- Masaryk University (Model: Masaryk)
- University of Southern California (Model: USC)
- The University of Virginia (Model: UVA)
1 The full range of the prediction intervals is not visible for all state plots. Please see the forecast data for the full range of state-specific prediction intervals.


