Atmospheric CO2 at Mauna Loa Observatory, 1958-2021. This graph depicts the upward trajectory of carbon dioxide in the atmosphere as measured at the Mauna Loa Atmospheric Baseline Observatory by NOAA and the Scripps Institution of Oceanography. The annual fluctuation is known as the Keeling Curve. Graphic: NOAA Global Monitoring Laboratory

Coronavirus barely slows rising carbon dioxide – Atmospheric CO2 peaks near 420 parts per million in 2021

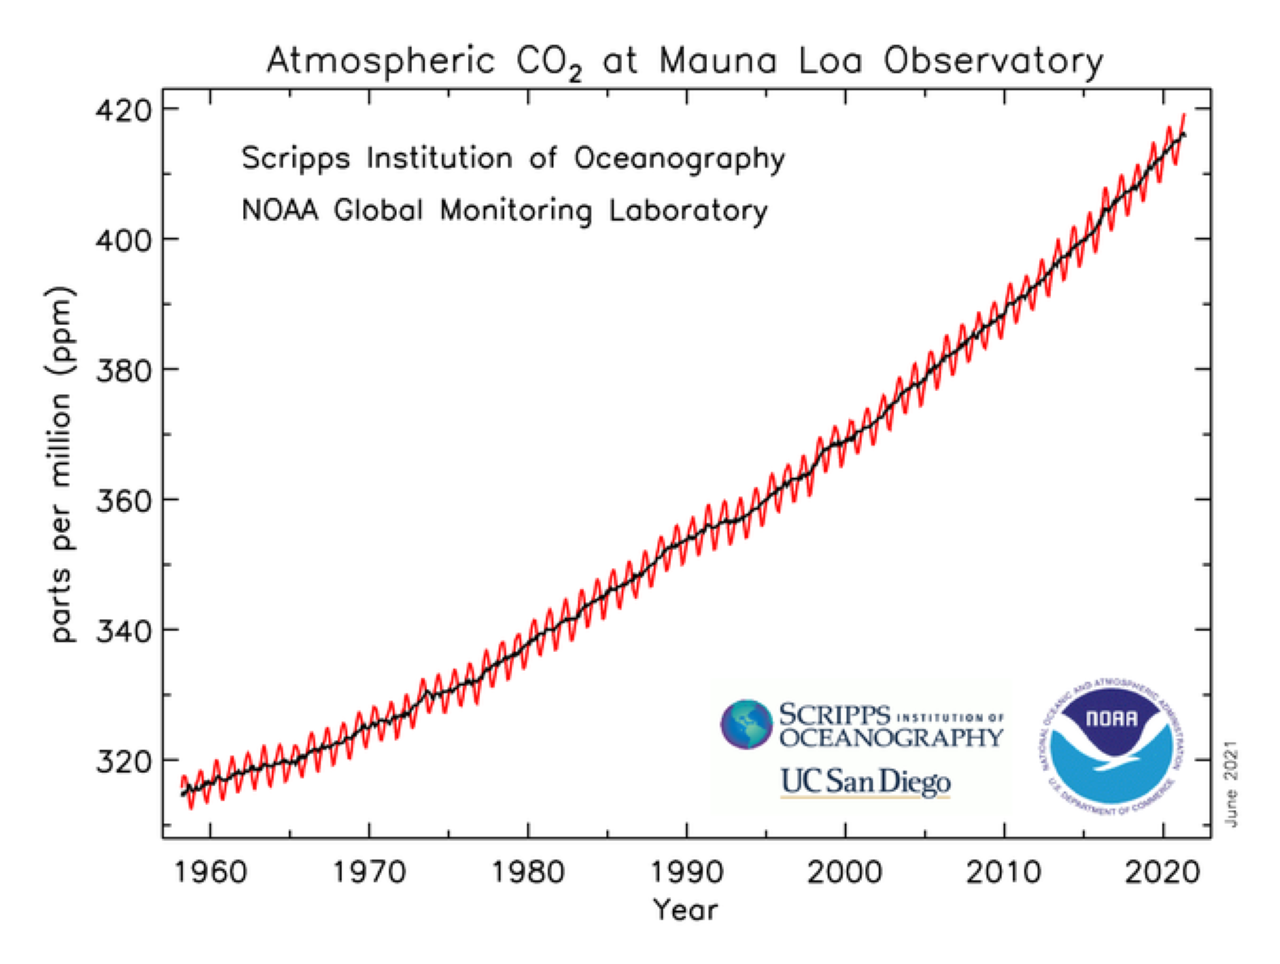
7 June 2021 (NOAA) – Atmospheric carbon dioxide measured at NOAA’s Mauna Loa Atmospheric Baseline Observatory peaked for 2021 in May at a monthly average of 419 parts per million (ppm), the highest level since accurate measurements began 63 years ago, scientists from NOAA and Scripps Institution of Oceanography at the University of California San Diego announced today.  […]

FAO Food Price Index, May 2020-May 2021. The FAO Food Price Index (FFPI) averaged 127.1 points in May 2021, 5.8 points (4.8 percent) higher than in April and as much as 36.1 points (39.7 percent) above the same period last year. The May increase represented the biggest month-on-month gain since October 2010. It also marked the twelfth consecutive monthly rise in the value of the FFPI to its highest value since September 2011, bringing the Index only 7.6 percent below its peak value of 137.6 points registered in February 2011. The sharp increase in May reflected a surge in prices for oils, sugar and cereals along with firmer meat and dairy prices. Graphic: UN FAO

Global food prices rise at rapid pace in May 2021 – Food Price Index hits highest value since September 2011, only 7.6 percent below its all-time peak

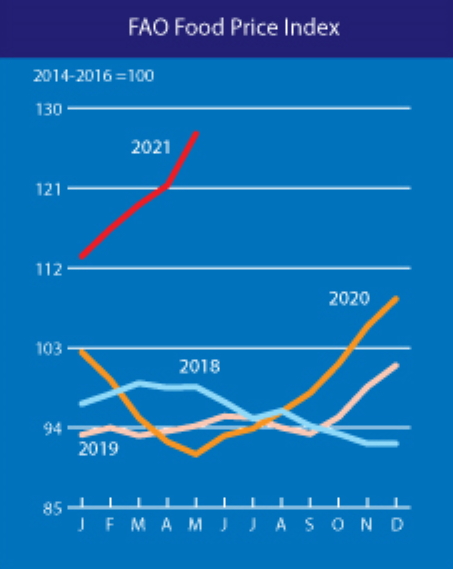
ROME, 4 June 2021 (FAO) – Global food prices rose in May at their fastest monthly rate in more than a decade, even as world cereal production is on course to reach a new record high, the Food and Agriculture Organization of the United Nations (FAO) reported today. The FAO Food Price Index averaged 127.1 points in […]

Social media & sharing icons powered by UltimatelySocial