EIA energy report explores impact of COVID-19 on U.S. energy mix through 2050 – Return to 2019 levels of U.S. energy consumption to take years – Energy-related CO2 emissions fall before leveling off or rising
By Ari Kahan
3 February 2021
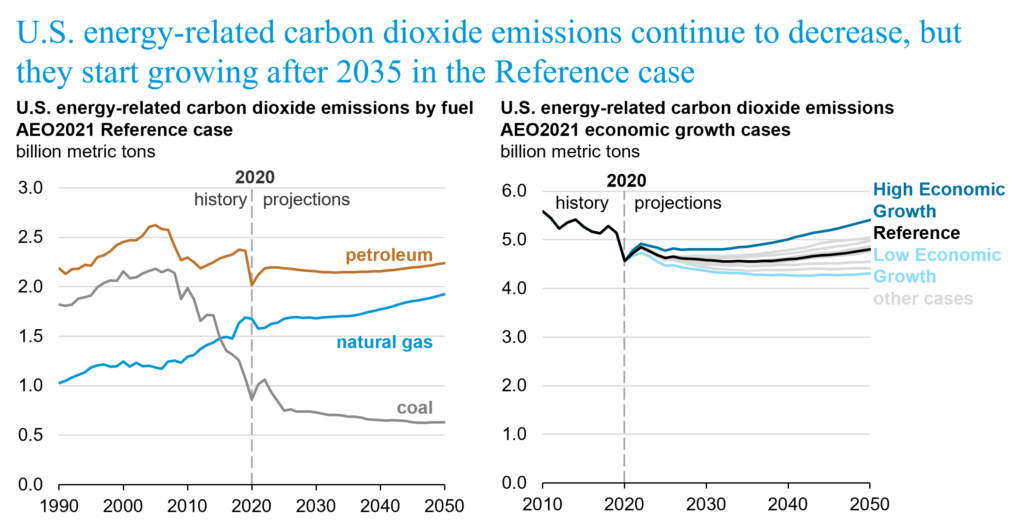
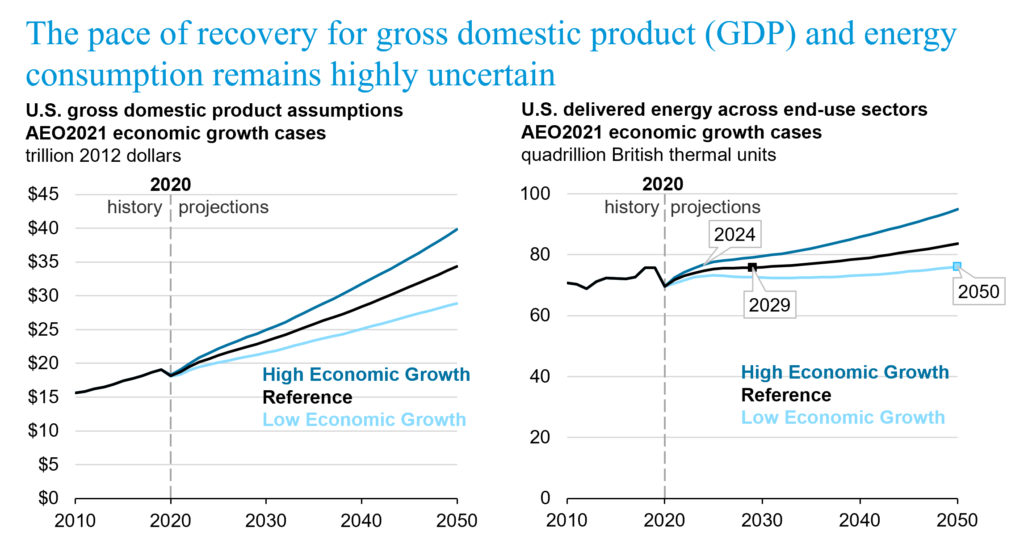
(EIA) – The United States will likely take years to return to 2019 levels of energy consumption and carbon dioxide emissions following the impact of COVID-19 on the U.S. economy and global energy sector, according to projections in the U.S. Energy Information Administration’s (EIA) Annual Energy Outlook 2021 (AEO2021).
EIA’s projections in AEO2021 rely on a Reference case, which serves as a baseline modeled projection designed to explore varying assumptions about technology, policy, and the economy. The Reference case examines a future in which slower growth in consumption in an increasingly energy-efficient U.S. economy contrasts with increasing energy supply because of technological progress in renewable sources, oil, and natural gas. Alternative cases in the report consider variations in economic growth, commodity prices and supply, and technology costs. EIA projections are subject to heightened levels of uncertainty because of the ongoing effects of COVID-19.
“It will take a while for the energy sector to get to its new ‘normal,’” said EIA Acting Administrator Stephen Nalley. “The pandemic triggered a historic energy demand shock that led to lower greenhouse gas emissions, decreases in energy production, and sometimes volatile commodity prices in 2020. The pace of economic recovery, advances in technology, changes in trade flows, and energy incentives will determine how the United States produces and consumes energy in the future.”
Some of the key findings from AEO2021 are discussed below.
Returning to 2019 levels of U.S. energy consumption takes years; energy-related carbon dioxide emissions fall further before leveling off or rising.
EIA projects that total U.S. energy consumption will return to 2019 levels by 2029, although that projection is highly dependent on the pace of U.S. economic recovery. In a case that assumes low economic growth, energy consumption does not return to 2019 levels until 2050. In most cases, EIA projects that U.S. energy-related CO2 emissions will decrease through 2035 and then increase.
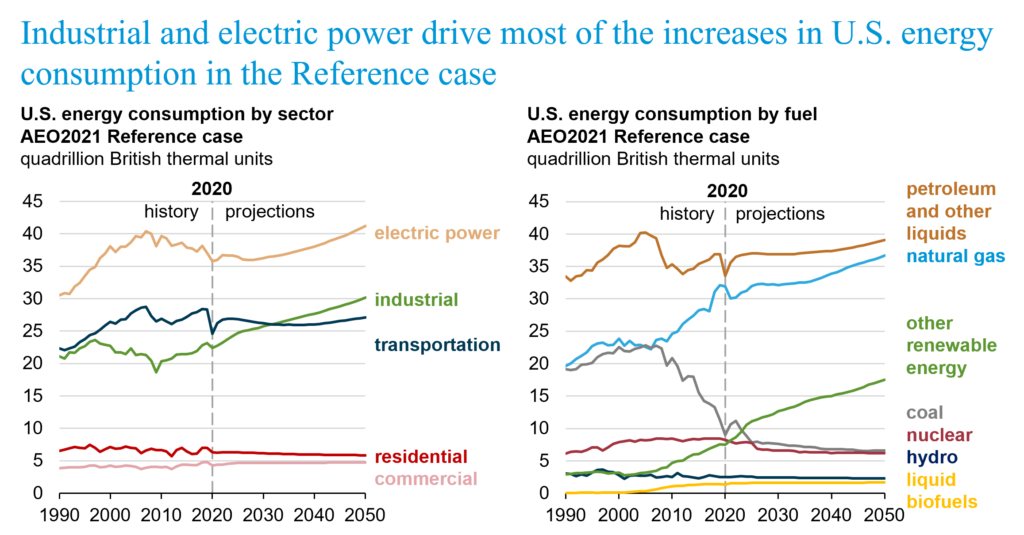
Renewable energy incentives and falling technology costs support robust competition with natural gas as coal and nuclear power decrease in the electricity mix.
EIA projects that electricity demand will largely return to 2019 levels by 2025. Renewable electric generating technologies are projected to account for almost 60% of the capacity additions from 2020 to 2050, and EIA projects that renewables’ share of the electricity generation mix will more than double by 2050. The natural gas share will remain relatively flat at 36%, and the coal and nuclear shares will both fall by about half, according to baseline projections in AEO2021.
Ongoing record domestic energy production supports natural gas exports but does not necessarily mean growth in the U.S. trade balance in petroleum products.
EIA projects that the United States will continue to export more petroleum and other liquids than it imports, but the balance of imports to exports will be highly sensitive to supply, demand, and price factors. High oil and natural gas supply or high oil prices could result in increased domestic production and net exports. If prices or supply remain high, the United States is likely to export more energy than it imports through 2050.
Sign up to receive email notifications for future AEO2021 release materials.
EIA’s AEO2021 explores the impact of COVID-19 on the U.S. energy mix through 2050
I’m having trouble getting these charts to show an average warming trend. Is it possible the charts are wrong?
https://www.ncdc.noaa.gov/cag/national/time-series/110/tavg/all/7/2011-2019?trend=true&trend_base=10&begtrendyear=2011&endtrendyear=2020
Never mind. The person that sent me this was using very dubious start and end dates, to make it appear as if there was no warming trend. After entering earlier start dates and displaying trend the warming is clear.
Hi Bill,
I’m glad you got that straightened out. It’s a common tactic of the antiscience forces to “hide the incline” by posting highly cherry-picked date ranges.
Thanks for reading!
Des