World Happiness Report 2020: Rapid increase in negative affect over last decade continues, driven by sadness, worry, and anger
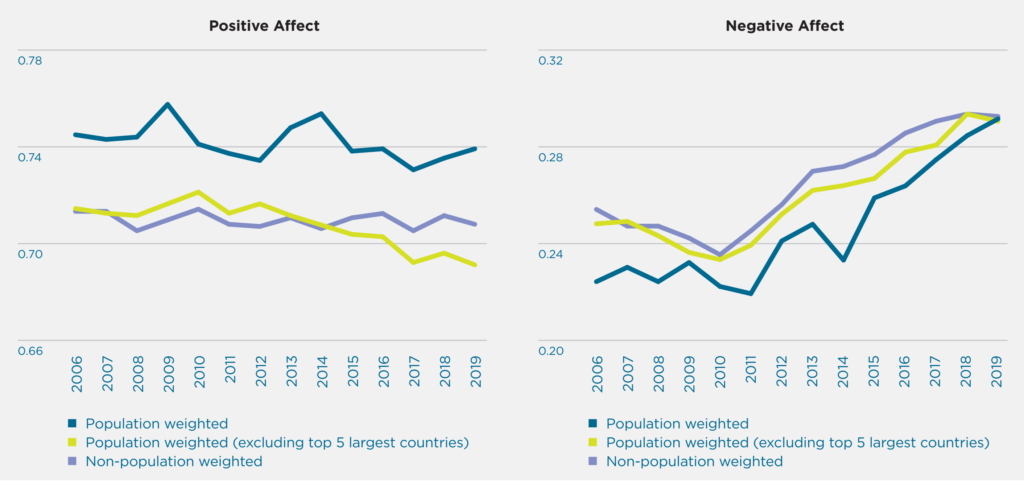
20 March 2020 (Sustainable Development Solutions Network) – […] We next examine the global pattern of positive and negative affect in the third and fourth panels of Figure 2.2. Each figure has the same structure for life evaluations as in the first panel. There is no striking trend in the evolution of positive affect, except that the population-weighted series excluding the five largest countries declined mildly since 2010. The population-weighted series show slightly, but significantly, more positive affect than does the unweighted series, showing that positive affect is on average higher in the larger countries.
In contrast to the relative stability of positive affect over the study period, there has been a rapid increase in negative affect, as shown in the last panel of Figure 2.2. All three lines consistently show a generally increasing trend since 2010 or 2011, indicating that citizens in both large and small countries have experienced increasing negative affect. The increase is sizable. In 2011, about 22% of world adult population reported negative affect, increasing to 29.3% in 2019. In other words, the share of adults reporting negative affect increased by almost 1% per year during this period. Seen in the context of political polarization, civil and religions conflicts, and unrest in many countries, these results created considerable interest when first revealed in World Happiness Report 2019. Readers were curious to know in particular which negative emotions were responsible for this increase. We have therefore unpacked the changes in negative affect into their three components: worry, sadness, and anger.
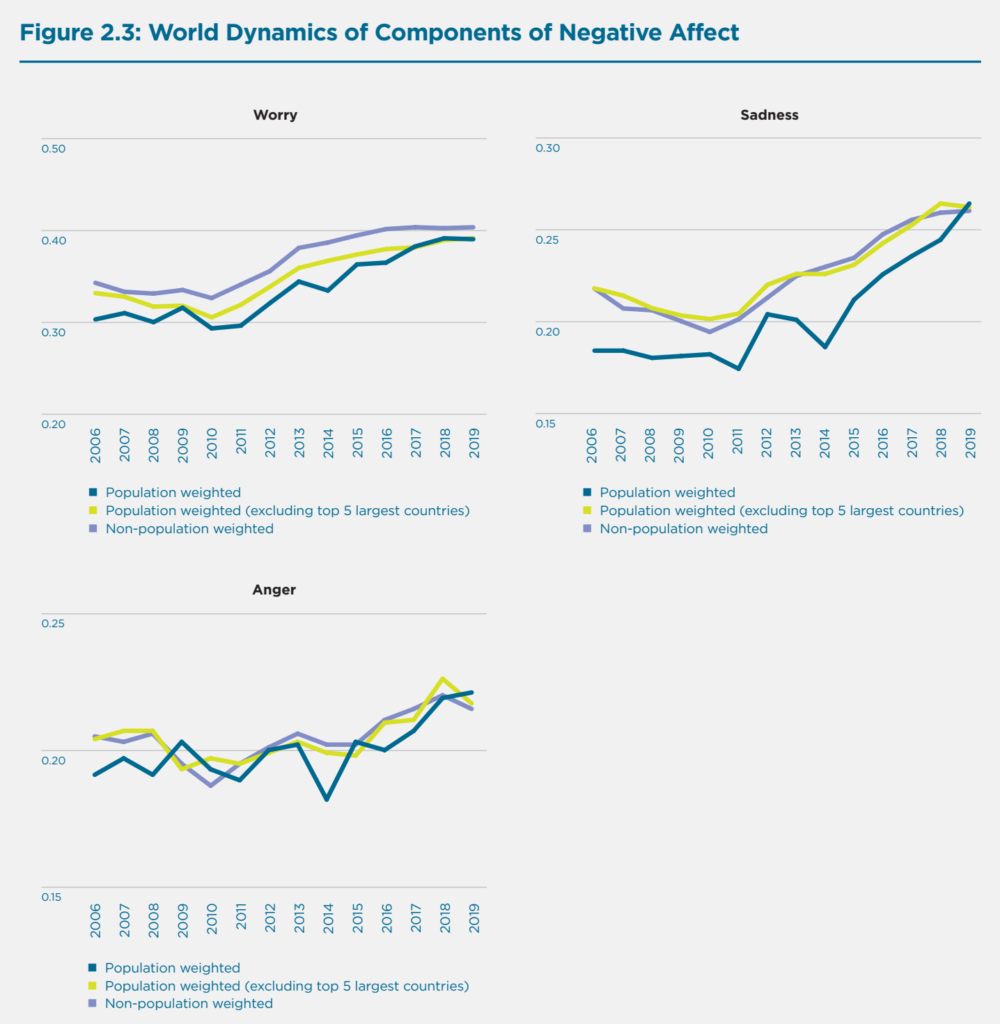
Figure 2.3 illustrates the global trends for worry, sadness, and anger, while the changes for each individual country are shown in Tables 16 to 18 of Statistical Appendix 1. Figure 2.3, like Figure 2.2, shows three lines for each emotion, representing a population-weighted average, a population-weighted average excluding the five most populous countries, and an unweighted average. The first panel shows the trends for worry. The three lines move in the same direction, starting to increase about 2010. People reporting worry yesterday increased by around 8~10% in the 9 years span. Sadness is much less frequent than worry, although the trend is very similar. The share of respondents reporting sadness yesterday increases by around 7~9% since 2010 or 2011. Anger yesterday in the third panel also shows an upward trend in recent years, but contributes very little to the rising trend for negative affect. The rise is almost entirely due to sadness and worry, with the latter being a slightly bigger contributor. Comparable data for other emotions, including stress, are shown in Statistical Appendix 2. [more]