The signal of human-caused climate change has emerged in everyday weather, study finds – “Weather is climate change if you look over the whole globe”
By Andrew Freedman
2 January 2020
(The Washington Post) – For the first time, scientists have detected the “fingerprint” of human-induced climate change on daily weather patterns at the global scale.
If verified by subsequent work, the findings, published Thursday in Nature Climate Change, would upend the long-established narrative that daily weather is distinct from long-term climate change.
The study’s results also imply that research aimed at assessing the human role in contributing to extreme weather events such as heat waves and floods may be underestimating the contribution.
The new study, which was in part motivated by President Trump’s tweets about how a cold day in one particular location disproves global warming, uses statistical techniques and climate model simulations to evaluate how daily temperatures and humidity vary around the world. Scientists compared the spatial patterns of these variables with what physical science shows is expected because of climate change.
The study concludes that the spatial patterns of global temperature and humidity are, in fact, distinguishable from natural variability, and have a human component to them. Going further, the study concludes that the long-term climate trend in global average temperature can be predicted if you know a single day’s weather information worldwide.
This is telling us that anthropogenic climate change has become so large that it exceeds even daily weather variability at the global scale. This is disturbing as the Earth is on track for significantly more warming in even the most optimistic future scenarios.
Michael Wehner, senior staff scientist in the Computational Research Division at the Lawrence Berkeley National Laboratory
According to study co-author Reto Knutti of ETH Zurich, the research alters what we can say about how weather and climate change are connected. “We’ve always said when you look at weather that’s not the same as climate,” he said. “That’s still true locally, if you are in one particular place and you only know the weather right now, right here, there isn’t much you can say.”
However, on a global scale, that is no longer true, Knutti said. “Global mean temperature on a single day is already quite a bit shifted. You can see this human fingerprint in any single moment.
“Weather is climate change if you look over the whole globe,” he said. […]
In what one outside expert, Michael Wehner of Lawrence Berkeley National Laboratory, termed a “profoundly disturbing” result, the study found that the global warming fingerprint remained present even when the signal from the global average temperature trend was removed.
“This … is telling us that anthropogenic climate change has become so large that it exceeds even daily weather variability at the global scale,” Wehner said in an email. “This is disturbing as the Earth is on track for significantly more warming in even the most optimistic future scenarios.” [more]
The signal of human-caused climate change has emerged in everyday weather, study finds
Climate signal recognizable in the weather
By Peter Rüegg
2 January 2020
(ETH Zürich) – Climate researchers can now see the fingerprint of global warming in daily weather observations on a global scale. In doing so, they complement the long-standing paradigm: weather is not the same as climate, but climate change is now detectable in daily weather.
In October this year, weather forecasters in the US state of Utah recorded the lowest temperature ever recorded in October in the US (outside Alaska): -37.1°C. The previous October cold record was -35°C. And some people have probably wondered where climate change has gone.
Climate is not the same as weather, climate researchers have said. Climate is what you expect in the long term, weather, what you get in the short term. And since the local weather is very variable, it can be very cold in one place in the short term, despite long-term global warming. In short, the variability of local weather obscures long-term global climate trends.
The tilted paradigm
Now, however, a group of scientists led by ETH Professor Reto Knutti has re-analyzed temperature readings and models. The scientists conclude that the weather-is-not-equal-climate paradigm no longer applies in this form. According to the researchers, the climate signal, i.e. the long-term trend towards warming, can actually be read from the daily weather data such as air temperatures at the surface and humidity, provided that global spatial pattern are taken into account.
In other words, despite global warming, there may well be a cold record in the US in October. If it is above average in other regions at the same time, then this deviation is almost completely erased. “In order to discover the signal for climate change in daily weather events, a global approach is necessary, not a regional one,” says Sebastian Sippel, postdoctoral researcher at Reto Knutti and first author of a study has just been published in “Nature Climate Change”.
Extracting the fingerprint of climate change
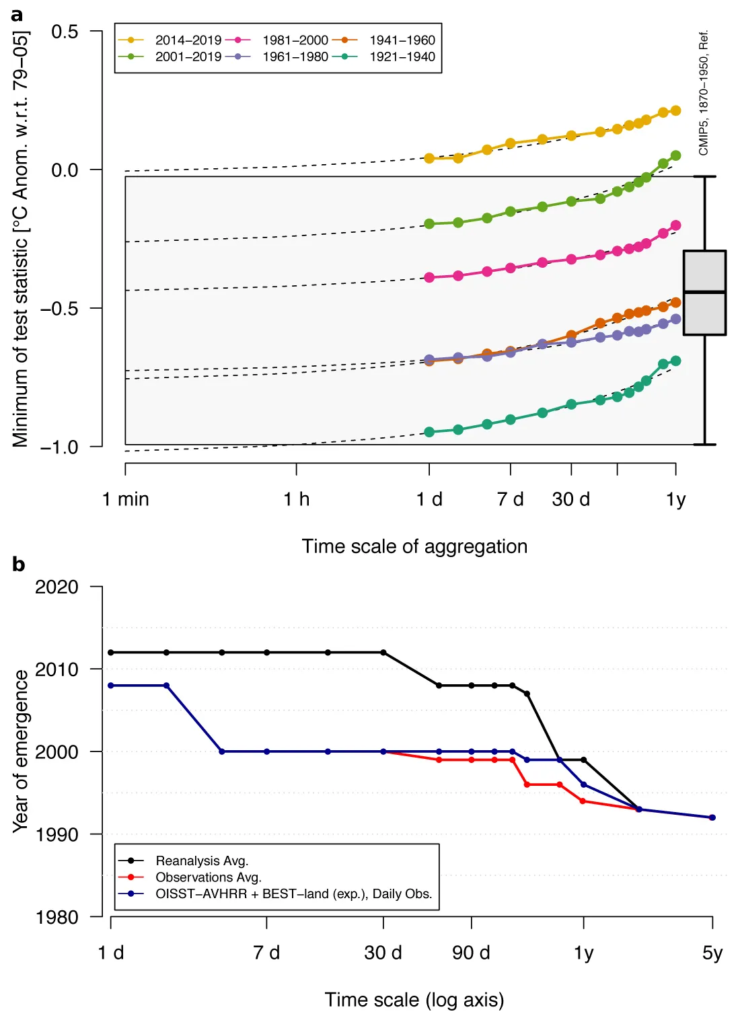
To detect the climate signal in daily weather records, Sippel and colleagues used statistical learning methods, combining simulations with climate models and data from measurement stations. Statistical learning methods can extract a so-called “fingerprint” of climate change from the combination of temperatures in different regions and the respective ratio of warming and variability. By systematically evaluating the model simulations, they can identify the climate fingerprint in the global measurement data on any given day since spring 2012.
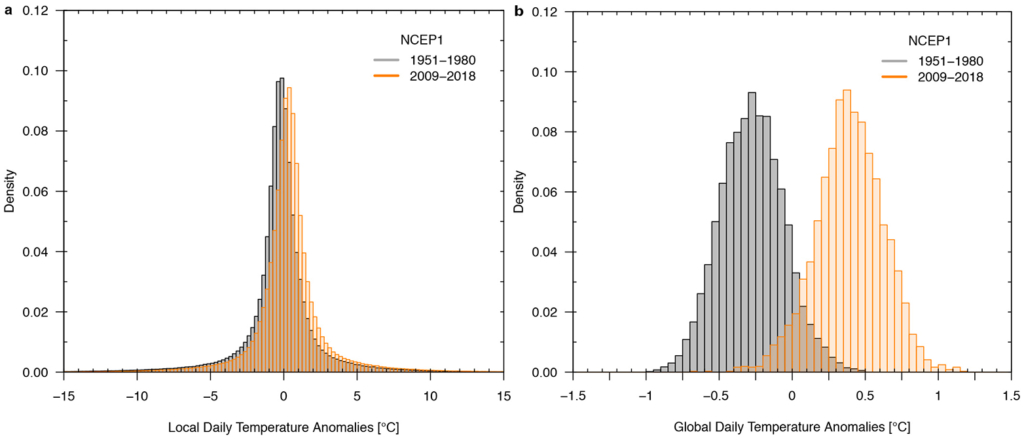
Comparing the variability of local and global daytime average temperatures shows why the global approach is important. While locally measured daily mean temperatures (even after deduction of seasonal fluctuations) can fluctuate very strongly, calculated global daily averages are in a very narrow range of daily Area.
If one now compares the distribution of the global daily averages from 1951 to 1980 with those from 2009 to 2018, then the two mean distributions (bell curves) hardly overlap. In the global values, therefore, the climate signal is clearly present, while it is obscured in the local values, since the distribution of the daily averages in the two periods overlaps quite sharply.
Apply method to water cycle
The findings are likely to have broad implications for climate science. “Weather on a global scale carries important climate information,” says Reto Knutti. “This information could be used, for example, for further studies to quantify changes in the probabilities of extreme events, such as regional cold waves. These studies are based on model calculations, and our approach could then provide global context through the fingerprint of climate change in observations during such regional cold waves. This creates new opportunities for the communication of regional weather events against the background of global warming.”
The study is the result of a collaboration between ETH climate scientists and the Swiss Data Science Center, which ETH Zurich operates together with its sister university EPFL. “This work underlines the fruitful methods of data science for clarifying environmental issues, and the SDSC is of great benefit,” says Knutti.
Methods of data science not only allow to prove the strength of the human “fingerprint”. They also show where on the globe climate change is particularly clear and early on. This is particularly important in the water cycle, where the natural fluctuations vary greatly from day to day and year to year. “This should enable us to identify man-made patterns and trends in other more complicated metrics, such as precipitation, which are difficult to detect with traditional statistics,” says the ETH professor. [Translation by Bing. –Des]
Klimasignal im Wetter erkennbar
Climate change now detectable from any single day of weather at global scale
ABSTRACT: For generations, climate scientists have educated the public that ‘weather is not climate’, and climate change has been framed as the change in the distribution of weather that slowly emerges from large variability over decades1,2,3,4,5,6,7. However, weather when considered globally is now in uncharted territory. Here we show that on the basis of a single day of globally observed temperature and moisture, we detect the fingerprint of externally driven climate change, and conclude that Earth as a whole is warming. Our detection approach invokes statistical learning and climate model simulations to encapsulate the relationship between spatial patterns of daily temperature and humidity, and key climate change metrics such as annual global mean temperature or Earth’s energy imbalance. Observations are projected onto this relationship to detect climate change. The fingerprint of climate change is detected from any single day in the observed global record since early 2012, and since 1999 on the basis of a year of data. Detection is robust even when ignoring the long-term global warming trend. This complements traditional climate change detection, but also opens broader perspectives for the communication of regional weather events, modifying the climate change narrative: while changes in weather locally are emerging over decades, global climate change is now detected instantaneously.
Climate change now detectable from any single day of weather at global scale